Work and Jobs in Orange, Connecticut (CT) Detailed Stats
Occupations, Industries, Unemployment, Workers, Commute
Settings
X


Discuss Orange, Connecticut work on our local forum with over 2,400,000 registered users
Latest news about work in Orange, CT collected exclusively by city-data.com from local newspapers, TV, and radio stations
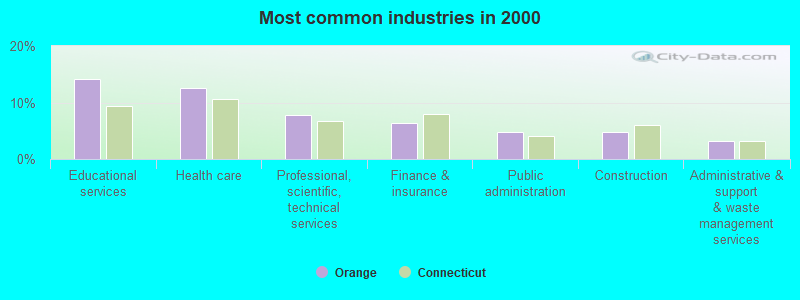
The most common industries in Orange are: Educational services (14.1% of civilian employees), Health care (12.5% of civilian employees), Professional, scientific, technical services (7.7% of civilian employees). 61.9% of workers work in New Haven County and 11.9% of all workers work at home. 60.5% of workers are employees of private companies, which is 9.0% less than the rate of 65.9% across the entire state of Connecticut.
Whole page based on the data from 2000 / 2022 when the population of Orange, Connecticut was 13,233 / 14,290
Whole page based on the data from 2000 / 2022 when the population of Orange, Connecticut was 13,233 / 14,290
Most common industries
Most common industries | |||
|---|---|---|---|
Industry | All | Males | Females |
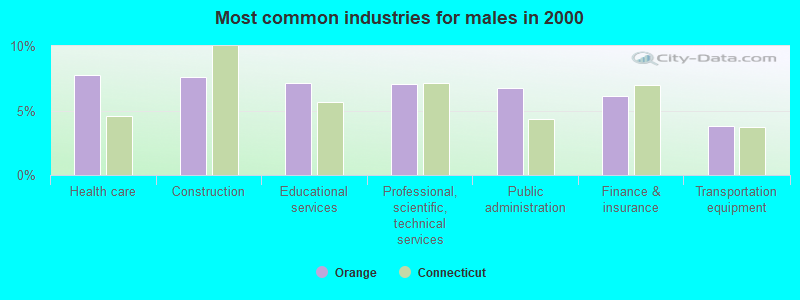
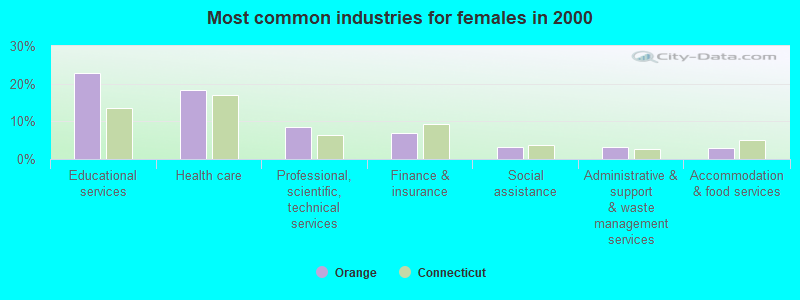
| Educational services | 14.1% (911) | 7.1% (256) | 22.8% (655) |
| Health care | 12.5% (806) | 7.8% (278) | 18.3% (528) |
| Professional, scientific, and technical services | 7.7% (498) | 7.1% (254) | 8.5% (244) |
| Finance and insurance | 6.5% (417) | 6.1% (219) | 6.9% (198) |
| Public administration | 4.9% (314) | 6.8% (242) | 2.5% (72) |
| Construction | 4.8% (307) | 7.6% (271) | 1.3% (36) |
| Administrative and support and waste management services | 3.2% (206) | 3.2% (115) | 3.2% (91) |
| Real estate and rental and leasing | 2.9% (186) | 3.2% (113) | 2.5% (73) |
| Transportation equipment | 2.5% (163) | 3.8% (137) | 0.9% (26) |
| Metal and metal products | 2.4% (154) | 3.8% (137) | 0.6% (17) |
| Chemicals | 2.3% (146) | 3.0% (107) | 1.4% (39) |
| Broadcasting and telecommunications | 2.2% (141) | 1.9% (69) | 2.5% (72) |
| Miscellaneous manufacturing | 2.1% (135) | 3.0% (108) | 0.9% (27) |
| Accommodation and food services | 2.1% (134) | 1.3% (48) | 3.0% (86) |
| Computer and electronic products | 2.0% (128) | 2.9% (105) | 0.8% (23) |
| Arts, entertainment, and recreation | 1.9% (120) | 2.6% (93) | 0.9% (27) |
| Social assistance | 1.6% (106) | 0.3% (11) | 3.3% (95) |
| Machinery | 1.5% (95) | 2.3% (83) | 0.4% (12) |
| Used merchandise, gift, novelty, and souvenir, and other miscellaneous stores | 1.3% (85) | 1.6% (57) | 1.0% (28) |
| Motor vehicle and parts dealers | 1.3% (81) | 1.9% (67) | 0.5% (14) |
| Religious, grantmaking, civic, professional, and similar organizations | 1.1% (68) | 0.5% (19) | 1.7% (49) |
| Pharmacies and drug stores | 1.0% (66) | 0.8% (30) | 1.3% (36) |
| Data processing, libraries, and other information services | 1.0% (65) | 0.9% (32) | 1.1% (33) |
| Repair and maintenance | 0.9% (60) | 1.5% (55) | 0.2% (5) |
| Food and beverage stores | 0.9% (59) | 1.1% (38) | 0.7% (21) |
| Personal and laundry services | 0.9% (56) | 0.8% (27) | 1.0% (29) |
| Drugs, sundries, and chemical and allied products merchant wholesalers | 0.8% (53) | 0.7% (25) | 1.0% (28) |
| Publishing, and motion picture and sound recording industries | 0.8% (50) | 1.1% (38) | 0.4% (12) |
| Radio, TV, and computer stores | 0.7% (46) | 0.9% (33) | 0.5% (13) |
| Miscellaneous nondurable goods merchant wholesalers | 0.7% (44) | 1.1% (39) | 0.2% (5) |
| Other transportation, and support activities, and couriers | 0.6% (41) | 1.0% (36) | 0.2% (5) |
| Building material and garden equipment and supplies dealers | 0.6% (40) | 0.9% (34) | 0.2% (6) |
| U. S. Postal service | 0.5% (35) | 1.0% (35) | 0.0% (0) |
| Electronic shopping and mail-order houses | 0.5% (35) | 0.4% (13) | 0.8% (22) |
| Printing and related support activities | 0.5% (35) | 0.8% (28) | 0.2% (7) |
| Sporting goods, camera, and hobby and toy stores | 0.5% (35) | 0.5% (17) | 0.6% (18) |
| Other direct selling establishments | 0.5% (34) | 0.6% (23) | 0.4% (11) |
| Furniture and home furnishings, and household appliance stores | 0.5% (30) | 0.1% (5) | 0.9% (25) |
| Electrical equipment, appliances, and components | 0.4% (29) | 0.4% (13) | 0.6% (16) |
| Miscellaneous durable goods merchant wholesalers | 0.4% (28) | 0.4% (16) | 0.4% (12) |
| Truck transportation | 0.4% (27) | 0.5% (18) | 0.3% (9) |
| Petroleum and petroleum products merchant wholesalers | 0.4% (26) | 0.7% (26) | 0.0% (0) |
| Clothing and accessories, including shoe, stores | 0.4% (24) | 0.4% (13) | 0.4% (11) |
| Book stores and news dealers | 0.3% (22) | 0.4% (14) | 0.3% (8) |
| Electrical and electronic goods merchant wholesalers | 0.3% (22) | 0.6% (22) | 0.0% (0) |
| Textile mills and textile products | 0.3% (20) | 0.3% (9) | 0.4% (11) |
| Rail transportation | 0.3% (19) | 0.4% (13) | 0.2% (6) |
| Professional and commercial equipment and supplies merchant wholesalers | 0.3% (19) | 0.1% (4) | 0.5% (15) |
| Apparel | 0.3% (19) | 0.2% (7) | 0.4% (12) |
| Alcoholic beverages merchant wholesalers | 0.3% (18) | 0.5% (18) | 0.0% (0) |
| Private households | 0.3% (18) | 0.3% (9) | 0.3% (9) |
| Jewelry, luggage, and leather goods stores | 0.3% (17) | 0.2% (6) | 0.4% (11) |
| Department and other general merchandise stores | 0.3% (17) | 0.2% (6) | 0.4% (11) |
| Utilities | 0.2% (16) | 0.2% (7) | 0.3% (9) |
| Plastics and rubber products | 0.2% (16) | 0.3% (11) | 0.2% (5) |
| Agriculture, forestry, fishing and hunting | 0.2% (15) | 0.0% (0) | 0.5% (15) |
| Furniture and related product manufacturing | 0.2% (13) | 0.4% (13) | 0.0% (0) |
| Paper | 0.1% (9) | 0.0% (0) | 0.3% (9) |
| Food | 0.1% (8) | 0.2% (8) | 0.0% (0) |
| Furniture and home furnishing merchant wholesalers | 0.1% (8) | 0.2% (8) | 0.0% (0) |
| Sewing, needlework, and piece goods stores | 0.1% (7) | 0.0% (0) | 0.2% (7) |
| Management of companies and enterprises | 0.1% (7) | 0.2% (7) | 0.0% (0) |
| Warehousing and storage | 0.1% (6) | 0.2% (6) | 0.0% (0) |
| Petroleum and coal products | 0.1% (6) | 0.2% (6) | 0.0% (0) |
| Fuel dealers | 0.1% (5) | 0.1% (5) | 0.0% (0) |
| Groceries and related products merchant wholesalers | 0.1% (5) | 0.1% (5) | 0.0% (0) |
| Paper and paper products merchant wholesalers | 0.1% (5) | 0.1% (5) | 0.0% (0) |
| Motor vehicles, parts and supplies merchant wholesalers | 0.1% (5) | 0.1% (5) | 0.0% (0) |
| Recyclable material merchant wholesalers | 0.1% (4) | 0.1% (4) | 0.0% (0) |
Unemployment in Orange
- Unemployment by race in 2022
- Unemployment rate for White non-Hispanic residents
- 2.2%Males
- 4.5%Females
- Unemployment rate for Black residents
- 3.7%Females
- Unemployment rate for Asian residents
- 1.2%Males
- 1.4%Females
- Unemployment by race in 2000
- Unemployment rate for White non-Hispanic residents
- 3.0%Males
- 2.8%Females
- Unemployment rate for other race residents
- 40.0%Males
- Unemployment rate for Hispanic or Latino residents
- 16.7%Males
Time leaving home to go to work

12:00 a.m. to 4:59 a.m.:
| Orange: | 1.4% (82) |
| Connecticut: | 3.8% (58,545) |
5:00 a.m. to 5:29 a.m.:
| Orange: | 1.5% (89) |
| Connecticut: | 2.6% (39,530) |
5:30 a.m. to 5:59 a.m.:
| Orange: | 2.1% (125) |
| Connecticut: | 4.4% (68,313) |
6:00 a.m. to 6:29 a.m.:
| Orange: | 5.8% (345) |
| Connecticut: | 8.2% (126,765) |
6:30 a.m. to 6:59 a.m.:
| Orange: | 11.5% (688) |
| Connecticut: | 10.2% (156,057) |
7:00 a.m. to 7:29 a.m.:
| Orange: | 16.3% (976) |
| Connecticut: | 13.9% (213,958) |
7:30 a.m. to 7:59 a.m.:
| Orange: | 14.3% (855) |
| Connecticut: | 12.7% (194,512) |
8:00 a.m. to 8:29 a.m.:
| Orange: | 20.0% (1,195) |
| Connecticut: | 12.7% (195,728) |
8:30 a.m. to 8:59 a.m.:
| Orange: | 8.6% (512) |
| Connecticut: | 7.5% (115,107) |
9:00 a.m. to 9:59 a.m.:
| Orange: | 6.4% (382) |
| Connecticut: | 6.7% (102,921) |
10:00 a.m. to 10:59 a.m.:
| Orange: | 3.3% (196) |
| Connecticut: | 3.2% (49,596) |
11:00 a.m. to 11:59 a.m.:
| Orange: | 1.2% (71) |
| Connecticut: | 1.5% (22,769) |
12:00 p.m. to 3:59 p.m.:
| Orange: | 3.7% (224) |
| Connecticut: | 6.8% (104,289) |
4:00 p.m. to 11:59 p.m.:
| Orange: | 3.7% (219) |
| Connecticut: | 5.8% (89,151) |

<5am:
| Orange: | 0.9% (60) |
| Connecticut: | 2.2% (35,436) |
5:30am:
| Orange: | 1.1% (70) |
| Connecticut: | 2.0% (32,039) |
6am:
| Orange: | 2.0% (127) |
| Connecticut: | 3.5% (57,499) |
6:30am:
| Orange: | 5.5% (347) |
| Connecticut: | 7.5% (123,062) |
7am:
| Orange: | 8.6% (542) |
| Connecticut: | 10.9% (179,325) |
7:30am:
| Orange: | 14.5% (916) |
| Connecticut: | 14.8% (242,766) |
8am:
| Orange: | 20.0% (1,266) |
| Connecticut: | 16.2% (265,137) |
8:30am:
| Orange: | 14.0% (889) |
| Connecticut: | 13.1% (214,263) |
9am:
| Orange: | 10.0% (633) |
| Connecticut: | 6.8% (110,992) |
10am:
| Orange: | 10.5% (665) |
| Connecticut: | 5.6% (91,313) |
11am:
| Orange: | 1.1% (72) |
| Connecticut: | 2.0% (33,574) |
12pm:
| Orange: | 0.8% (52) |
| Connecticut: | 1.0% (15,996) |
4pm:
| Orange: | 3.4% (217) |
| Connecticut: | 6.3% (102,744) |
>4pm:
| Orange: | 3.5% (221) |
| Connecticut: | 5.2% (85,259) |

12:00 a.m. to 4:59 a.m. - Males:
| Orange: | 2.0% (59) |
| Connecticut: | 5.0% (40,451) |
5:00 a.m. to 5:29 a.m. - Males:
| Orange: | 1.8% (53) |
| Connecticut: | 3.6% (28,917) |
5:30 a.m. to 5:59 a.m. - Males:
| Orange: | 4.0% (118) |
| Connecticut: | 5.9% (47,322) |
6:00 a.m. to 6:29 a.m. - Males:
| Orange: | 8.9% (260) |
| Connecticut: | 9.9% (80,180) |
6:30 a.m. to 6:59 a.m. - Males:
| Orange: | 10.8% (318) |
| Connecticut: | 10.8% (87,477) |
7:00 a.m. to 7:29 a.m. - Males:
| Orange: | 17.9% (525) |
| Connecticut: | 13.9% (112,702) |
7:30 a.m. to 7:59 a.m. - Males:
| Orange: | 10.7% (315) |
| Connecticut: | 11.2% (90,454) |
8:00 a.m. to 8:29 a.m. - Males:
| Orange: | 16.1% (474) |
| Connecticut: | 11.1% (89,543) |
8:30 a.m. to 8:59 a.m. - Males:
| Orange: | 9.8% (289) |
| Connecticut: | 6.3% (50,707) |
9:00 a.m. to 9:59 a.m. - Males:
| Orange: | 5.4% (159) |
| Connecticut: | 6.0% (48,551) |
10:00 a.m. to 10:59 a.m. - Males:
| Orange: | 4.6% (135) |
| Connecticut: | 3.1% (25,063) |
11:00 a.m. to 11:59 a.m. - Males:
| Orange: | 1.1% (32) |
| Connecticut: | 1.4% (11,214) |
12:00 p.m. to 3:59 p.m. - Males:
| Orange: | 2.0% (60) |
| Connecticut: | 6.4% (52,118) |
4:00 p.m. to 11:59 p.m. - Males:
| Orange: | 5.3% (155) |
| Connecticut: | 5.4% (43,872) |

12:00 a.m. to 4:59 a.m. - Females:
| Orange: | 0.7% (22) |
| Connecticut: | 2.5% (18,094) |
5:00 a.m. to 5:29 a.m. - Females:
| Orange: | 1.2% (35) |
| Connecticut: | 1.5% (10,613) |
5:30 a.m. to 5:59 a.m. - Females:
| Orange: | 0.4% (11) |
| Connecticut: | 2.9% (20,991) |
6:00 a.m. to 6:29 a.m. - Females:
| Orange: | 2.8% (86) |
| Connecticut: | 6.4% (46,585) |
6:30 a.m. to 6:59 a.m. - Females:
| Orange: | 12.1% (368) |
| Connecticut: | 9.4% (68,580) |
7:00 a.m. to 7:29 a.m. - Females:
| Orange: | 14.9% (451) |
| Connecticut: | 13.9% (101,256) |
7:30 a.m. to 7:59 a.m. - Females:
| Orange: | 17.6% (535) |
| Connecticut: | 14.3% (104,058) |
8:00 a.m. to 8:29 a.m. - Females:
| Orange: | 23.7% (721) |
| Connecticut: | 14.6% (106,185) |
8:30 a.m. to 8:59 a.m. - Females:
| Orange: | 7.4% (224) |
| Connecticut: | 8.8% (64,400) |
9:00 a.m. to 9:59 a.m. - Females:
| Orange: | 7.3% (223) |
| Connecticut: | 7.5% (54,370) |
10:00 a.m. to 10:59 a.m. - Females:
| Orange: | 2.1% (63) |
| Connecticut: | 3.4% (24,533) |
11:00 a.m. to 11:59 a.m. - Females:
| Orange: | 1.3% (39) |
| Connecticut: | 1.6% (11,555) |
12:00 p.m. to 3:59 p.m. - Females:
| Orange: | 5.5% (168) |
| Connecticut: | 7.2% (52,171) |
4:00 p.m. to 11:59 p.m. - Females:
| Orange: | 2.0% (61) |
| Connecticut: | 6.2% (45,279) |
Travel time to work
Percentage of workers working in this county: 61.9%
Number of people working at home: 837 (11.9% of all workers)
Daytime population change due to commuting: +2,163 (+16.3%)
Workers who live and work in this place: 1,107 (17.5%)
Number of people working at home: 837 (11.9% of all workers)
Daytime population change due to commuting: +2,163 (+16.3%)
Workers who live and work in this place: 1,107 (17.5%)

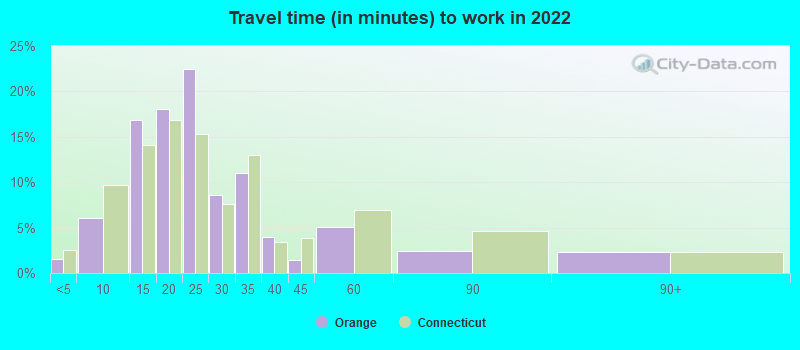

Less than 5 minutes:
| Orange: | 1.5% (155) |
| Connecticut: | 2.5% (36,914) |
5 to 9 minutes:
| Orange: | 6.0% (626) |
| Connecticut: | 9.6% (142,067) |
10 to 14 minutes:
| Orange: | 16.9% (1,753) |
| Connecticut: | 14.1% (207,591) |
15 to 19 minutes:
| Orange: | 18.1% (1,880) |
| Connecticut: | 16.8% (247,587) |
20 to 24 minutes:
| Orange: | 22.5% (2,334) |
| Connecticut: | 15.3% (224,955) |
25 to 29 minutes:
| Orange: | 8.6% (894) |
| Connecticut: | 7.6% (111,679) |
30 to 34 minutes:
| Orange: | 11.0% (1,138) |
| Connecticut: | 13.0% (191,622) |
35 to 39 minutes:
| Orange: | 4.0% (416) |
| Connecticut: | 3.4% (49,861) |
40 to 44 minutes:
| Orange: | 1.4% (144) |
| Connecticut: | 3.9% (57,316) |
45 to 59 minutes:
| Orange: | 5.1% (525) |
| Connecticut: | 6.9% (102,115) |
60 to 89 minutes:
| Orange: | 2.4% (252) |
| Connecticut: | 4.6% (67,390) |
90 or more minutes:
| Orange: | 2.3% (237) |
| Connecticut: | 2.3% (33,578) |


Less than 5 minutes:
| Orange: | 2.1% (131) |
| Connecticut: | 2.9% (47,035) |
5 to 9 minutes:
| Orange: | 8.8% (560) |
| Connecticut: | 10.8% (177,296) |
10 to 14 minutes:
| Orange: | 17.8% (1,127) |
| Connecticut: | 16.1% (264,948) |
15 to 19 minutes:
| Orange: | 20.2% (1,280) |
| Connecticut: | 16.4% (269,915) |
20 to 24 minutes:
| Orange: | 19.1% (1,213) |
| Connecticut: | 14.8% (242,914) |
25 to 29 minutes:
| Orange: | 5.9% (373) |
| Connecticut: | 6.0% (98,144) |
30 to 34 minutes:
| Orange: | 7.2% (458) |
| Connecticut: | 11.2% (184,005) |
35 to 39 minutes:
| Orange: | 1.8% (112) |
| Connecticut: | 2.6% (41,860) |
40 to 44 minutes:
| Orange: | 1.3% (82) |
| Connecticut: | 3.1% (50,084) |
45 to 59 minutes:
| Orange: | 4.6% (291) |
| Connecticut: | 5.9% (96,492) |
60 to 89 minutes:
| Orange: | 5.0% (317) |
| Connecticut: | 4.5% (74,032) |
90 or more minutes:
| Orange: | 2.1% (133) |
| Connecticut: | 2.6% (42,680) |

Less than 5 minutes - Males:
| Orange: | 0.6% (33) |
| Connecticut: | 2.3% (18,200) |
5 to 9 minutes - Males:
| Orange: | 7.0% (371) |
| Connecticut: | 9.1% (70,667) |
10 to 14 minutes - Males:
| Orange: | 16.6% (875) |
| Connecticut: | 13.0% (101,072) |
15 to 19 minutes - Males:
| Orange: | 15.1% (799) |
| Connecticut: | 15.5% (120,344) |
20 to 24 minutes - Males:
| Orange: | 19.3% (1,019) |
| Connecticut: | 14.8% (114,908) |
25 to 29 minutes - Males:
| Orange: | 7.9% (419) |
| Connecticut: | 7.6% (58,765) |
30 to 34 minutes - Males:
| Orange: | 12.3% (647) |
| Connecticut: | 13.5% (104,684) |
35 to 39 minutes - Males:
| Orange: | 5.0% (262) |
| Connecticut: | 3.3% (25,589) |
40 to 44 minutes - Males:
| Orange: | 2.3% (120) |
| Connecticut: | 4.1% (31,958) |
45 to 59 minutes - Males:
| Orange: | 7.4% (391) |
| Connecticut: | 8.4% (65,295) |
60 to 89 minutes - Males:
| Orange: | 4.4% (234) |
| Connecticut: | 5.6% (43,405) |
90 or more minutes - Males:
| Orange: | 1.6% (82) |
| Connecticut: | 2.7% (21,092) |

Less than 5 minutes - Females:
| Orange: | 2.5% (128) |
| Connecticut: | 2.7% (18,714) |
5 to 9 minutes - Females:
| Orange: | 5.1% (261) |
| Connecticut: | 10.2% (71,400) |
10 to 14 minutes - Females:
| Orange: | 17.2% (877) |
| Connecticut: | 15.3% (106,519) |
15 to 19 minutes - Females:
| Orange: | 21.3% (1,084) |
| Connecticut: | 18.3% (127,243) |
20 to 24 minutes - Females:
| Orange: | 25.8% (1,313) |
| Connecticut: | 15.8% (110,047) |
25 to 29 minutes - Females:
| Orange: | 9.3% (474) |
| Connecticut: | 7.6% (52,914) |
30 to 34 minutes - Females:
| Orange: | 9.7% (492) |
| Connecticut: | 12.5% (86,938) |
35 to 39 minutes - Females:
| Orange: | 2.9% (148) |
| Connecticut: | 3.5% (24,272) |
40 to 44 minutes - Females:
| Orange: | 0.5% (26) |
| Connecticut: | 3.6% (25,358) |
45 to 59 minutes - Females:
| Orange: | 2.8% (143) |
| Connecticut: | 5.3% (36,820) |
60 to 89 minutes - Females:
| Orange: | 0.5% (26) |
| Connecticut: | 3.4% (23,985) |
90 or more minutes - Females:
| Orange: | 3.2% (162) |
| Connecticut: | 1.8% (12,486) |
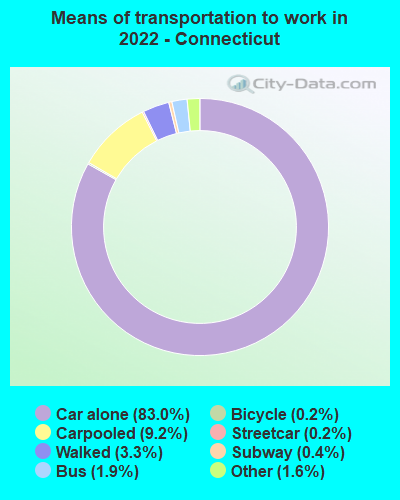
Means of transportation to work
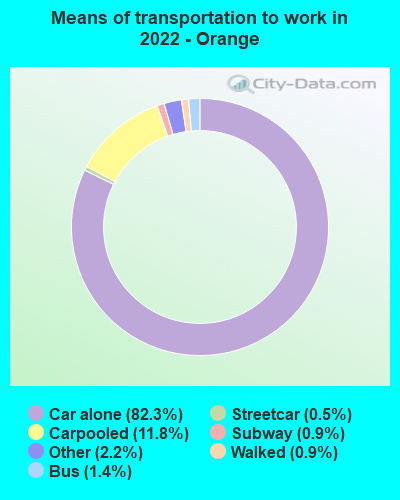
Drove car alone:
| Orange: | 82.3% (8,903) |
| Connecticut: | 83.0% (571,430) |
Carpooled:
| Orange: | 11.8% (1,279) |
| Connecticut: | 9.2% (66,348) |
Bus:
| Orange: | 1.4% (146) |
| Connecticut: | 1.9% (17,232) |
Subway or elevated rail:
| Orange: | 0.5% (49) |
| Connecticut: | 0.2% (1,929) |
Long-distance train or commuter rail:
| Orange: | 0.9% (100) |
| Connecticut: | 0.4% (2,105) |
Walked:
| Orange: | 0.9% (100) |
| Connecticut: | 3.3% (23,331) |
Other means:
| Orange: | 2.2% (239) |
| Connecticut: | 1.6% (13,019) |

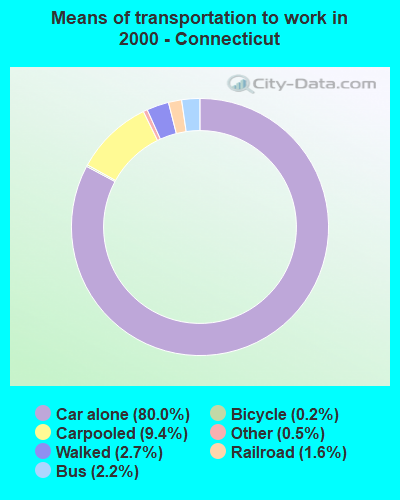
Drove car alone:
| Orange: | 87.9% (5,570) |
| Connecticut: | 80.0% (1,312,700) |
Carpooled:
| Orange: | 6.4% (408) |
| Connecticut: | 9.4% (154,400) |
Bus or trolley bus:
| Orange: | 0.1% (4) |
| Connecticut: | 2.2% (36,097) |
Railroad:
| Orange: | 1.2% (76) |
| Connecticut: | 1.6% (26,659) |
Walked:
| Orange: | 0.3% (19) |
| Connecticut: | 2.7% (44,348) |

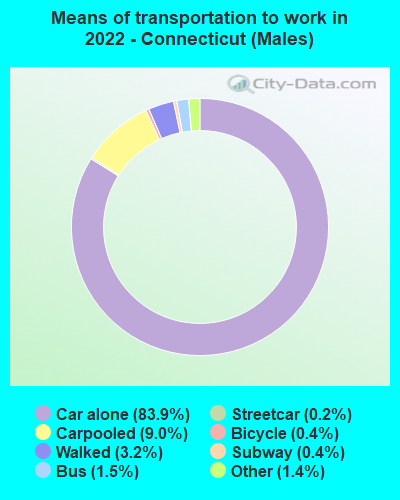
Drove car alone - Males:
| Orange: | 86.6% (4,753) |
| Connecticut: | 83.9% (571,430) |
Carpooled - Males:
| Orange: | 9.8% (537) |
| Connecticut: | 9.0% (66,348) |
Bus - Males:
| Orange: | 1.2% (65) |
| Connecticut: | 1.5% (17,232) |
Subway or elevated rail - Males:
| Orange: | 0.9% (50) |
| Connecticut: | 0.2% (1,929) |
Walked - Males:
| Orange: | 0.5% (26) |
| Connecticut: | 3.2% (23,331) |
Other means - Males:
| Orange: | 1.1% (58) |
| Connecticut: | 1.4% (13,019) |

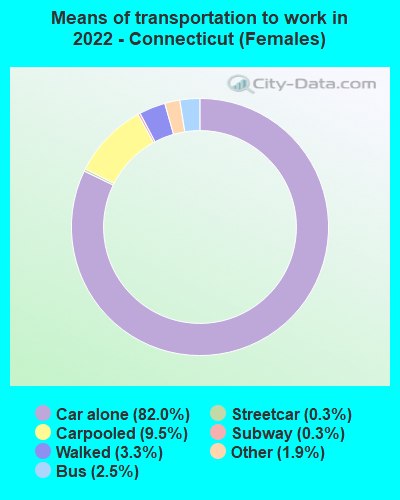
Drove car alone - Females:
| Orange: | 78.0% (4,152) |
| Connecticut: | 82.0% (571,430) |
Carpooled - Females:
| Orange: | 13.9% (740) |
| Connecticut: | 9.5% (66,348) |
Bus - Females:
| Orange: | 1.5% (81) |
| Connecticut: | 2.5% (17,232) |
Long-distance train or commuter rail - Females:
| Orange: | 1.9% (99) |
| Connecticut: | 0.3% (2,105) |
Walked - Females:
| Orange: | 1.4% (73) |
| Connecticut: | 3.3% (23,331) |
Other means - Females:
| Orange: | 3.4% (180) |
| Connecticut: | 1.9% (13,019) |
Private vehicle occupancy

Drove alone:
| Orange: | 90.7% (5,237) |
| Connecticut: | 90.0% (1,260,309) |
In 2 person carpool:
| Orange: | 5.8% (337) |
| Connecticut: | 7.4% (103,259) |
In 3 person carpool:
| Orange: | 2.8% (159) |
| Connecticut: | 1.6% (22,973) |
In 5-6 person carpool:
| Orange: | 0.3% (15) |
| Connecticut: | 0.3% (3,794) |
In 7+ person carpool:
| Orange: | 0.5% (28) |
| Connecticut: | 0.2% (2,498) |

Drove alone:
| Orange: | 93.2% (5,570) |
| Connecticut: | 89.5% (1,312,700) |
In 2 person carpool:
| Orange: | 6.2% (368) |
| Connecticut: | 8.5% (124,051) |
In 3 person carpool:
| Orange: | 0.1% (6) |
| Connecticut: | 1.2% (17,722) |
In 4 person carpool:
| Orange: | 0.1% (6) |
| Connecticut: | 0.4% (5,991) |
In 5-6 person carpool:
| Orange: | 0.3% (15) |
| Connecticut: | 0.2% (3,656) |
In 7+ person carpool:
| Orange: | 0.2% (13) |
| Connecticut: | 0.2% (2,980) |
Class of workers

Employee of private company:
| Orange: | 60.5% (4,361) |
| Connecticut: | 65.9% (1,226,268) |
Self-employed in own incorporated business:
| Orange: | 4.8% (347) |
| Connecticut: | 3.9% (73,132) |
Private not-for-profit wage and salary workers:
| Orange: | 9.9% (716) |
| Connecticut: | 11.4% (212,916) |
Local government workers:
| Orange: | 10.5% (761) |
| Connecticut: | 7.3% (135,635) |
State government workers:
| Orange: | 3.6% (258) |
| Connecticut: | 3.9% (73,243) |
Federal government workers:
| Orange: | 1.8% (127) |
| Connecticut: | 1.5% (28,602) |
Self-employed workers in own not incorporated business:
| Orange: | 8.9% (641) |
| Connecticut: | 5.9% (109,627) |
Unpaid family workers:
| Orange: | 0.0% (2) |
| Connecticut: | 0.1% (2,079) |

Employee of private company:
| Orange: | 58.0% (3,747) |
| Connecticut: | 68.6% (1,141,965) |
Self-employed in own incorporated business:
| Orange: | 6.9% (445) |
| Connecticut: | 3.3% (54,345) |
Private not-for-profit wage and salary workers:
| Orange: | 9.9% (639) |
| Connecticut: | 8.1% (134,058) |
Local government workers:
| Orange: | 11.1% (717) |
| Connecticut: | 7.3% (121,409) |
State government workers:
| Orange: | 4.1% (262) |
| Connecticut: | 4.4% (73,377) |
Federal government workers:
| Orange: | 1.3% (85) |
| Connecticut: | 1.6% (26,626) |
Self-employed workers in own not incorporated business:
| Orange: | 8.5% (550) |
| Connecticut: | 6.5% (108,945) |
Unpaid family workers:
| Orange: | 0.2% (14) |
| Connecticut: | 0.2% (3,715) |

Employee of private company - Males:
| Orange: | 64.9% (2,316) |
| Connecticut: | 70.3% (676,274) |
Self-employed in own incorporated business - Males:
| Orange: | 6.5% (233) |
| Connecticut: | 5.5% (52,445) |
Private not-for-profit wage and salary workers - Males:
| Orange: | 6.5% (231) |
| Connecticut: | 7.5% (72,232) |
Local government workers - Males:
| Orange: | 8.5% (304) |
| Connecticut: | 5.0% (48,435) |
State government workers - Males:
| Orange: | 2.8% (99) |
| Connecticut: | 3.5% (33,921) |
Federal government workers - Males:
| Orange: | 1.8% (65) |
| Connecticut: | 1.6% (15,758) |
Self-employed workers in own not incorporated business - Males:
| Orange: | 9.0% (320) |
| Connecticut: | 6.5% (62,582) |
Unpaid family workers - Males:
| Orange: | 0.1% (2) |
| Connecticut: | 0.1% (589) |

Employee of private company - Females:
| Orange: | 56.1% (2,045) |
| Connecticut: | 61.2% (549,994) |
Self-employed in own incorporated business - Females:
| Orange: | 3.1% (115) |
| Connecticut: | 2.3% (20,687) |
Private not-for-profit wage and salary workers - Females:
| Orange: | 13.3% (486) |
| Connecticut: | 15.6% (140,684) |
Local government workers - Females:
| Orange: | 12.5% (457) |
| Connecticut: | 9.7% (87,200) |
State government workers - Females:
| Orange: | 4.4% (159) |
| Connecticut: | 4.4% (39,322) |
Federal government workers - Females:
| Orange: | 1.7% (62) |
| Connecticut: | 1.4% (12,844) |
Self-employed workers in own not incorporated business - Females:
| Orange: | 8.8% (321) |
| Connecticut: | 5.2% (47,045) |