Work and Jobs in Pacific City, Oregon (OR) Detailed Stats
Occupations, Industries, Unemployment, Workers, Commute
Settings
X


Recent posts about work in Pacific City, Oregon on our local forum with over 2,400,000 registered users:
 | Pacific City, OR--col, housing, quality of life (32 replies) |
| Which beach town should we move to? (23 replies) |
| Gasoline Shortage Oregon Coast (4 replies) |
| Portland earthquake threat (87 replies) |
| A return to the cascades: What're my options? (6 replies) |
| Help with Oregon Trip in Nov-Dec 2017 (10 replies) |
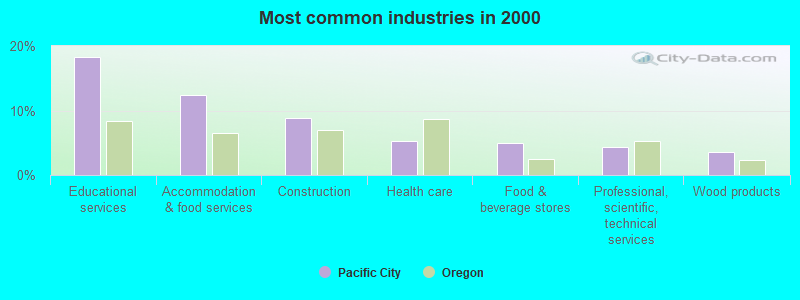
The most common industries in Pacific City are: Educational services (18.4% of civilian employees), Accommodation & food services (12.5% of civilian employees), Construction (8.8% of civilian employees). 88.6% of workers work in Tillamook County and 5.8% of all workers work at home. 54.7% of workers are employees of private companies, which is 18.8% less than the rate of 64.9% across the entire state of Oregon.
Whole page based on the data from 2000 / 2022 when the population of Pacific City, Oregon was 1,027 / 1,771
Whole page based on the data from 2000 / 2022 when the population of Pacific City, Oregon was 1,027 / 1,771
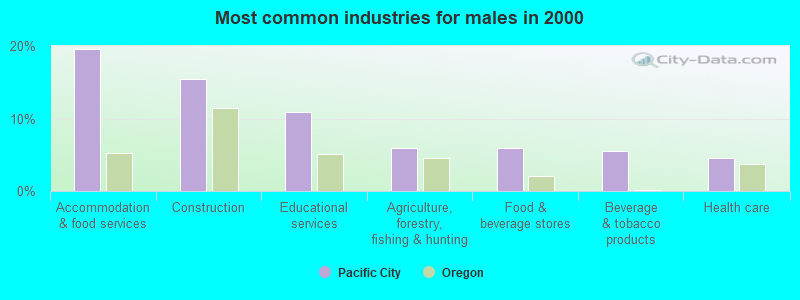
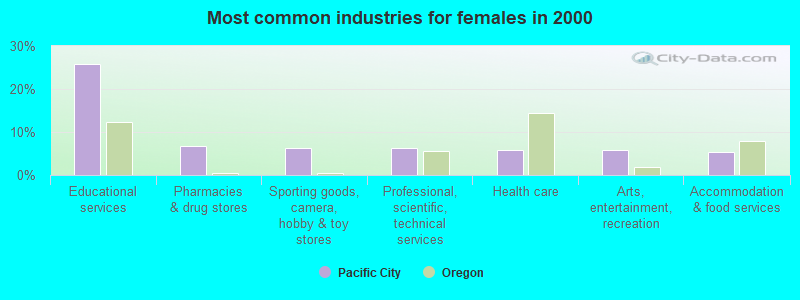
Most common industries
Most common industries | |||
|---|---|---|---|
Industry | All | Males | Females |
| Educational services | 18.4% (81) | 10.9% (24) | 25.8% (57) |
| Accommodation and food services | 12.5% (55) | 19.5% (43) | 5.4% (12) |
| Construction | 8.8% (39) | 15.5% (34) | 2.3% (5) |
| Health care | 5.2% (23) | 4.5% (10) | 5.9% (13) |
| Food and beverage stores | 5.0% (22) | 5.9% (13) | 4.1% (9) |
| Professional, scientific, and technical services | 4.3% (19) | 2.3% (5) | 6.3% (14) |
| Wood products | 3.6% (16) | 4.1% (9) | 3.2% (7) |
| Pharmacies and drug stores | 3.4% (15) | 0.0% (0) | 6.8% (15) |
| Food | 3.2% (14) | 2.3% (5) | 4.1% (9) |
| Sporting goods, camera, and hobby and toy stores | 3.2% (14) | 0.0% (0) | 6.3% (14) |
| Other transportation, and support activities, and couriers | 3.2% (14) | 2.7% (6) | 3.6% (8) |
| Agriculture, forestry, fishing and hunting | 2.9% (13) | 5.9% (13) | 0.0% (0) |
| Real estate and rental and leasing | 2.9% (13) | 2.7% (6) | 3.2% (7) |
| Arts, entertainment, and recreation | 2.9% (13) | 0.0% (0) | 5.9% (13) |
| Beverage and tobacco products | 2.7% (12) | 5.5% (12) | 0.0% (0) |
| Utilities | 2.5% (11) | 0.0% (0) | 5.0% (11) |
| Department and other general merchandise stores | 1.8% (8) | 0.0% (0) | 3.6% (8) |
| Computer and electronic products | 1.8% (8) | 3.6% (8) | 0.0% (0) |
| Public administration | 1.8% (8) | 3.6% (8) | 0.0% (0) |
| Miscellaneous manufacturing | 1.6% (7) | 3.2% (7) | 0.0% (0) |
| Finance and insurance | 1.6% (7) | 0.0% (0) | 3.2% (7) |
| Religious, grantmaking, civic, professional, and similar organizations | 1.6% (7) | 3.2% (7) | 0.0% (0) |
| Metal and metal products | 1.4% (6) | 2.7% (6) | 0.0% (0) |
| Administrative and support and waste management services | 1.1% (5) | 0.0% (0) | 2.3% (5) |
| Alcoholic beverages merchant wholesalers | 0.9% (4) | 1.8% (4) | 0.0% (0) |
| U. S. Postal service | 0.9% (4) | 0.0% (0) | 1.8% (4) |
| Private households | 0.7% (3) | 0.0% (0) | 1.4% (3) |
Unemployment in Pacific City
- Unemployment by race in 2000
- Unemployment rate for White non-Hispanic residents
- 4.1%Males
- 7.8%Females
Time leaving home to go to work

5:00 a.m. to 5:29 a.m.:
| Pacific City: | 14.6% (84) |
| Oregon: | 3.7% (61,686) |
5:30 a.m. to 5:59 a.m.:
| Pacific City: | 6.4% (36) |
| Oregon: | 4.9% (81,016) |
6:30 a.m. to 6:59 a.m.:
| Pacific City: | 12.8% (73) |
| Oregon: | 9.4% (157,114) |
7:30 a.m. to 7:59 a.m.:
| Pacific City: | 10.0% (57) |
| Oregon: | 12.9% (215,364) |
8:00 a.m. to 8:29 a.m.:
| Pacific City: | 10.9% (62) |
| Oregon: | 10.4% (172,765) |
8:30 a.m. to 8:59 a.m.:
| Pacific City: | 8.4% (48) |
| Oregon: | 5.4% (89,869) |
12:00 p.m. to 3:59 p.m.:
| Pacific City: | 31.1% (178) |
| Oregon: | 7.4% (123,119) |
4:00 p.m. to 11:59 p.m.:
| Pacific City: | 4.5% (26) |
| Oregon: | 6.0% (99,745) |

<5am:
| Pacific City: | 6.5% (28) |
| Oregon: | 3.7% (58,821) |
6:30am:
| Pacific City: | 13.5% (58) |
| Oregon: | 7.7% (122,707) |
7am:
| Pacific City: | 3.3% (14) |
| Oregon: | 10.3% (165,185) |
7:30am:
| Pacific City: | 9.3% (40) |
| Oregon: | 13.9% (222,209) |
8am:
| Pacific City: | 12.8% (55) |
| Oregon: | 15.3% (245,415) |
8:30am:
| Pacific City: | 13.1% (56) |
| Oregon: | 9.8% (156,781) |
9am:
| Pacific City: | 1.6% (7) |
| Oregon: | 4.9% (78,436) |
10am:
| Pacific City: | 6.5% (28) |
| Oregon: | 5.5% (88,783) |
11am:
| Pacific City: | 12.1% (52) |
| Oregon: | 2.6% (41,539) |
4pm:
| Pacific City: | 7.9% (34) |
| Oregon: | 6.8% (108,927) |
>4pm:
| Pacific City: | 7.2% (31) |
| Oregon: | 6.0% (95,989) |

5:00 a.m. to 5:29 a.m. - Males:
| Pacific City: | 13.9% (50) |
| Oregon: | 4.8% (42,985) |
5:30 a.m. to 5:59 a.m. - Males:
| Pacific City: | 3.1% (11) |
| Oregon: | 6.1% (54,375) |
6:30 a.m. to 6:59 a.m. - Males:
| Pacific City: | 16.9% (61) |
| Oregon: | 10.4% (93,611) |
7:30 a.m. to 7:59 a.m. - Males:
| Pacific City: | 12.7% (46) |
| Oregon: | 11.1% (99,832) |
8:00 a.m. to 8:29 a.m. - Males:
| Pacific City: | 11.2% (40) |
| Oregon: | 10.0% (89,351) |
8:30 a.m. to 8:59 a.m. - Males:
| Pacific City: | 13.0% (47) |
| Oregon: | 4.3% (38,595) |
12:00 p.m. to 3:59 p.m. - Males:
| Pacific City: | 27.6% (100) |
| Oregon: | 7.0% (62,443) |

5:00 a.m. to 5:29 a.m. - Females:
| Pacific City: | 16.1% (34) |
| Oregon: | 2.4% (18,701) |
5:30 a.m. to 5:59 a.m. - Females:
| Pacific City: | 11.8% (25) |
| Oregon: | 3.5% (26,641) |
6:30 a.m. to 6:59 a.m. - Females:
| Pacific City: | 6.6% (14) |
| Oregon: | 8.3% (63,503) |
7:30 a.m. to 7:59 a.m. - Females:
| Pacific City: | 5.5% (12) |
| Oregon: | 15.0% (115,532) |
8:00 a.m. to 8:29 a.m. - Females:
| Pacific City: | 10.8% (23) |
| Oregon: | 10.9% (83,414) |
12:00 p.m. to 3:59 p.m. - Females:
| Pacific City: | 36.7% (78) |
| Oregon: | 7.9% (60,676) |
4:00 p.m. to 11:59 p.m. - Females:
| Pacific City: | 12.6% (27) |
| Oregon: | 6.0% (45,744) |
Travel time to work
Percentage of workers working in this county: 88.6%
Number of people working at home: 36 (5.8% of all workers)
Number of people working at home: 36 (5.8% of all workers)


Less than 5 minutes:
| Pacific City: | 10.0% (43) |
| Oregon: | 4.1% (66,369) |
5 to 9 minutes:
| Pacific City: | 16.1% (69) |
| Oregon: | 12.9% (206,168) |
10 to 14 minutes:
| Pacific City: | 16.8% (72) |
| Oregon: | 16.5% (263,466) |
15 to 19 minutes:
| Pacific City: | 7.9% (34) |
| Oregon: | 16.1% (258,476) |
20 to 24 minutes:
| Pacific City: | 14.2% (61) |
| Oregon: | 13.9% (223,370) |
25 to 29 minutes:
| Pacific City: | 1.6% (7) |
| Oregon: | 5.4% (87,147) |
30 to 34 minutes:
| Pacific City: | 11.4% (49) |
| Oregon: | 11.0% (176,763) |
35 to 39 minutes:
| Pacific City: | 0.7% (3) |
| Oregon: | 2.0% (32,680) |
40 to 44 minutes:
| Pacific City: | 4.7% (20) |
| Oregon: | 2.7% (43,262) |
45 to 59 minutes:
| Pacific City: | 1.9% (8) |
| Oregon: | 5.2% (83,858) |
90 or more minutes:
| Pacific City: | 8.6% (37) |
| Oregon: | 1.8% (28,715) |
Means of transportation to work


Drove car alone:
| Pacific City: | 72.7% (312) |
| Oregon: | 73.2% (1,171,641) |
Carpooled:
| Pacific City: | 13.3% (57) |
| Oregon: | 12.2% (195,950) |
Walked:
| Pacific City: | 7.9% (34) |
| Oregon: | 3.6% (57,217) |
Private vehicle occupancy

Drove alone:
| Pacific City: | 89.8% (417) |
| Oregon: | 88.2% (1,317,823) |
In 2 person carpool:
| Pacific City: | 9.9% (46) |
| Oregon: | 9.0% (134,621) |

Drove alone:
| Pacific City: | 84.6% (312) |
| Oregon: | 85.7% (1,171,641) |
In 2 person carpool:
| Pacific City: | 15.4% (57) |
| Oregon: | 11.5% (156,754) |
Class of workers

Employee of private company:
| Pacific City: | 54.7% (348) |
| Oregon: | 64.9% (1,360,643) |
Private not-for-profit wage and salary workers:
| Pacific City: | 5.5% (35) |
| Oregon: | 9.6% (201,342) |
Local government workers:
| Pacific City: | 11.6% (74) |
| Oregon: | 7.2% (151,100) |
State government workers:
| Pacific City: | 20.7% (132) |
| Oregon: | 5.0% (103,943) |
Self-employed workers in own not incorporated business:
| Pacific City: | 7.6% (48) |
| Oregon: | 6.9% (145,422) |

Employee of private company:
| Pacific City: | 58.5% (258) |
| Oregon: | 65.1% (1,059,139) |
Self-employed in own incorporated business:
| Pacific City: | 8.6% (38) |
| Oregon: | 3.8% (61,386) |
Private not-for-profit wage and salary workers:
| Pacific City: | 4.8% (21) |
| Oregon: | 7.4% (120,839) |
Local government workers:
| Pacific City: | 19.7% (87) |
| Oregon: | 7.2% (116,733) |
State government workers:
| Pacific City: | 1.8% (8) |
| Oregon: | 5.0% (81,804) |
Federal government workers:
| Pacific City: | 0.9% (4) |
| Oregon: | 2.2% (36,076) |
Self-employed workers in own not incorporated business:
| Pacific City: | 5.7% (25) |
| Oregon: | 8.9% (145,020) |

Employee of private company - Males:
| Pacific City: | 37.3% (141) |
| Oregon: | 70.1% (771,769) |
Local government workers - Males:
| Pacific City: | 15.1% (57) |
| Oregon: | 5.5% (60,350) |
State government workers - Males:
| Pacific City: | 34.9% (132) |
| Oregon: | 3.9% (42,724) |
Self-employed workers in own not incorporated business - Males:
| Pacific City: | 12.7% (48) |
| Oregon: | 6.9% (76,355) |

Employee of private company - Females:
| Pacific City: | 80.2% (207) |
| Oregon: | 59.2% (588,874) |
Private not-for-profit wage and salary workers - Females:
| Pacific City: | 13.5% (35) |
| Oregon: | 13.4% (133,183) |
Local government workers - Females:
| Pacific City: | 6.3% (16) |
| Oregon: | 9.1% (90,750) |