Work and Jobs in Pacific, Wisconsin (WI) Detailed Stats
Occupations, Industries, Unemployment, Workers, Commute
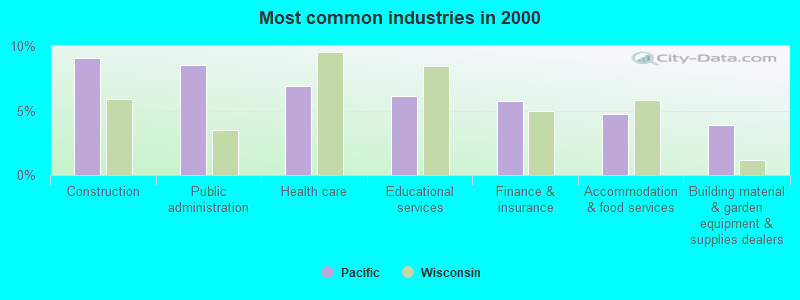
The most common industries in Pacific are: Construction (9.0% of civilian employees), Public administration (8.5% of civilian employees), Health care (6.9% of civilian employees). 70.2% of workers are employees of private companies, which is about the same as the rate of 70.2% across the entire state of Wisconsin.
Most common industries
Most common industries | |||
|---|---|---|---|
Industry | All | Males | Females |
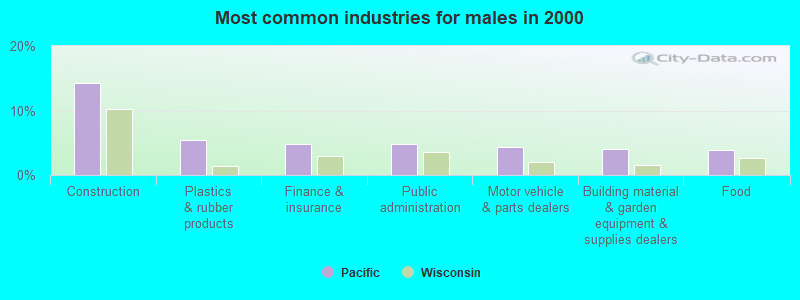
| Construction | 9.0% (115) | 14.3% (90) | 3.9% (25) |
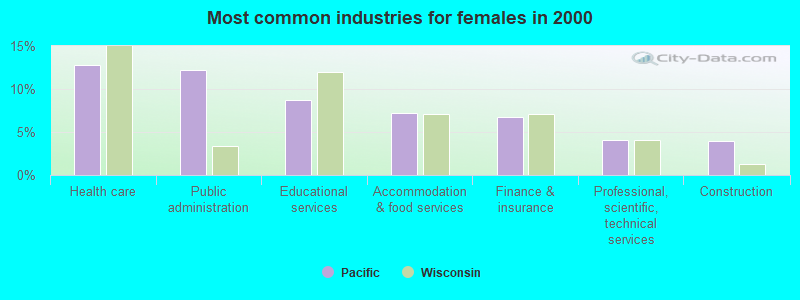
| Public administration | 8.5% (108) | 4.8% (30) | 12.2% (78) |
| Health care | 6.9% (88) | 1.0% (6) | 12.8% (82) |
| Educational services | 6.1% (78) | 3.5% (22) | 8.7% (56) |
| Finance and insurance | 5.7% (73) | 4.8% (30) | 6.7% (43) |
| Accommodation and food services | 4.7% (60) | 2.2% (14) | 7.2% (46) |
| Building material and garden equipment and supplies dealers | 3.9% (49) | 4.0% (25) | 3.7% (24) |
| Plastics and rubber products | 3.6% (46) | 5.4% (34) | 1.9% (12) |
| Food | 3.5% (44) | 3.8% (24) | 3.1% (20) |
| Electrical equipment, appliances, and components | 3.1% (40) | 3.3% (21) | 3.0% (19) |
| Professional, scientific, and technical services | 2.9% (37) | 1.7% (11) | 4.1% (26) |
| Food and beverage stores | 2.8% (36) | 3.7% (23) | 2.0% (13) |
| Motor vehicle and parts dealers | 2.8% (35) | 4.3% (27) | 1.2% (8) |
| Miscellaneous manufacturing | 2.4% (31) | 3.0% (19) | 1.9% (12) |
| Metal and metal products | 2.4% (30) | 3.5% (22) | 1.2% (8) |
| Real estate and rental and leasing | 1.8% (23) | 2.7% (17) | 0.9% (6) |
| Truck transportation | 1.8% (23) | 3.7% (23) | 0.0% (0) |
| Repair and maintenance | 1.8% (23) | 3.7% (23) | 0.0% (0) |
| Social assistance | 1.7% (22) | 0.3% (2) | 3.1% (20) |
| Machinery | 1.7% (21) | 3.3% (21) | 0.0% (0) |
| Gasoline stations | 1.5% (19) | 0.0% (0) | 3.0% (19) |
| Administrative and support and waste management services | 1.4% (18) | 1.9% (12) | 0.9% (6) |
| Pharmacies and drug stores | 1.3% (17) | 2.2% (14) | 0.5% (3) |
| Chemicals | 1.2% (15) | 0.5% (3) | 1.9% (12) |
| Utilities | 1.0% (13) | 2.1% (13) | 0.0% (0) |
| Transportation equipment | 0.9% (12) | 0.8% (5) | 1.1% (7) |
| Personal and laundry services | 0.9% (12) | 0.8% (5) | 1.1% (7) |
| Furniture and home furnishings, and household appliance stores | 0.9% (11) | 0.5% (3) | 1.2% (8) |
| Arts, entertainment, and recreation | 0.9% (11) | 0.0% (0) | 1.7% (11) |
| Agriculture, forestry, fishing and hunting | 0.8% (10) | 1.6% (10) | 0.0% (0) |
| Groceries and related products merchant wholesalers | 0.8% (10) | 0.8% (5) | 0.8% (5) |
| Furniture and related product manufacturing | 0.7% (9) | 0.2% (1) | 1.2% (8) |
| Department and other general merchandise stores | 0.7% (9) | 0.0% (0) | 1.4% (9) |
| Nonmetallic mineral products | 0.6% (8) | 1.3% (8) | 0.0% (0) |
| Motor vehicles, parts and supplies merchant wholesalers | 0.6% (8) | 1.3% (8) | 0.0% (0) |
| Recyclable material merchant wholesalers | 0.6% (8) | 1.3% (8) | 0.0% (0) |
| Machinery, equipment, and supplies merchant wholesalers | 0.6% (8) | 1.3% (8) | 0.0% (0) |
| Printing and related support activities | 0.6% (7) | 0.3% (2) | 0.8% (5) |
| Drugs, sundries, and chemical and allied products merchant wholesalers | 0.6% (7) | 0.0% (0) | 1.1% (7) |
| Broadcasting and telecommunications | 0.6% (7) | 0.3% (2) | 0.8% (5) |
| Religious, grantmaking, civic, professional, and similar organizations | 0.6% (7) | 0.0% (0) | 1.1% (7) |
| Rail transportation | 0.5% (6) | 1.0% (6) | 0.0% (0) |
| U. S. Postal service | 0.5% (6) | 1.0% (6) | 0.0% (0) |
| Beverage and tobacco products | 0.4% (5) | 0.8% (5) | 0.0% (0) |
| Radio, TV, and computer stores | 0.4% (5) | 0.8% (5) | 0.0% (0) |
| Private households | 0.4% (5) | 0.0% (0) | 0.8% (5) |
| Petroleum and petroleum products merchant wholesalers | 0.3% (4) | 0.3% (2) | 0.3% (2) |
| Lumber and other construction materials merchant wholesalers | 0.3% (4) | 0.6% (4) | 0.0% (0) |
| Music stores | 0.2% (3) | 0.0% (0) | 0.5% (3) |
| Other transportation, and support activities, and couriers | 0.2% (3) | 0.5% (3) | 0.0% (0) |
| Used merchandise, gift, novelty, and souvenir, and other miscellaneous stores | 0.2% (3) | 0.0% (0) | 0.5% (3) |
| Computer and electronic products | 0.2% (3) | 0.0% (0) | 0.5% (3) |
| Air transportation | 0.2% (3) | 0.0% (0) | 0.5% (3) |
| Data processing, libraries, and other information services | 0.2% (3) | 0.0% (0) | 0.5% (3) |
| Electrical and electronic goods merchant wholesalers | 0.2% (3) | 0.5% (3) | 0.0% (0) |
| Sewing, needlework, and piece goods stores | 0.2% (2) | 0.0% (0) | 0.3% (2) |
| Office supplies and stationery stores | 0.2% (2) | 0.3% (2) | 0.0% (0) |
| Furniture and home furnishing merchant wholesalers | 0.2% (2) | 0.3% (2) | 0.0% (0) |
| Petroleum and coal products | 0.1% (1) | 0.2% (1) | 0.0% (0) |
Unemployment in Pacific
- Unemployment by race in 2000
- Unemployment rate for White non-Hispanic residents
- 6.2%Males
- 3.3%Females
Time leaving home to go to work

<5am:
| Pacific: | 4.7% (59) |
| Wisconsin: | 4.1% (109,243) |
5:30am:
| Pacific: | 5.6% (70) |
| Wisconsin: | 3.6% (96,106) |
6am:
| Pacific: | 3.8% (48) |
| Wisconsin: | 5.7% (152,711) |
6:30am:
| Pacific: | 8.7% (109) |
| Wisconsin: | 8.6% (230,911) |
7am:
| Pacific: | 10.3% (129) |
| Wisconsin: | 11.2% (301,313) |
7:30am:
| Pacific: | 14.9% (187) |
| Wisconsin: | 13.7% (369,283) |
8am:
| Pacific: | 19.9% (250) |
| Wisconsin: | 15.1% (406,072) |
8:30am:
| Pacific: | 4.2% (53) |
| Wisconsin: | 7.7% (207,205) |
9am:
| Pacific: | 3.6% (45) |
| Wisconsin: | 3.6% (96,083) |
10am:
| Pacific: | 2.5% (31) |
| Wisconsin: | 3.7% (99,733) |
11am:
| Pacific: | 1.7% (21) |
| Wisconsin: | 1.7% (46,480) |
12pm:
| Pacific: | 0.5% (6) |
| Wisconsin: | 1.0% (27,021) |
4pm:
| Pacific: | 9.0% (113) |
| Wisconsin: | 8.7% (233,209) |
>4pm:
| Pacific: | 8.8% (111) |
| Wisconsin: | 7.8% (209,939) |
Travel time to work


Less than 5 minutes:
| Pacific: | 2.1% (27) |
| Wisconsin: | 5.0% (135,194) |
5 to 9 minutes:
| Pacific: | 8.8% (111) |
| Wisconsin: | 14.8% (398,697) |
10 to 14 minutes:
| Pacific: | 22.0% (277) |
| Wisconsin: | 17.7% (476,569) |
15 to 19 minutes:
| Pacific: | 16.5% (208) |
| Wisconsin: | 16.4% (440,637) |
20 to 24 minutes:
| Pacific: | 8.1% (102) |
| Wisconsin: | 13.8% (372,180) |
25 to 29 minutes:
| Pacific: | 3.9% (49) |
| Wisconsin: | 5.9% (159,448) |
30 to 34 minutes:
| Pacific: | 6.1% (77) |
| Wisconsin: | 9.2% (248,714) |
35 to 39 minutes:
| Pacific: | 4.8% (60) |
| Wisconsin: | 2.2% (59,121) |
40 to 44 minutes:
| Pacific: | 6.0% (75) |
| Wisconsin: | 2.3% (61,540) |
45 to 59 minutes:
| Pacific: | 13.0% (164) |
| Wisconsin: | 4.5% (120,028) |
60 to 89 minutes:
| Pacific: | 4.9% (62) |
| Wisconsin: | 2.5% (68,071) |
90 or more minutes:
| Pacific: | 1.6% (20) |
| Wisconsin: | 1.7% (45,110) |
Means of transportation to work

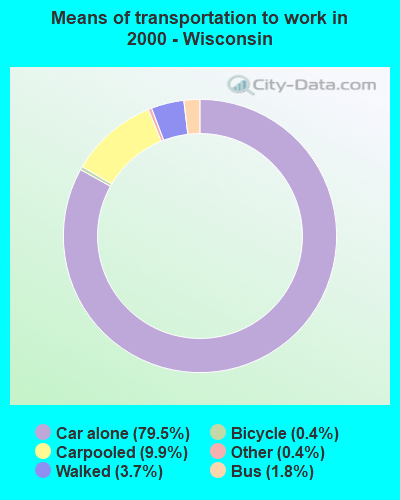
Drove car alone:
| Pacific: | 85.4% (1,074) |
| Wisconsin: | 79.5% (2,138,832) |
Carpooled:
| Pacific: | 10.4% (131) |
| Wisconsin: | 9.9% (267,471) |
Bus or trolley bus:
| Pacific: | 0.2% (2) |
| Wisconsin: | 1.8% (49,121) |
Bicycle:
| Pacific: | 0.4% (5) |
| Wisconsin: | 0.4% (11,635) |
Walked:
| Pacific: | 1.2% (15) |
| Wisconsin: | 3.7% (100,301) |
Other means:
| Pacific: | 0.4% (5) |
| Wisconsin: | 0.4% (11,907) |
Private vehicle occupancy

Drove alone:
| Pacific: | 89.1% (1,074) |
| Wisconsin: | 88.9% (2,138,832) |
In 2 person carpool:
| Pacific: | 9.8% (118) |
| Wisconsin: | 9.1% (217,793) |
In 3 person carpool:
| Pacific: | 0.7% (8) |
| Wisconsin: | 1.3% (32,067) |
In 7+ person carpool:
| Pacific: | 0.4% (5) |
| Wisconsin: | 0.1% (3,286) |
Class of workers

Employee of private company:
| Pacific: | 70.2% (892) |
| Wisconsin: | 70.2% (1,919,753) |
Self-employed in own incorporated business:
| Pacific: | 3.9% (49) |
| Wisconsin: | 2.8% (77,876) |
Private not-for-profit wage and salary workers:
| Pacific: | 5.3% (67) |
| Wisconsin: | 8.0% (219,861) |
Local government workers:
| Pacific: | 7.9% (101) |
| Wisconsin: | 6.9% (189,838) |
State government workers:
| Pacific: | 4.7% (60) |
| Wisconsin: | 4.1% (111,964) |
Federal government workers:
| Pacific: | 0.9% (12) |
| Wisconsin: | 1.4% (38,990) |
Self-employed workers in own not incorporated business:
| Pacific: | 7.1% (90) |
| Wisconsin: | 6.1% (167,248) |

Employee of private company - Males:
| Pacific: | 74.6% (470) |
| Wisconsin: | 73.5% (1,049,603) |
Self-employed in own incorporated business - Males:
| Pacific: | 6.5% (41) |
| Wisconsin: | 4.0% (57,168) |
Private not-for-profit wage and salary workers - Males:
| Pacific: | 2.1% (13) |
| Wisconsin: | 4.2% (60,190) |
Local government workers - Males:
| Pacific: | 2.5% (16) |
| Wisconsin: | 5.6% (79,290) |
State government workers - Males:
| Pacific: | 2.9% (18) |
| Wisconsin: | 3.5% (49,348) |
Federal government workers - Males:
| Pacific: | 1.9% (12) |
| Wisconsin: | 1.4% (20,325) |
Self-employed workers in own not incorporated business - Males:
| Pacific: | 9.5% (60) |
| Wisconsin: | 7.5% (107,640) |

Employee of private company - Females:
| Pacific: | 65.8% (422) |
| Wisconsin: | 66.6% (870,150) |
Self-employed in own incorporated business - Females:
| Pacific: | 1.2% (8) |
| Wisconsin: | 1.6% (20,708) |
Private not-for-profit wage and salary workers - Females:
| Pacific: | 8.4% (54) |
| Wisconsin: | 12.2% (159,671) |
Local government workers - Females:
| Pacific: | 13.3% (85) |
| Wisconsin: | 8.5% (110,548) |
State government workers - Females:
| Pacific: | 6.6% (42) |
| Wisconsin: | 4.8% (62,616) |
Self-employed workers in own not incorporated business - Females:
| Pacific: | 4.7% (30) |
| Wisconsin: | 4.6% (59,608) |