Work and Jobs in Palenville, New York (NY) Detailed Stats
Occupations, Industries, Unemployment, Workers, Commute
Settings
X


Recent posts about work in Palenville, New York on our local forum with over 2,400,000 registered users:
 | Community/independently owned radio stations... (15 replies) |
| Where is it that Long Islanders go when they move off? (119 replies) |
| Fall foliage in the Catskills (10 replies) |
| Palenville Info and Tips? (5 replies) |
| 5 pros and 5 cons about Kingston, NY. Thinking about moving to the area Thanks! (54 replies) |
| Wappinger Falls New York from South Florida (9 replies) |
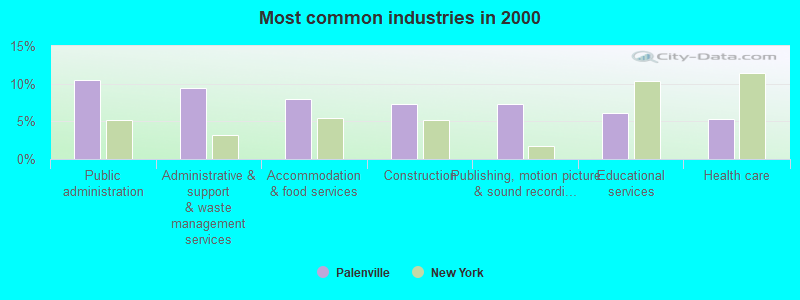
The most common industries in Palenville are: Public administration (10.5% of civilian employees), Administrative & support & waste management services (9.5% of civilian employees), Accommodation & food services (8.0% of civilian employees). 48.7% of workers work in Greene County and 9.3% of all workers work at home. 74.6% of workers are employees of private companies, which is 16.7% greater than the rate of 62.2% across the entire state of New York.
Whole page based on the data from 2000 / 2022 when the population of Palenville, New York was 1,120 / 910
Whole page based on the data from 2000 / 2022 when the population of Palenville, New York was 1,120 / 910
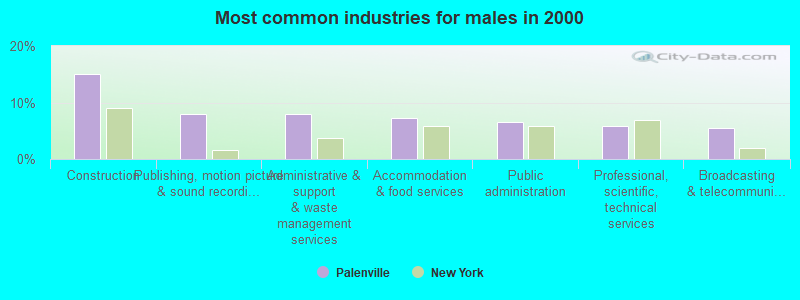
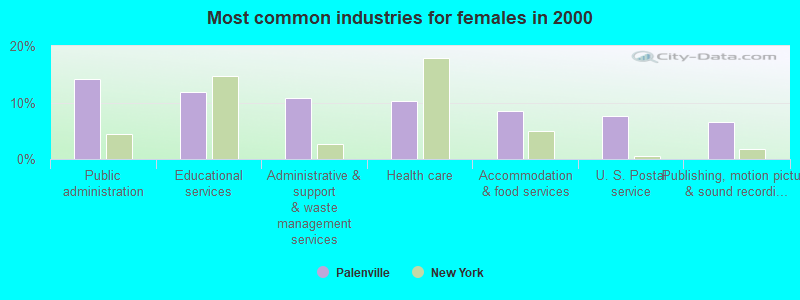
Most common industries
Most common industries | |||
|---|---|---|---|
Industry | All | Males | Females |
| Public administration | 10.5% (62) | 6.6% (19) | 14.1% (43) |
| Administrative and support and waste management services | 9.5% (56) | 8.0% (23) | 10.9% (33) |
| Accommodation and food services | 8.0% (47) | 7.3% (21) | 8.6% (26) |
| Construction | 7.3% (43) | 15.0% (43) | 0.0% (0) |
| Publishing, and motion picture and sound recording industries | 7.3% (43) | 8.0% (23) | 6.6% (20) |
| Educational services | 6.1% (36) | 0.0% (0) | 11.8% (36) |
| Health care | 5.2% (31) | 0.0% (0) | 10.2% (31) |
| Religious, grantmaking, civic, professional, and similar organizations | 4.7% (28) | 4.9% (14) | 4.6% (14) |
| Truck transportation | 3.9% (23) | 5.2% (15) | 2.6% (8) |
| U. S. Postal service | 3.9% (23) | 0.0% (0) | 7.6% (23) |
| Chemicals | 3.4% (20) | 4.2% (12) | 2.6% (8) |
| Professional, scientific, and technical services | 2.9% (17) | 5.9% (17) | 0.0% (0) |
| Broadcasting and telecommunications | 2.7% (16) | 5.6% (16) | 0.0% (0) |
| Real estate and rental and leasing | 2.5% (15) | 3.1% (9) | 2.0% (6) |
| Personal and laundry services | 2.2% (13) | 4.5% (13) | 0.0% (0) |
| Textile mills and textile products | 2.0% (12) | 1.7% (5) | 2.3% (7) |
| Miscellaneous manufacturing | 1.9% (11) | 3.8% (11) | 0.0% (0) |
| Pharmacies and drug stores | 1.9% (11) | 0.0% (0) | 3.6% (11) |
| Agriculture, forestry, fishing and hunting | 1.7% (10) | 3.5% (10) | 0.0% (0) |
| Machinery, equipment, and supplies merchant wholesalers | 1.5% (9) | 0.0% (0) | 3.0% (9) |
| Gasoline stations | 1.5% (9) | 0.0% (0) | 3.0% (9) |
| Data processing, libraries, and other information services | 1.5% (9) | 3.1% (9) | 0.0% (0) |
| Radio, TV, and computer stores | 1.4% (8) | 0.0% (0) | 2.6% (8) |
| Other transportation, and support activities, and couriers | 1.4% (8) | 2.8% (8) | 0.0% (0) |
| Arts, entertainment, and recreation | 1.4% (8) | 0.0% (0) | 2.6% (8) |
| Mining, quarrying, and oil and gas extraction | 1.2% (7) | 2.4% (7) | 0.0% (0) |
| Electrical equipment, appliances, and components | 1.2% (7) | 2.4% (7) | 0.0% (0) |
| Machinery | 0.8% (5) | 1.7% (5) | 0.0% (0) |
| Printing and related support activities | 0.7% (4) | 0.0% (0) | 1.3% (4) |
Unemployment in Palenville
- Unemployment by race in 2000
- Unemployment rate for White non-Hispanic residents
- 12.0%Males
- 12.6%Females
Time leaving home to go to work

12:00 a.m. to 4:59 a.m.:
| Palenville: | 13.1% (41) |
| New York: | 4.0% (324,269) |
6:00 a.m. to 6:29 a.m.:
| Palenville: | 17.6% (54) |
| New York: | 7.8% (625,523) |
6:30 a.m. to 6:59 a.m.:
| Palenville: | 16.8% (52) |
| New York: | 8.0% (641,168) |
7:00 a.m. to 7:29 a.m.:
| Palenville: | 26.5% (82) |
| New York: | 13.8% (1,113,086) |
8:00 a.m. to 8:29 a.m.:
| Palenville: | 5.5% (17) |
| New York: | 13.8% (1,113,103) |
8:30 a.m. to 8:59 a.m.:
| Palenville: | 7.0% (22) |
| New York: | 7.6% (611,626) |
11:00 a.m. to 11:59 a.m.:
| Palenville: | 2.6% (8) |
| New York: | 1.8% (142,295) |
12:00 p.m. to 3:59 p.m.:
| Palenville: | 8.0% (25) |
| New York: | 6.7% (538,932) |
4:00 p.m. to 11:59 p.m.:
| Palenville: | 3.0% (9) |
| New York: | 5.4% (432,010) |

<5am:
| Palenville: | 2.1% (12) |
| New York: | 2.4% (194,562) |
6am:
| Palenville: | 1.2% (7) |
| New York: | 3.1% (253,826) |
6:30am:
| Palenville: | 11.9% (69) |
| New York: | 7.0% (573,349) |
7am:
| Palenville: | 13.8% (80) |
| New York: | 8.6% (706,982) |
7:30am:
| Palenville: | 6.6% (38) |
| New York: | 14.0% (1,147,579) |
8am:
| Palenville: | 7.8% (45) |
| New York: | 14.8% (1,213,706) |
8:30am:
| Palenville: | 19.0% (110) |
| New York: | 13.9% (1,144,298) |
9am:
| Palenville: | 4.5% (26) |
| New York: | 7.5% (614,475) |
10am:
| Palenville: | 5.7% (33) |
| New York: | 7.2% (593,377) |
11am:
| Palenville: | 1.4% (8) |
| New York: | 2.7% (224,011) |
12pm:
| Palenville: | 1.0% (6) |
| New York: | 1.3% (105,049) |
4pm:
| Palenville: | 5.7% (33) |
| New York: | 6.3% (517,309) |
>4pm:
| Palenville: | 6.9% (40) |
| New York: | 6.1% (501,196) |

12:00 a.m. to 4:59 a.m. - Males:
| Palenville: | 7.3% (11) |
| New York: | 5.3% (221,747) |
6:00 a.m. to 6:29 a.m. - Males:
| Palenville: | 9.2% (13) |
| New York: | 9.2% (385,998) |
6:30 a.m. to 6:59 a.m. - Males:
| Palenville: | 3.8% (6) |
| New York: | 8.0% (337,755) |
7:00 a.m. to 7:29 a.m. - Males:
| Palenville: | 51.3% (74) |
| New York: | 13.5% (566,438) |
8:30 a.m. to 8:59 a.m. - Males:
| Palenville: | 10.2% (15) |
| New York: | 6.3% (263,407) |
12:00 p.m. to 3:59 p.m. - Males:
| Palenville: | 16.8% (24) |
| New York: | 7.0% (294,293) |

12:00 a.m. to 4:59 a.m. - Females:
| Palenville: | 18.6% (31) |
| New York: | 2.7% (102,522) |
6:00 a.m. to 6:29 a.m. - Females:
| Palenville: | 25.6% (42) |
| New York: | 6.3% (239,525) |
6:30 a.m. to 6:59 a.m. - Females:
| Palenville: | 29.0% (48) |
| New York: | 7.9% (303,413) |
7:00 a.m. to 7:29 a.m. - Females:
| Palenville: | 4.6% (8) |
| New York: | 14.3% (546,648) |
8:00 a.m. to 8:29 a.m. - Females:
| Palenville: | 10.3% (17) |
| New York: | 15.6% (597,438) |
8:30 a.m. to 8:59 a.m. - Females:
| Palenville: | 4.2% (7) |
| New York: | 9.1% (348,219) |
11:00 a.m. to 11:59 a.m. - Females:
| Palenville: | 4.9% (8) |
| New York: | 1.8% (67,360) |
4:00 p.m. to 11:59 p.m. - Females:
| Palenville: | 5.7% (9) |
| New York: | 5.0% (191,844) |
Travel time to work
Percentage of workers working in this county: 48.7%
Number of people working at home: 33 (9.3% of all workers)
Number of people working at home: 33 (9.3% of all workers)


Less than 5 minutes:
| Palenville: | 5.2% (30) |
| New York: | 2.7% (219,036) |
5 to 9 minutes:
| Palenville: | 6.4% (37) |
| New York: | 8.3% (680,270) |
10 to 14 minutes:
| Palenville: | 6.7% (39) |
| New York: | 11.6% (956,590) |
15 to 19 minutes:
| Palenville: | 15.9% (92) |
| New York: | 12.4% (1,020,084) |
20 to 24 minutes:
| Palenville: | 6.4% (37) |
| New York: | 12.3% (1,013,757) |
25 to 29 minutes:
| Palenville: | 3.4% (20) |
| New York: | 4.9% (399,384) |
30 to 34 minutes:
| Palenville: | 14.5% (84) |
| New York: | 12.9% (1,058,688) |
35 to 39 minutes:
| Palenville: | 3.8% (22) |
| New York: | 2.5% (203,722) |
40 to 44 minutes:
| Palenville: | 4.5% (26) |
| New York: | 4.1% (340,311) |
45 to 59 minutes:
| Palenville: | 4.1% (24) |
| New York: | 9.8% (806,556) |
60 to 89 minutes:
| Palenville: | 5.7% (33) |
| New York: | 10.3% (848,185) |
90 or more minutes:
| Palenville: | 10.9% (63) |
| New York: | 5.1% (417,464) |
Means of transportation to work


Drove car alone:
| Palenville: | 76.9% (446) |
| New York: | 56.3% (4,620,178) |
Carpooled:
| Palenville: | 5.9% (34) |
| New York: | 9.2% (756,918) |
Walked:
| Palenville: | 1.0% (6) |
| New York: | 6.2% (511,721) |
Other means:
| Palenville: | 3.6% (21) |
| New York: | 0.5% (40,375) |
Private vehicle occupancy

Drove alone:
| Palenville: | 93.6% (269) |
| New York: | 88.3% (4,609,282) |
In 2 person carpool:
| Palenville: | 3.5% (10) |
| New York: | 8.7% (455,269) |
In 3 person carpool:
| Palenville: | 2.6% (8) |
| New York: | 1.6% (86,175) |

Drove alone:
| Palenville: | 92.9% (446) |
| New York: | 85.9% (4,620,178) |
In 2 person carpool:
| Palenville: | 4.6% (22) |
| New York: | 11.0% (590,255) |
In 3 person carpool:
| Palenville: | 2.5% (12) |
| New York: | 1.8% (96,470) |
Class of workers

Employee of private company:
| Palenville: | 74.6% (297) |
| New York: | 62.2% (5,966,667) |
Private not-for-profit wage and salary workers:
| Palenville: | 2.3% (9) |
| New York: | 11.6% (1,113,247) |
Local government workers:
| Palenville: | 14.1% (56) |
| New York: | 9.9% (953,569) |
State government workers:
| Palenville: | 6.5% (26) |
| New York: | 4.2% (401,705) |
Self-employed workers in own not incorporated business:
| Palenville: | 2.5% (10) |
| New York: | 5.9% (562,168) |

Employee of private company:
| Palenville: | 48.7% (288) |
| New York: | 63.7% (5,340,134) |
Self-employed in own incorporated business:
| Palenville: | 6.9% (41) |
| New York: | 3.4% (283,619) |
Private not-for-profit wage and salary workers:
| Palenville: | 8.3% (49) |
| New York: | 9.7% (810,356) |
Local government workers:
| Palenville: | 14.0% (83) |
| New York: | 10.2% (858,120) |
State government workers:
| Palenville: | 5.6% (33) |
| New York: | 4.6% (383,673) |
Federal government workers:
| Palenville: | 3.9% (23) |
| New York: | 2.2% (185,100) |
Self-employed workers in own not incorporated business:
| Palenville: | 10.8% (64) |
| New York: | 6.0% (501,068) |
Unpaid family workers:
| Palenville: | 1.7% (10) |
| New York: | 0.2% (20,918) |

Employee of private company - Males:
| Palenville: | 63.6% (105) |
| New York: | 65.7% (3,237,092) |
Private not-for-profit wage and salary workers - Males:
| Palenville: | 5.5% (9) |
| New York: | 8.3% (407,704) |
Local government workers - Males:
| Palenville: | 9.1% (15) |
| New York: | 7.9% (389,927) |
State government workers - Males:
| Palenville: | 15.8% (26) |
| New York: | 4.1% (199,717) |
Self-employed workers in own not incorporated business - Males:
| Palenville: | 6.1% (10) |
| New York: | 6.6% (324,901) |

Employee of private company - Females:
| Palenville: | 82.4% (192) |
| New York: | 58.4% (2,729,575) |
Local government workers - Females:
| Palenville: | 17.6% (41) |
| New York: | 12.1% (563,642) |