Work and Jobs in Paris, Texas (TX) Detailed Stats
Occupations, Industries, Unemployment, Workers, Commute
Settings
X


Recent posts about work in Paris, Texas on our local forum with over 2,400,000 registered users:
 | The DFW housing market is NOT sustainable (685 replies) |
| Houston's economic diversity Thread .. (1255 replies) |
| Areas in Houston that are similar to Southern Orange County, California (108 replies) |
| Softening in RE market?? (2334 replies) |
| relocating from Ireland to Dallas (49 replies) |
| Houston communities most vulnerable to gentrification (267 replies) |
Latest news about work in Paris, TX collected exclusively by city-data.com from local newspapers, TV, and radio stations
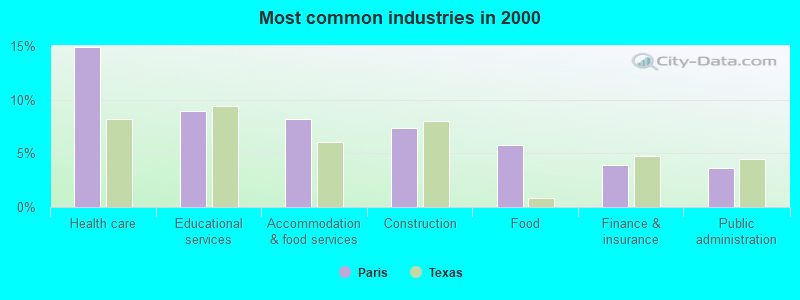
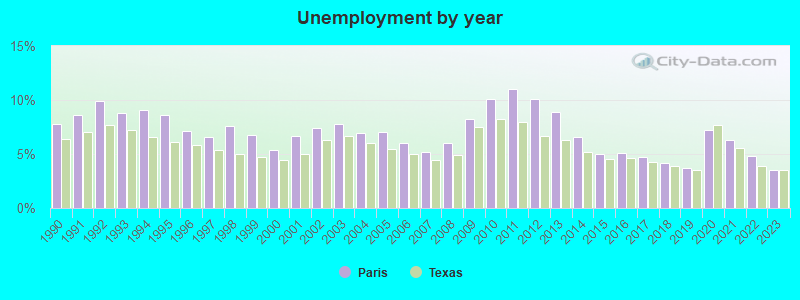
The unemployment rate in 2023 in Paris, TX was 3.5%, which was about the same as the unemployment rate of 3.5% across the entire state of Texas. Compared to the unemployment rate of 8.9% in 2013, this represents a decrease of 154.3%. The most common industries in Paris are: Health care (14.9% of civilian employees), Educational services (9.0% of civilian employees), Accommodation & food services (8.2% of civilian employees). 91.8% of workers work in Lamar County and 5.5% of all workers work at home. 74.5% of workers are employees of private companies, which is 6.7% greater than the rate of 69.6% across the entire state of Texas.
Whole page based on the data from 2000 / 2022 when the population of Paris, Texas was 25,898 / 25,235
Whole page based on the data from 2000 / 2022 when the population of Paris, Texas was 25,898 / 25,235
Most common industries

Most common industries | |||
|---|---|---|---|
Industry | All | Males | Females |
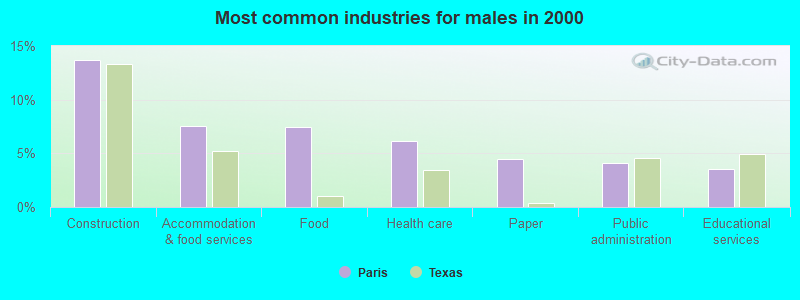
| Health care | 14.9% (1,527) | 6.2% (328) | 24.3% (1,199) |
| Educational services | 9.0% (920) | 3.5% (188) | 14.8% (732) |
| Accommodation and food services | 8.2% (839) | 7.6% (403) | 8.8% (436) |
| Construction | 7.3% (751) | 13.7% (728) | 0.5% (23) |
| Food | 5.8% (592) | 7.5% (397) | 3.9% (195) |
| Finance and insurance | 3.9% (397) | 1.9% (101) | 6.0% (296) |
| Public administration | 3.7% (375) | 4.1% (220) | 3.1% (155) |
| Paper | 3.4% (349) | 4.5% (239) | 2.2% (110) |
| Department and other general merchandise stores | 3.0% (303) | 1.6% (83) | 4.5% (220) |
| Food and beverage stores | 2.4% (244) | 2.0% (104) | 2.8% (140) |
| Administrative and support and waste management services | 2.0% (208) | 3.1% (166) | 0.8% (42) |
| Metal and metal products | 2.0% (202) | 3.2% (172) | 0.6% (30) |
| Real estate and rental and leasing | 1.9% (198) | 2.1% (114) | 1.7% (84) |
| Social assistance | 1.9% (192) | 0.7% (38) | 3.1% (154) |
| Professional, scientific, and technical services | 1.8% (188) | 1.6% (86) | 2.1% (102) |
| Personal and laundry services | 1.8% (181) | 1.4% (72) | 2.2% (109) |
| Truck transportation | 1.7% (174) | 3.2% (168) | 0.1% (6) |
| Religious, grantmaking, civic, professional, and similar organizations | 1.6% (162) | 1.8% (98) | 1.3% (64) |
| Repair and maintenance | 1.4% (141) | 1.9% (103) | 0.8% (38) |
| Broadcasting and telecommunications | 1.3% (134) | 2.3% (124) | 0.2% (10) |
| Building material and garden equipment and supplies dealers | 1.3% (129) | 1.6% (87) | 0.8% (42) |
| Motor vehicle and parts dealers | 1.2% (125) | 2.2% (118) | 0.1% (7) |
| Utilities | 1.2% (121) | 1.7% (92) | 0.6% (29) |
| Miscellaneous manufacturing | 1.1% (109) | 1.6% (84) | 0.5% (25) |
| Pharmacies and drug stores | 1.0% (99) | 0.4% (21) | 1.6% (78) |
| Private households | 0.9% (95) | 0.0% (0) | 1.9% (95) |
| Warehousing and storage | 0.8% (81) | 1.2% (63) | 0.4% (18) |
| Agriculture, forestry, fishing and hunting | 0.8% (79) | 1.5% (79) | 0.0% (0) |
| Publishing, and motion picture and sound recording industries | 0.7% (76) | 0.7% (38) | 0.8% (38) |
| Used merchandise, gift, novelty, and souvenir, and other miscellaneous stores | 0.7% (75) | 0.6% (30) | 0.9% (45) |
| Nonmetallic mineral products | 0.7% (72) | 1.3% (68) | 0.1% (4) |
| Health and personal care, except drug, stores | 0.7% (67) | 0.4% (21) | 0.9% (46) |
| Clothing and accessories, including shoe, stores | 0.6% (66) | 0.2% (9) | 1.2% (57) |
| Other direct selling establishments | 0.6% (63) | 0.5% (26) | 0.7% (37) |
| Transportation equipment | 0.6% (61) | 1.1% (57) | 0.1% (4) |
| Groceries and related products merchant wholesalers | 0.6% (57) | 1.0% (52) | 0.1% (5) |
| Furniture and related product manufacturing | 0.6% (57) | 0.7% (35) | 0.4% (22) |
| Data processing, libraries, and other information services | 0.5% (48) | 0.3% (14) | 0.7% (34) |
| Wood products | 0.5% (47) | 0.6% (34) | 0.3% (13) |
| Furniture and home furnishings, and household appliance stores | 0.5% (47) | 0.7% (37) | 0.2% (10) |
| U. S. Postal service | 0.4% (42) | 0.5% (26) | 0.3% (16) |
| Arts, entertainment, and recreation | 0.4% (42) | 0.2% (11) | 0.6% (31) |
| Electrical equipment, appliances, and components | 0.4% (37) | 0.6% (31) | 0.1% (6) |
| Miscellaneous nondurable goods merchant wholesalers | 0.3% (35) | 0.3% (17) | 0.4% (18) |
| Sporting goods, camera, and hobby and toy stores | 0.3% (34) | 0.4% (22) | 0.2% (12) |
| Farm supplies merchant wholesalers | 0.3% (32) | 0.5% (24) | 0.2% (8) |
| Paper and paper products merchant wholesalers | 0.3% (30) | 0.6% (30) | 0.0% (0) |
| Plastics and rubber products | 0.3% (29) | 0.3% (14) | 0.3% (15) |
| Machinery, equipment, and supplies merchant wholesalers | 0.3% (28) | 0.5% (28) | 0.0% (0) |
| Recyclable material merchant wholesalers | 0.3% (27) | 0.4% (23) | 0.1% (4) |
| Office supplies and stationery stores | 0.2% (21) | 0.4% (21) | 0.0% (0) |
| Other transportation, and support activities, and couriers | 0.2% (21) | 0.4% (21) | 0.0% (0) |
| Electronic shopping and mail-order houses | 0.2% (21) | 0.3% (16) | 0.1% (5) |
| Radio, TV, and computer stores | 0.2% (20) | 0.1% (6) | 0.3% (14) |
| Beverage and tobacco products | 0.2% (18) | 0.2% (11) | 0.1% (7) |
| Lumber and other construction materials merchant wholesalers | 0.2% (18) | 0.3% (18) | 0.0% (0) |
| Drugs, sundries, and chemical and allied products merchant wholesalers | 0.2% (18) | 0.3% (18) | 0.0% (0) |
| Air transportation | 0.2% (17) | 0.0% (0) | 0.3% (17) |
| Machinery | 0.2% (17) | 0.3% (17) | 0.0% (0) |
| Jewelry, luggage, and leather goods stores | 0.1% (14) | 0.1% (7) | 0.1% (7) |
| Vending machine operators | 0.1% (10) | 0.2% (10) | 0.0% (0) |
| Hardware, plumbing and heating equipment, and supplies merchant wholesalers | 0.1% (10) | 0.2% (10) | 0.0% (0) |
| Professional and commercial equipment and supplies merchant wholesalers | 0.1% (8) | 0.2% (8) | 0.0% (0) |
| Chemicals | 0.1% (8) | 0.2% (8) | 0.0% (0) |
| Gasoline stations | 0.1% (7) | 0.1% (7) | 0.0% (0) |
| Electrical and electronic goods merchant wholesalers | 0.1% (6) | 0.1% (6) | 0.0% (0) |
Unemployment in Paris
- Unemployment by race in 2022
- Unemployment rate for White non-Hispanic residents
- 3.6%Males
- 5.3%Females
- Unemployment rate for Black residents
- 2.7%Males
- 4.7%Females
- Unemployment rate for American Indian and Alaska Native residents
- 100.0%Females
- Unemployment rate for Asian residents
- 8.3%Females
- Unemployment rate for two or more race residents
- 13.4%Males
- Unemployment rate for Hispanic or Latino residents
- 4.7%Males
- Unemployment by race in 2000
- Unemployment rate for White non-Hispanic residents
- 5.5%Males
- 4.7%Females
- Unemployment rate for Black residents
- 5.9%Males
- 13.3%Females
- Unemployment rate for American Indian and Alaska Native residents
- 3.2%Males
- Unemployment rate for Asian residents
- 22.2%Females
- Unemployment rate for other race residents
- 11.8%Males
- 10.4%Females
- Unemployment rate for two or more race residents
- 17.9%Males
- 30.2%Females
- Unemployment rate for Hispanic or Latino residents
- 7.8%Males
- 10.2%Females
Unemployment in 2023:
| Paris: | 3.5% |
| Texas: | 3.5% |
Unemployment in 2022:
| Paris: | 4.8% |
| Texas: | 3.9% |
Unemployment in 2021:
| Paris: | 6.3% |
| Texas: | 5.6% |
Unemployment in 2020:
| Paris: | 7.2% |
| Texas: | 7.7% |
Unemployment in 2019:
| Paris: | 3.7% |
| Texas: | 3.5% |
Unemployment in 2018:
| Paris: | 4.2% |
| Texas: | 3.9% |
Unemployment in 2017:
| Paris: | 4.7% |
| Texas: | 4.3% |
Unemployment in 2016:
| Paris: | 5.1% |
| Texas: | 4.6% |
Unemployment in 2015:
| Paris: | 5.0% |
| Texas: | 4.5% |
Unemployment in 2014:
| Paris: | 6.6% |
| Texas: | 5.2% |
Unemployment in 2013:
| Paris: | 8.9% |
| Texas: | 6.3% |
Unemployment in 2012:
| Paris: | 10.1% |
| Texas: | 6.7% |
Unemployment in 2011:
| Paris: | 11.0% |
| Texas: | 8.0% |
Unemployment in 2010:
| Paris: | 10.1% |
| Texas: | 8.2% |
Unemployment in 2009:
| Paris: | 8.2% |
| Texas: | 7.5% |
Unemployment in 2008:
| Paris: | 6.0% |
| Texas: | 4.9% |
Unemployment in 2007:
| Paris: | 5.2% |
| Texas: | 4.4% |
Unemployment in 2006:
| Paris: | 6.0% |
| Texas: | 5.0% |
Unemployment in 2005:
| Paris: | 7.0% |
| Texas: | 5.5% |
Unemployment in 2004:
| Paris: | 6.9% |
| Texas: | 6.0% |
Unemployment in 2003:
| Paris: | 7.8% |
| Texas: | 6.7% |
Unemployment in 2002:
| Paris: | 7.4% |
| Texas: | 6.3% |
Unemployment in 2001:
| Paris: | 6.7% |
| Texas: | 5.0% |
Unemployment in 2000:
| Paris: | 5.4% |
| Texas: | 4.4% |
Unemployment in 1999:
| Paris: | 6.8% |
| Texas: | 4.7% |
Unemployment in 1998:
| Paris: | 7.6% |
| Texas: | 5.0% |
Unemployment in 1997:
| Paris: | 6.6% |
| Texas: | 5.4% |
Unemployment in 1996:
| Paris: | 7.1% |
| Texas: | 5.8% |
Unemployment in 1995:
| Paris: | 8.6% |
| Texas: | 6.1% |
Unemployment in 1994:
| Paris: | 9.1% |
| Texas: | 6.6% |
Unemployment in 1993:
| Paris: | 8.8% |
| Texas: | 7.2% |
Unemployment in 1992:
| Paris: | 9.9% |
| Texas: | 7.7% |
Unemployment in 1991:
| Paris: | 8.6% |
| Texas: | 7.0% |
Unemployment in 1990:
| Paris: | 7.8% |
| Texas: | 6.4% |
Time leaving home to go to work

12:00 a.m. to 4:59 a.m.:
| Paris: | 6.6% (671) |
| Texas: | 5.5% (678,264) |
5:00 a.m. to 5:29 a.m.:
| Paris: | 5.2% (524) |
| Texas: | 4.3% (525,841) |
5:30 a.m. to 5:59 a.m.:
| Paris: | 4.4% (446) |
| Texas: | 4.9% (603,953) |
6:00 a.m. to 6:29 a.m.:
| Paris: | 6.6% (666) |
| Texas: | 9.4% (1,155,020) |
6:30 a.m. to 6:59 a.m.:
| Paris: | 11.5% (1,162) |
| Texas: | 9.3% (1,152,822) |
7:00 a.m. to 7:29 a.m.:
| Paris: | 12.3% (1,243) |
| Texas: | 15.3% (1,885,477) |
7:30 a.m. to 7:59 a.m.:
| Paris: | 13.8% (1,403) |
| Texas: | 11.9% (1,469,628) |
8:00 a.m. to 8:29 a.m.:
| Paris: | 9.5% (963) |
| Texas: | 11.3% (1,400,175) |
8:30 a.m. to 8:59 a.m.:
| Paris: | 8.1% (817) |
| Texas: | 4.9% (599,574) |
9:00 a.m. to 9:59 a.m.:
| Paris: | 6.0% (605) |
| Texas: | 6.7% (829,367) |
10:00 a.m. to 10:59 a.m.:
| Paris: | 0.7% (73) |
| Texas: | 3.2% (390,354) |
11:00 a.m. to 11:59 a.m.:
| Paris: | 1.5% (155) |
| Texas: | 1.3% (162,330) |
12:00 p.m. to 3:59 p.m.:
| Paris: | 5.1% (514) |
| Texas: | 5.8% (720,594) |
4:00 p.m. to 11:59 p.m.:
| Paris: | 8.8% (889) |
| Texas: | 6.3% (777,072) |

<5am:
| Paris: | 3.3% (333) |
| Texas: | 3.1% (281,361) |
5:30am:
| Paris: | 2.0% (202) |
| Texas: | 2.9% (262,060) |
6am:
| Paris: | 3.0% (302) |
| Texas: | 4.4% (403,423) |
6:30am:
| Paris: | 8.0% (814) |
| Texas: | 8.8% (808,876) |
7am:
| Paris: | 11.8% (1,197) |
| Texas: | 10.7% (976,557) |
7:30am:
| Paris: | 14.2% (1,442) |
| Texas: | 16.4% (1,500,904) |
8am:
| Paris: | 20.2% (2,052) |
| Texas: | 16.8% (1,536,308) |
8:30am:
| Paris: | 9.2% (937) |
| Texas: | 10.0% (913,601) |
9am:
| Paris: | 3.9% (398) |
| Texas: | 4.4% (398,656) |
10am:
| Paris: | 4.1% (419) |
| Texas: | 5.2% (472,592) |
11am:
| Paris: | 2.4% (241) |
| Texas: | 2.2% (197,844) |
12pm:
| Paris: | 0.5% (47) |
| Texas: | 0.9% (86,997) |
4pm:
| Paris: | 7.0% (707) |
| Texas: | 5.5% (503,565) |
>4pm:
| Paris: | 8.7% (881) |
| Texas: | 6.1% (563,107) |

12:00 a.m. to 4:59 a.m. - Males:
| Paris: | 8.8% (470) |
| Texas: | 7.0% (477,284) |
5:00 a.m. to 5:29 a.m. - Males:
| Paris: | 7.6% (406) |
| Texas: | 5.8% (394,876) |
5:30 a.m. to 5:59 a.m. - Males:
| Paris: | 4.7% (255) |
| Texas: | 5.9% (402,788) |
6:00 a.m. to 6:29 a.m. - Males:
| Paris: | 6.0% (324) |
| Texas: | 10.9% (751,118) |
6:30 a.m. to 6:59 a.m. - Males:
| Paris: | 12.3% (662) |
| Texas: | 9.5% (652,306) |
7:00 a.m. to 7:29 a.m. - Males:
| Paris: | 8.1% (436) |
| Texas: | 14.1% (970,598) |
7:30 a.m. to 7:59 a.m. - Males:
| Paris: | 11.9% (639) |
| Texas: | 10.2% (696,429) |
8:00 a.m. to 8:29 a.m. - Males:
| Paris: | 12.2% (653) |
| Texas: | 10.6% (729,041) |
8:30 a.m. to 8:59 a.m. - Males:
| Paris: | 6.9% (368) |
| Texas: | 4.1% (281,762) |
9:00 a.m. to 9:59 a.m. - Males:
| Paris: | 7.4% (398) |
| Texas: | 5.8% (401,071) |
10:00 a.m. to 10:59 a.m. - Males:
| Paris: | 0.8% (43) |
| Texas: | 2.7% (186,469) |
12:00 p.m. to 3:59 p.m. - Males:
| Paris: | 6.0% (320) |
| Texas: | 5.8% (397,795) |
4:00 p.m. to 11:59 p.m. - Males:
| Paris: | 7.7% (413) |
| Texas: | 6.4% (435,950) |

12:00 a.m. to 4:59 a.m. - Females:
| Paris: | 4.2% (201) |
| Texas: | 3.7% (200,980) |
5:00 a.m. to 5:29 a.m. - Females:
| Paris: | 2.5% (118) |
| Texas: | 2.4% (130,965) |
5:30 a.m. to 5:59 a.m. - Females:
| Paris: | 4.0% (190) |
| Texas: | 3.7% (201,165) |
6:00 a.m. to 6:29 a.m. - Females:
| Paris: | 7.2% (345) |
| Texas: | 7.4% (403,902) |
6:30 a.m. to 6:59 a.m. - Females:
| Paris: | 10.5% (501) |
| Texas: | 9.1% (500,516) |
7:00 a.m. to 7:29 a.m. - Females:
| Paris: | 17.1% (816) |
| Texas: | 16.7% (914,879) |
7:30 a.m. to 7:59 a.m. - Females:
| Paris: | 16.0% (764) |
| Texas: | 14.1% (773,199) |
8:00 a.m. to 8:29 a.m. - Females:
| Paris: | 6.4% (307) |
| Texas: | 12.2% (671,134) |
8:30 a.m. to 8:59 a.m. - Females:
| Paris: | 9.4% (448) |
| Texas: | 5.8% (317,812) |
9:00 a.m. to 9:59 a.m. - Females:
| Paris: | 4.3% (204) |
| Texas: | 7.8% (428,296) |
10:00 a.m. to 10:59 a.m. - Females:
| Paris: | 0.6% (30) |
| Texas: | 3.7% (203,885) |
11:00 a.m. to 11:59 a.m. - Females:
| Paris: | 3.3% (156) |
| Texas: | 1.5% (80,088) |
12:00 p.m. to 3:59 p.m. - Females:
| Paris: | 4.1% (196) |
| Texas: | 5.9% (322,799) |
4:00 p.m. to 11:59 p.m. - Females:
| Paris: | 9.9% (473) |
| Texas: | 6.2% (341,122) |
Travel time to work
Percentage of workers working in this county: 91.8%
Number of people working at home: 610 (5.5% of all workers)
Daytime population change due to commuting: +8,061 (+31.1%)
Workers who live and work in this city: 8,581 (84.7%)
Number of people working at home: 610 (5.5% of all workers)
Daytime population change due to commuting: +8,061 (+31.1%)
Workers who live and work in this city: 8,581 (84.7%)

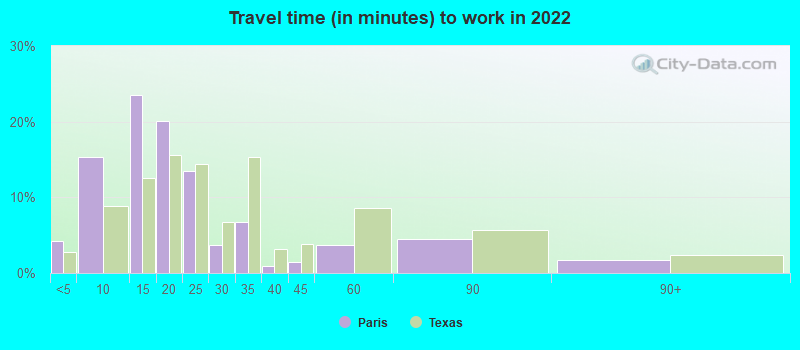

Less than 5 minutes:
| Paris: | 4.3% (800) |
| Texas: | 2.8% (350,462) |
5 to 9 minutes:
| Paris: | 15.3% (2,856) |
| Texas: | 8.8% (1,087,762) |
10 to 14 minutes:
| Paris: | 23.5% (4,388) |
| Texas: | 12.6% (1,550,271) |
15 to 19 minutes:
| Paris: | 20.1% (3,761) |
| Texas: | 15.6% (1,918,353) |
20 to 24 minutes:
| Paris: | 13.5% (2,529) |
| Texas: | 14.4% (1,772,079) |
25 to 29 minutes:
| Paris: | 3.7% (691) |
| Texas: | 6.7% (827,833) |
30 to 34 minutes:
| Paris: | 6.7% (1,257) |
| Texas: | 15.3% (1,887,878) |
35 to 39 minutes:
| Paris: | 0.9% (171) |
| Texas: | 3.2% (394,170) |
40 to 44 minutes:
| Paris: | 1.4% (260) |
| Texas: | 3.9% (476,118) |
45 to 59 minutes:
| Paris: | 3.7% (689) |
| Texas: | 8.6% (1,058,376) |
60 to 89 minutes:
| Paris: | 4.5% (845) |
| Texas: | 5.7% (706,002) |
90 or more minutes:
| Paris: | 1.7% (318) |
| Texas: | 2.4% (299,884) |


Less than 5 minutes:
| Paris: | 4.7% (478) |
| Texas: | 3.0% (277,642) |
5 to 9 minutes:
| Paris: | 26.3% (2,662) |
| Texas: | 10.3% (942,891) |
10 to 14 minutes:
| Paris: | 33.8% (3,429) |
| Texas: | 14.4% (1,317,555) |
15 to 19 minutes:
| Paris: | 15.8% (1,597) |
| Texas: | 16.0% (1,467,945) |
20 to 24 minutes:
| Paris: | 6.4% (649) |
| Texas: | 13.9% (1,276,781) |
25 to 29 minutes:
| Paris: | 0.6% (58) |
| Texas: | 5.3% (482,838) |
30 to 34 minutes:
| Paris: | 3.3% (332) |
| Texas: | 14.3% (1,309,699) |
35 to 39 minutes:
| Paris: | 0.7% (66) |
| Texas: | 2.4% (219,873) |
40 to 44 minutes:
| Paris: | 0.6% (58) |
| Texas: | 3.1% (280,916) |
45 to 59 minutes:
| Paris: | 0.7% (74) |
| Texas: | 7.6% (692,006) |
60 to 89 minutes:
| Paris: | 2.2% (225) |
| Texas: | 4.6% (418,905) |
90 or more minutes:
| Paris: | 3.4% (344) |
| Texas: | 2.4% (218,800) |

Less than 5 minutes - Males:
| Paris: | 3.7% (356) |
| Texas: | 2.7% (181,937) |
5 to 9 minutes - Males:
| Paris: | 14.0% (1,352) |
| Texas: | 7.6% (522,166) |
10 to 14 minutes - Males:
| Paris: | 23.0% (2,220) |
| Texas: | 11.5% (785,572) |
15 to 19 minutes - Males:
| Paris: | 21.2% (2,047) |
| Texas: | 14.6% (1,001,179) |
20 to 24 minutes - Males:
| Paris: | 12.6% (1,219) |
| Texas: | 13.9% (950,043) |
25 to 29 minutes - Males:
| Paris: | 3.9% (374) |
| Texas: | 6.7% (457,259) |
30 to 34 minutes - Males:
| Paris: | 6.1% (592) |
| Texas: | 16.2% (1,110,357) |
35 to 39 minutes - Males:
| Paris: | 0.9% (88) |
| Texas: | 3.3% (223,512) |
40 to 44 minutes - Males:
| Paris: | 1.2% (120) |
| Texas: | 4.2% (289,434) |
45 to 59 minutes - Males:
| Paris: | 3.8% (363) |
| Texas: | 9.3% (639,122) |
60 to 89 minutes - Males:
| Paris: | 5.9% (572) |
| Texas: | 6.8% (467,154) |
90 or more minutes - Males:
| Paris: | 2.5% (244) |
| Texas: | 3.1% (211,313) |

Less than 5 minutes - Females:
| Paris: | 4.9% (441) |
| Texas: | 3.1% (168,525) |
5 to 9 minutes - Females:
| Paris: | 16.6% (1,504) |
| Texas: | 10.3% (565,596) |
10 to 14 minutes - Females:
| Paris: | 24.0% (2,168) |
| Texas: | 13.9% (764,699) |
15 to 19 minutes - Females:
| Paris: | 19.0% (1,714) |
| Texas: | 16.7% (917,174) |
20 to 24 minutes - Females:
| Paris: | 14.5% (1,313) |
| Texas: | 15.0% (822,036) |
25 to 29 minutes - Females:
| Paris: | 3.5% (317) |
| Texas: | 6.7% (370,574) |
30 to 34 minutes - Females:
| Paris: | 7.4% (665) |
| Texas: | 14.2% (777,521) |
35 to 39 minutes - Females:
| Paris: | 0.9% (83) |
| Texas: | 3.1% (170,658) |
40 to 44 minutes - Females:
| Paris: | 1.5% (139) |
| Texas: | 3.4% (186,684) |
45 to 59 minutes - Females:
| Paris: | 3.6% (325) |
| Texas: | 7.6% (419,254) |
60 to 89 minutes - Females:
| Paris: | 3.0% (273) |
| Texas: | 4.4% (238,848) |
90 or more minutes - Females:
| Paris: | 0.8% (73) |
| Texas: | 1.6% (88,571) |
Means of transportation to work
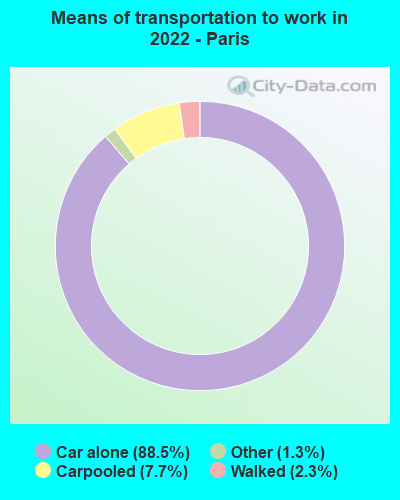

Drove car alone:
| Paris: | 88.5% (17,228) |
| Texas: | 83.3% (4,557,023) |
Carpooled:
| Paris: | 7.7% (1,501) |
| Texas: | 11.7% (674,818) |
Bus:
| Paris: | 0.1% (18) |
| Texas: | 0.9% (50,435) |
Bicycle:
| Paris: | 0.1% (14) |
| Texas: | 0.2% (7,954) |
Walked:
| Paris: | 2.3% (439) |
| Texas: | 1.7% (99,911) |
Other means:
| Paris: | 1.3% (258) |
| Texas: | 2.0% (95,481) |


Drove car alone:
| Paris: | 80.4% (8,146) |
| Texas: | 77.7% (7,115,590) |
Carpooled:
| Paris: | 13.9% (1,413) |
| Texas: | 14.5% (1,326,012) |
Bus or trolley bus:
| Paris: | 0.2% (22) |
| Texas: | 1.7% (157,014) |
Taxicab:
| Paris: | 0.1% (11) |
| Texas: | 0.1% (6,102) |
Motorcycle:
| Paris: | 0.2% (23) |
| Texas: | 0.1% (12,068) |
Bicycle:
| Paris: | 0.1% (12) |
| Texas: | 0.2% (21,551) |
Walked:
| Paris: | 2.4% (247) |
| Texas: | 1.9% (173,670) |
Other means:
| Paris: | 1.0% (98) |
| Texas: | 0.9% (86,692) |


Drove car alone - Males:
| Paris: | 90.3% (9,040) |
| Texas: | 83.6% (4,557,023) |
Carpooled - Males:
| Paris: | 5.8% (583) |
| Texas: | 11.2% (674,818) |
Bus - Males:
| Paris: | 0.1% (11) |
| Texas: | 0.8% (50,435) |
Bicycle - Males:
| Paris: | 0.1% (14) |
| Texas: | 0.3% (7,954) |
Walked - Males:
| Paris: | 1.9% (191) |
| Texas: | 1.7% (99,911) |
Other means - Males:
| Paris: | 1.7% (167) |
| Texas: | 2.2% (95,481) |


Drove car alone - Females:
| Paris: | 86.6% (8,192) |
| Texas: | 83.0% (4,557,023) |
Carpooled - Females:
| Paris: | 9.7% (921) |
| Texas: | 12.3% (674,818) |
Bus - Females:
| Paris: | 0.1% (6) |
| Texas: | 0.9% (50,435) |
Walked - Females:
| Paris: | 2.6% (248) |
| Texas: | 1.8% (99,911) |
Other means - Females:
| Paris: | 1.0% (91) |
| Texas: | 1.7% (95,481) |
Private vehicle occupancy

Drove alone:
| Paris: | 87.7% (8,147) |
| Texas: | 87.6% (10,283,021) |
In 2 person carpool:
| Paris: | 5.8% (542) |
| Texas: | 9.0% (1,052,595) |
In 3 person carpool:
| Paris: | 3.8% (354) |
| Texas: | 2.1% (244,139) |
In 4 person carpool:
| Paris: | 0.2% (18) |
| Texas: | 0.8% (92,732) |
In 5-6 person carpool:
| Paris: | 1.5% (137) |
| Texas: | 0.4% (44,947) |
In 7+ person carpool:
| Paris: | 0.9% (83) |
| Texas: | 0.1% (16,725) |

Drove alone:
| Paris: | 85.2% (8,146) |
| Texas: | 84.3% (7,115,590) |
In 2 person carpool:
| Paris: | 11.5% (1,099) |
| Texas: | 11.6% (982,994) |
In 3 person carpool:
| Paris: | 2.2% (207) |
| Texas: | 2.4% (201,602) |
In 4 person carpool:
| Paris: | 0.9% (88) |
| Texas: | 1.0% (83,518) |
In 5-6 person carpool:
| Paris: | 0.1% (5) |
| Texas: | 0.5% (40,662) |
In 7+ person carpool:
| Paris: | 0.1% (14) |
| Texas: | 0.2% (17,236) |
Class of workers

Employee of private company:
| Paris: | 74.5% (8,390) |
| Texas: | 69.6% (10,139,666) |
Self-employed in own incorporated business:
| Paris: | 0.8% (95) |
| Texas: | 3.5% (516,446) |
Private not-for-profit wage and salary workers:
| Paris: | 3.3% (373) |
| Texas: | 6.0% (870,454) |
Local government workers:
| Paris: | 7.2% (812) |
| Texas: | 7.6% (1,109,799) |
State government workers:
| Paris: | 5.4% (609) |
| Texas: | 3.8% (558,618) |
Federal government workers:
| Paris: | 2.5% (279) |
| Texas: | 2.5% (357,298) |
Self-employed workers in own not incorporated business:
| Paris: | 6.2% (698) |
| Texas: | 6.8% (998,270) |

Employee of private company:
| Paris: | 69.3% (7,118) |
| Texas: | 69.6% (6,425,274) |
Self-employed in own incorporated business:
| Paris: | 2.3% (239) |
| Texas: | 2.7% (250,864) |
Private not-for-profit wage and salary workers:
| Paris: | 7.5% (773) |
| Texas: | 5.7% (526,631) |
Local government workers:
| Paris: | 6.0% (616) |
| Texas: | 6.6% (608,479) |
State government workers:
| Paris: | 5.9% (610) |
| Texas: | 5.4% (501,082) |
Federal government workers:
| Paris: | 1.0% (101) |
| Texas: | 2.6% (237,177) |
Self-employed workers in own not incorporated business:
| Paris: | 7.7% (787) |
| Texas: | 7.1% (653,527) |
Unpaid family workers:
| Paris: | 0.2% (21) |
| Texas: | 0.3% (31,338) |

Employee of private company - Males:
| Paris: | 77.2% (4,576) |
| Texas: | 73.1% (5,788,450) |
Self-employed in own incorporated business - Males:
| Paris: | 1.4% (83) |
| Texas: | 4.2% (332,655) |
Private not-for-profit wage and salary workers - Males:
| Paris: | 1.4% (83) |
| Texas: | 4.1% (323,476) |
Local government workers - Males:
| Paris: | 8.7% (516) |
| Texas: | 5.1% (405,467) |
State government workers - Males:
| Paris: | 2.2% (130) |
| Texas: | 3.0% (236,706) |
Federal government workers - Males:
| Paris: | 2.1% (126) |
| Texas: | 2.7% (211,629) |
Self-employed workers in own not incorporated business - Males:
| Paris: | 7.1% (418) |
| Texas: | 7.7% (609,246) |

Employee of private company - Females:
| Paris: | 71.6% (3,813) |
| Texas: | 65.4% (4,351,216) |
Self-employed in own incorporated business - Females:
| Paris: | 0.2% (13) |
| Texas: | 2.8% (183,791) |
Private not-for-profit wage and salary workers - Females:
| Paris: | 5.5% (290) |
| Texas: | 8.2% (546,978) |
Local government workers - Females:
| Paris: | 5.6% (297) |
| Texas: | 10.6% (704,332) |
State government workers - Females:
| Paris: | 9.0% (479) |
| Texas: | 4.8% (321,912) |
Federal government workers - Females:
| Paris: | 2.9% (153) |
| Texas: | 2.2% (145,669) |
Self-employed workers in own not incorporated business - Females:
| Paris: | 5.3% (280) |
| Texas: | 5.8% (389,024) |