Work and Jobs in Pavilion, New York (NY) Detailed Stats
Occupations, Industries, Unemployment, Workers, Commute
Settings
X


Recent posts about work in Pavilion, New York on our local forum with over 2,400,000 registered users:
 | Upstate NY job openings...... (1437 replies) |
| Events in Syracuse? (1174 replies) |
| smaller Upstate NY cities and towns/African American communities (6034 replies) |
| Syracuse summer festival season kicks off this weekend! (22 replies) |
| Gateway to White Plains (incredible blight) and Why? (2 replies) |
| 30 year old female professional relocating (58 replies) |
Latest news about work in Pavilion, NY collected exclusively by city-data.com from local newspapers, TV, and radio stations
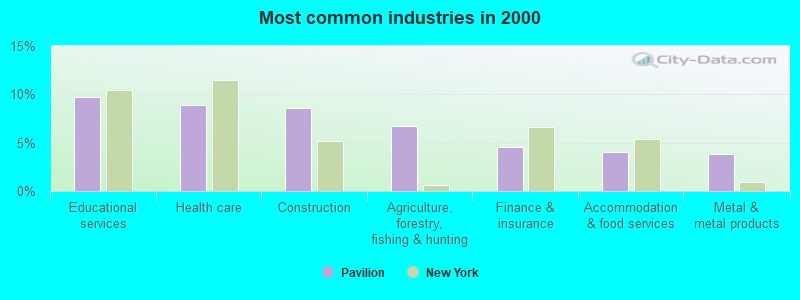
The most common industries in Pavilion are: Educational services (9.8% of civilian employees), Health care (8.9% of civilian employees), Construction (8.6% of civilian employees). 65.7% of workers are employees of private companies, which is 3.1% greater than the rate of 63.7% across the entire state of New York.
Most common industries
Most common industries | |||
|---|---|---|---|
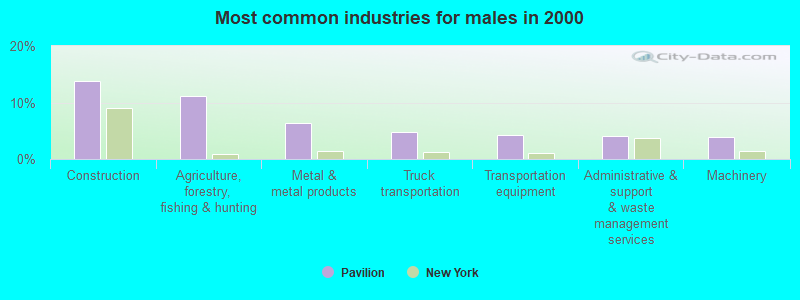
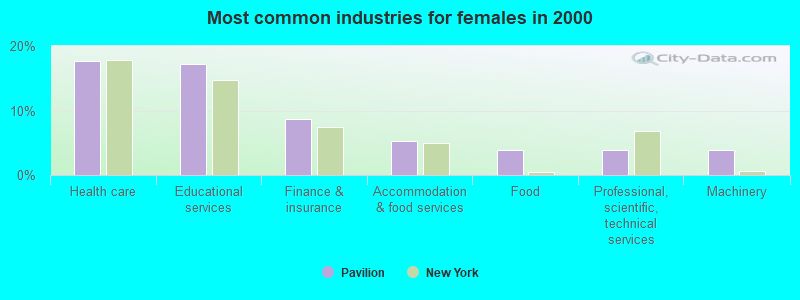
Industry | All | Males | Females |
| Educational services | 9.8% (127) | 3.3% (23) | 17.2% (104) |
| Health care | 8.9% (116) | 1.3% (9) | 17.7% (107) |
| Construction | 8.6% (112) | 13.7% (96) | 2.7% (16) |
| Agriculture, forestry, fishing and hunting | 6.8% (88) | 11.2% (78) | 1.7% (10) |
| Finance and insurance | 4.5% (59) | 1.0% (7) | 8.6% (52) |
| Accommodation and food services | 4.0% (52) | 2.9% (20) | 5.3% (32) |
| Metal and metal products | 3.8% (50) | 6.3% (44) | 1.0% (6) |
| Machinery | 3.8% (50) | 3.9% (27) | 3.8% (23) |
| Printing and related support activities | 2.7% (35) | 3.3% (23) | 2.0% (12) |
| Food | 2.6% (34) | 1.6% (11) | 3.8% (23) |
| Truck transportation | 2.5% (33) | 4.7% (33) | 0.0% (0) |
| Administrative and support and waste management services | 2.5% (32) | 4.0% (28) | 0.7% (4) |
| Public administration | 2.4% (31) | 3.1% (22) | 1.5% (9) |
| Professional, scientific, and technical services | 2.4% (31) | 1.1% (8) | 3.8% (23) |
| Nonmetallic mineral products | 2.3% (30) | 2.9% (20) | 1.7% (10) |
| Transportation equipment | 2.3% (30) | 4.3% (30) | 0.0% (0) |
| Miscellaneous manufacturing | 2.0% (26) | 0.7% (5) | 3.5% (21) |
| Religious, grantmaking, civic, professional, and similar organizations | 1.7% (22) | 1.1% (8) | 2.3% (14) |
| Personal and laundry services | 1.7% (22) | 0.7% (5) | 2.8% (17) |
| Repair and maintenance | 1.7% (22) | 3.1% (22) | 0.0% (0) |
| Plastics and rubber products | 1.4% (18) | 2.0% (14) | 0.7% (4) |
| Arts, entertainment, and recreation | 1.2% (15) | 1.0% (7) | 1.3% (8) |
| Building material and garden equipment and supplies dealers | 1.2% (15) | 2.1% (15) | 0.0% (0) |
| Department and other general merchandise stores | 1.2% (15) | 1.6% (11) | 0.7% (4) |
| Mining, quarrying, and oil and gas extraction | 1.1% (14) | 1.3% (9) | 0.8% (5) |
| Social assistance | 1.1% (14) | 0.7% (5) | 1.5% (9) |
| Other direct selling establishments | 1.0% (13) | 1.3% (9) | 0.7% (4) |
| Paper | 0.9% (12) | 0.4% (3) | 1.5% (9) |
| U. S. Postal service | 0.9% (12) | 0.0% (0) | 2.0% (12) |
| Chemicals | 0.8% (11) | 0.7% (5) | 1.0% (6) |
| Warehousing and storage | 0.8% (11) | 0.6% (4) | 1.2% (7) |
| Food and beverage stores | 0.8% (10) | 0.9% (6) | 0.7% (4) |
| Leather and allied products | 0.8% (10) | 0.0% (0) | 1.7% (10) |
| Computer and electronic products | 0.8% (10) | 0.6% (4) | 1.0% (6) |
| Groceries and related products merchant wholesalers | 0.8% (10) | 1.0% (7) | 0.5% (3) |
| Utilities | 0.7% (9) | 1.3% (9) | 0.0% (0) |
| Pharmacies and drug stores | 0.6% (8) | 0.6% (4) | 0.7% (4) |
| Broadcasting and telecommunications | 0.6% (8) | 0.6% (4) | 0.7% (4) |
| Publishing, and motion picture and sound recording industries | 0.6% (8) | 0.7% (5) | 0.5% (3) |
| Farm supplies merchant wholesalers | 0.5% (7) | 0.4% (3) | 0.7% (4) |
| Real estate and rental and leasing | 0.5% (7) | 1.0% (7) | 0.0% (0) |
| Clothing and accessories, including shoe, stores | 0.5% (7) | 1.0% (7) | 0.0% (0) |
| Other transportation, and support activities, and couriers | 0.5% (7) | 0.4% (3) | 0.7% (4) |
| Alcoholic beverages merchant wholesalers | 0.5% (6) | 0.9% (6) | 0.0% (0) |
| Gasoline stations | 0.4% (5) | 0.7% (5) | 0.0% (0) |
| Rail transportation | 0.4% (5) | 0.7% (5) | 0.0% (0) |
| Electrical equipment, appliances, and components | 0.3% (4) | 0.6% (4) | 0.0% (0) |
| Professional and commercial equipment and supplies merchant wholesalers | 0.3% (4) | 0.6% (4) | 0.0% (0) |
| Lumber and other construction materials merchant wholesalers | 0.3% (4) | 0.6% (4) | 0.0% (0) |
| Petroleum and petroleum products merchant wholesalers | 0.3% (4) | 0.6% (4) | 0.0% (0) |
| Miscellaneous durable goods merchant wholesalers | 0.3% (4) | 0.0% (0) | 0.7% (4) |
| Machinery, equipment, and supplies merchant wholesalers | 0.3% (4) | 0.6% (4) | 0.0% (0) |
| Beverage and tobacco products | 0.2% (3) | 0.4% (3) | 0.0% (0) |
| Data processing, libraries, and other information services | 0.2% (3) | 0.0% (0) | 0.5% (3) |
| Furniture and home furnishings, and household appliance stores | 0.2% (3) | 0.0% (0) | 0.5% (3) |
Unemployment in Pavilion
- Unemployment by race in 2000
- Unemployment rate for White non-Hispanic residents
- 4.7%Males
- 1.5%Females
Time leaving home to go to work

<5am:
| Pavilion: | 3.2% (40) |
| New York: | 2.4% (194,562) |
5:30am:
| Pavilion: | 4.6% (58) |
| New York: | 2.1% (174,328) |
6am:
| Pavilion: | 4.0% (51) |
| New York: | 3.1% (253,826) |
6:30am:
| Pavilion: | 8.1% (102) |
| New York: | 7.0% (573,349) |
7am:
| Pavilion: | 14.3% (180) |
| New York: | 8.6% (706,982) |
7:30am:
| Pavilion: | 15.9% (200) |
| New York: | 14.0% (1,147,579) |
8am:
| Pavilion: | 17.6% (222) |
| New York: | 14.8% (1,213,706) |
8:30am:
| Pavilion: | 7.5% (94) |
| New York: | 13.9% (1,144,298) |
9am:
| Pavilion: | 5.7% (72) |
| New York: | 7.5% (614,475) |
10am:
| Pavilion: | 4.0% (51) |
| New York: | 7.2% (593,377) |
11am:
| Pavilion: | 0.9% (11) |
| New York: | 2.7% (224,011) |
4pm:
| Pavilion: | 5.0% (63) |
| New York: | 6.3% (517,309) |
>4pm:
| Pavilion: | 6.8% (86) |
| New York: | 6.1% (501,196) |
Travel time to work


Less than 5 minutes:
| Pavilion: | 6.7% (85) |
| New York: | 2.7% (219,036) |
5 to 9 minutes:
| Pavilion: | 9.3% (117) |
| New York: | 8.3% (680,270) |
10 to 14 minutes:
| Pavilion: | 11.9% (150) |
| New York: | 11.6% (956,590) |
15 to 19 minutes:
| Pavilion: | 12.6% (159) |
| New York: | 12.4% (1,020,084) |
20 to 24 minutes:
| Pavilion: | 13.0% (164) |
| New York: | 12.3% (1,013,757) |
25 to 29 minutes:
| Pavilion: | 6.2% (78) |
| New York: | 4.9% (399,384) |
30 to 34 minutes:
| Pavilion: | 8.0% (101) |
| New York: | 12.9% (1,058,688) |
35 to 39 minutes:
| Pavilion: | 6.6% (83) |
| New York: | 2.5% (203,722) |
40 to 44 minutes:
| Pavilion: | 7.9% (99) |
| New York: | 4.1% (340,311) |
45 to 59 minutes:
| Pavilion: | 12.1% (152) |
| New York: | 9.8% (806,556) |
60 to 89 minutes:
| Pavilion: | 2.1% (26) |
| New York: | 10.3% (848,185) |
90 or more minutes:
| Pavilion: | 1.3% (16) |
| New York: | 5.1% (417,464) |
Means of transportation to work


Drove car alone:
| Pavilion: | 85.4% (1,077) |
| New York: | 56.3% (4,620,178) |
Carpooled:
| Pavilion: | 7.9% (100) |
| New York: | 9.2% (756,918) |
Bus or trolley bus:
| Pavilion: | 1.1% (14) |
| New York: | 5.8% (475,389) |
Walked:
| Pavilion: | 2.5% (31) |
| New York: | 6.2% (511,721) |
Other means:
| Pavilion: | 0.6% (8) |
| New York: | 0.5% (40,375) |
Private vehicle occupancy

Drove alone:
| Pavilion: | 91.5% (1,077) |
| New York: | 85.9% (4,620,178) |
In 2 person carpool:
| Pavilion: | 7.6% (90) |
| New York: | 11.0% (590,255) |
In 3 person carpool:
| Pavilion: | 0.8% (10) |
| New York: | 1.8% (96,470) |
Class of workers

Employee of private company:
| Pavilion: | 65.7% (856) |
| New York: | 63.7% (5,340,134) |
Self-employed in own incorporated business:
| Pavilion: | 3.1% (40) |
| New York: | 3.4% (283,619) |
Private not-for-profit wage and salary workers:
| Pavilion: | 9.0% (117) |
| New York: | 9.7% (810,356) |
Local government workers:
| Pavilion: | 8.3% (108) |
| New York: | 10.2% (858,120) |
State government workers:
| Pavilion: | 4.0% (52) |
| New York: | 4.6% (383,673) |
Federal government workers:
| Pavilion: | 1.5% (20) |
| New York: | 2.2% (185,100) |
Self-employed workers in own not incorporated business:
| Pavilion: | 8.1% (106) |
| New York: | 6.0% (501,068) |
Unpaid family workers:
| Pavilion: | 0.2% (3) |
| New York: | 0.2% (20,918) |

Employee of private company - Males:
| Pavilion: | 71.1% (497) |
| New York: | 66.2% (2,902,064) |
Self-employed in own incorporated business - Males:
| Pavilion: | 4.7% (33) |
| New York: | 4.9% (215,651) |
Private not-for-profit wage and salary workers - Males:
| Pavilion: | 3.9% (27) |
| New York: | 6.3% (277,787) |
Local government workers - Males:
| Pavilion: | 4.0% (28) |
| New York: | 8.7% (380,426) |
State government workers - Males:
| Pavilion: | 2.4% (17) |
| New York: | 4.1% (181,784) |
Federal government workers - Males:
| Pavilion: | 0.6% (4) |
| New York: | 2.3% (102,647) |
Self-employed workers in own not incorporated business - Males:
| Pavilion: | 12.9% (90) |
| New York: | 7.1% (312,497) |
Unpaid family workers - Males:
| Pavilion: | 0.4% (3) |
| New York: | 0.2% (9,470) |

Employee of private company - Females:
| Pavilion: | 59.5% (359) |
| New York: | 60.9% (2,438,070) |
Self-employed in own incorporated business - Females:
| Pavilion: | 1.2% (7) |
| New York: | 1.7% (67,968) |
Private not-for-profit wage and salary workers - Females:
| Pavilion: | 14.9% (90) |
| New York: | 13.3% (532,569) |
Local government workers - Females:
| Pavilion: | 13.3% (80) |
| New York: | 11.9% (477,694) |
State government workers - Females:
| Pavilion: | 5.8% (35) |
| New York: | 5.0% (201,889) |
Federal government workers - Females:
| Pavilion: | 2.7% (16) |
| New York: | 2.1% (82,453) |
Self-employed workers in own not incorporated business - Females:
| Pavilion: | 2.7% (16) |
| New York: | 4.7% (188,571) |