Work and Jobs in Perth, New York (NY) Detailed Stats
Occupations, Industries, Unemployment, Workers, Commute

Recent posts about work in Perth, New York on our local forum with over 2,400,000 registered users:
 | City Moving Migrants Into Former Catholic School On SI - Residents Lose Their Minds (196 replies) |
| smaller Upstate NY cities and towns/African American communities (6040 replies) |
| Visiting North Shore Nassau County... (17 replies) |
| Nevada to NY (10 replies) |
| Woman lives in nycha since 1956. (49 replies) |
| Moving from Perth, Australia, to New York (17 replies) |
Latest news about work in Perth, NY collected exclusively by city-data.com from local newspapers, TV, and radio stations
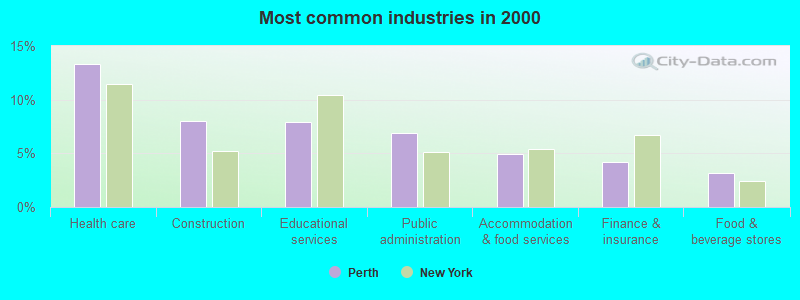
The most common industries in Perth are: Health care (13.4% of civilian employees), Construction (8.0% of civilian employees), Educational services (8.0% of civilian employees). 61.3% of workers are employees of private companies, which is 4.0% less than the rate of 63.7% across the entire state of New York.
Most common industries
Most common industries | |||
|---|---|---|---|
Industry | All | Males | Females |
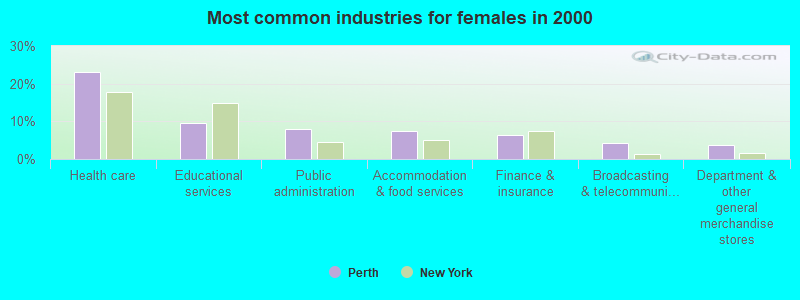
| Health care | 13.4% (208) | 3.8% (30) | 23.2% (178) |
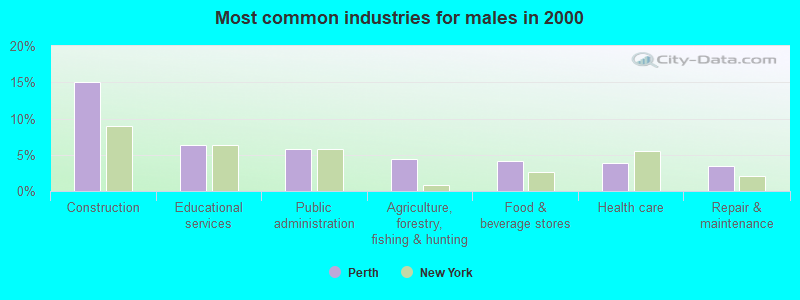
| Construction | 8.0% (125) | 15.1% (119) | 0.8% (6) |
| Educational services | 8.0% (124) | 6.3% (50) | 9.6% (74) |
| Public administration | 6.9% (108) | 5.8% (46) | 8.1% (62) |
| Accommodation and food services | 4.9% (77) | 2.4% (19) | 7.6% (58) |
| Finance and insurance | 4.2% (66) | 2.2% (17) | 6.4% (49) |
| Food and beverage stores | 3.2% (50) | 4.2% (33) | 2.2% (17) |
| Department and other general merchandise stores | 2.7% (42) | 1.8% (14) | 3.7% (28) |
| Professional, scientific, and technical services | 2.5% (39) | 2.7% (21) | 2.3% (18) |
| Broadcasting and telecommunications | 2.5% (39) | 0.9% (7) | 4.2% (32) |
| Agriculture, forestry, fishing and hunting | 2.2% (35) | 4.4% (35) | 0.0% (0) |
| Printing and related support activities | 2.2% (35) | 1.6% (13) | 2.9% (22) |
| Chemicals | 2.2% (35) | 2.3% (18) | 2.2% (17) |
| Religious, grantmaking, civic, professional, and similar organizations | 1.9% (29) | 1.9% (15) | 1.8% (14) |
| Food | 1.7% (27) | 0.6% (5) | 2.9% (22) |
| Repair and maintenance | 1.7% (27) | 3.4% (27) | 0.0% (0) |
| Utilities | 1.7% (27) | 3.4% (27) | 0.0% (0) |
| Groceries and related products merchant wholesalers | 1.6% (25) | 2.4% (19) | 0.8% (6) |
| Textile mills and textile products | 1.6% (25) | 1.9% (15) | 1.3% (10) |
| Building material and garden equipment and supplies dealers | 1.6% (25) | 1.4% (11) | 1.8% (14) |
| Nonmetallic mineral products | 1.4% (22) | 2.8% (22) | 0.0% (0) |
| Machinery | 1.4% (22) | 2.8% (22) | 0.0% (0) |
| Data processing, libraries, and other information services | 1.4% (22) | 1.8% (14) | 1.0% (8) |
| Electrical equipment, appliances, and components | 1.3% (21) | 2.7% (21) | 0.0% (0) |
| Clothing and accessories, including shoe, stores | 1.3% (21) | 1.6% (13) | 1.0% (8) |
| Paper | 1.3% (20) | 2.5% (20) | 0.0% (0) |
| Other transportation, and support activities, and couriers | 1.2% (18) | 1.1% (9) | 1.2% (9) |
| Motor vehicle and parts dealers | 1.2% (18) | 1.6% (13) | 0.7% (5) |
| Miscellaneous nondurable goods merchant wholesalers | 1.1% (17) | 1.4% (11) | 0.8% (6) |
| Miscellaneous manufacturing | 1.0% (15) | 0.8% (6) | 1.2% (9) |
| Wood products | 0.9% (14) | 1.1% (9) | 0.7% (5) |
| Professional and commercial equipment and supplies merchant wholesalers | 0.8% (13) | 1.6% (13) | 0.0% (0) |
| Transportation equipment | 0.7% (11) | 0.5% (4) | 0.9% (7) |
| Social assistance | 0.7% (11) | 0.0% (0) | 1.4% (11) |
| Apparel | 0.7% (11) | 0.0% (0) | 1.4% (11) |
| Furniture and related product manufacturing | 0.6% (10) | 1.3% (10) | 0.0% (0) |
| Computer and electronic products | 0.6% (10) | 1.3% (10) | 0.0% (0) |
| Furniture and home furnishings, and household appliance stores | 0.6% (10) | 0.9% (7) | 0.4% (3) |
| Warehousing and storage | 0.6% (9) | 0.8% (6) | 0.4% (3) |
| Used merchandise, gift, novelty, and souvenir, and other miscellaneous stores | 0.6% (9) | 0.0% (0) | 1.2% (9) |
| Alcoholic beverages merchant wholesalers | 0.6% (9) | 1.1% (9) | 0.0% (0) |
| Leather and allied products | 0.5% (8) | 0.0% (0) | 1.0% (8) |
| Personal and laundry services | 0.5% (8) | 0.0% (0) | 1.0% (8) |
| U. S. Postal service | 0.5% (8) | 1.0% (8) | 0.0% (0) |
| Publishing, and motion picture and sound recording industries | 0.4% (7) | 0.0% (0) | 0.9% (7) |
| Gasoline stations | 0.4% (6) | 0.8% (6) | 0.0% (0) |
| Jewelry, luggage, and leather goods stores | 0.4% (6) | 0.0% (0) | 0.8% (6) |
| Other direct selling establishments | 0.4% (6) | 0.0% (0) | 0.8% (6) |
| Administrative and support and waste management services | 0.4% (6) | 0.0% (0) | 0.8% (6) |
| Arts, entertainment, and recreation | 0.4% (6) | 0.8% (6) | 0.0% (0) |
| Motor vehicles, parts and supplies merchant wholesalers | 0.4% (6) | 0.8% (6) | 0.0% (0) |
| Private households | 0.3% (5) | 0.0% (0) | 0.7% (5) |
| Truck transportation | 0.3% (4) | 0.5% (4) | 0.0% (0) |
Unemployment in Perth
- Unemployment by race in 2000
- Unemployment rate for White non-Hispanic residents
- 4.8%Males
- 2.9%Females
Time leaving home to go to work

<5am:
| Perth: | 1.2% (18) |
| New York: | 2.4% (194,562) |
5:30am:
| Perth: | 2.6% (41) |
| New York: | 2.1% (174,328) |
6am:
| Perth: | 6.4% (99) |
| New York: | 3.1% (253,826) |
6:30am:
| Perth: | 14.1% (219) |
| New York: | 7.0% (573,349) |
7am:
| Perth: | 13.3% (206) |
| New York: | 8.6% (706,982) |
7:30am:
| Perth: | 12.4% (193) |
| New York: | 14.0% (1,147,579) |
8am:
| Perth: | 12.2% (190) |
| New York: | 14.8% (1,213,706) |
8:30am:
| Perth: | 8.1% (125) |
| New York: | 13.9% (1,144,298) |
9am:
| Perth: | 3.6% (56) |
| New York: | 7.5% (614,475) |
10am:
| Perth: | 3.6% (56) |
| New York: | 7.2% (593,377) |
11am:
| Perth: | 1.2% (18) |
| New York: | 2.7% (224,011) |
12pm:
| Perth: | 0.5% (8) |
| New York: | 1.3% (105,049) |
4pm:
| Perth: | 7.5% (116) |
| New York: | 6.3% (517,309) |
>4pm:
| Perth: | 6.8% (105) |
| New York: | 6.1% (501,196) |
Travel time to work


Less than 5 minutes:
| Perth: | 3.8% (59) |
| New York: | 2.7% (219,036) |
5 to 9 minutes:
| Perth: | 6.8% (106) |
| New York: | 8.3% (680,270) |
10 to 14 minutes:
| Perth: | 15.9% (247) |
| New York: | 11.6% (956,590) |
15 to 19 minutes:
| Perth: | 21.5% (334) |
| New York: | 12.4% (1,020,084) |
20 to 24 minutes:
| Perth: | 10.1% (156) |
| New York: | 12.3% (1,013,757) |
25 to 29 minutes:
| Perth: | 3.2% (50) |
| New York: | 4.9% (399,384) |
30 to 34 minutes:
| Perth: | 7.3% (113) |
| New York: | 12.9% (1,058,688) |
35 to 39 minutes:
| Perth: | 3.7% (58) |
| New York: | 2.5% (203,722) |
40 to 44 minutes:
| Perth: | 7.0% (109) |
| New York: | 4.1% (340,311) |
45 to 59 minutes:
| Perth: | 5.5% (85) |
| New York: | 9.8% (806,556) |
60 to 89 minutes:
| Perth: | 8.1% (125) |
| New York: | 10.3% (848,185) |
90 or more minutes:
| Perth: | 0.5% (8) |
| New York: | 5.1% (417,464) |
Means of transportation to work


Drove car alone:
| Perth: | 79.7% (1,237) |
| New York: | 56.3% (4,620,178) |
Carpooled:
| Perth: | 10.7% (166) |
| New York: | 9.2% (756,918) |
Bus or trolley bus:
| Perth: | 1.2% (18) |
| New York: | 5.8% (475,389) |
Walked:
| Perth: | 1.9% (29) |
| New York: | 6.2% (511,721) |
Private vehicle occupancy

Drove alone:
| Perth: | 88.2% (1,237) |
| New York: | 85.9% (4,620,178) |
In 2 person carpool:
| Perth: | 9.4% (132) |
| New York: | 11.0% (590,255) |
In 3 person carpool:
| Perth: | 1.8% (25) |
| New York: | 1.8% (96,470) |
In 4 person carpool:
| Perth: | 0.6% (9) |
| New York: | 0.7% (36,112) |
Class of workers

Employee of private company:
| Perth: | 61.3% (954) |
| New York: | 63.7% (5,340,134) |
Self-employed in own incorporated business:
| Perth: | 1.3% (21) |
| New York: | 3.4% (283,619) |
Private not-for-profit wage and salary workers:
| Perth: | 13.6% (211) |
| New York: | 9.7% (810,356) |
Local government workers:
| Perth: | 6.4% (99) |
| New York: | 10.2% (858,120) |
State government workers:
| Perth: | 6.6% (102) |
| New York: | 4.6% (383,673) |
Federal government workers:
| Perth: | 1.7% (26) |
| New York: | 2.2% (185,100) |
Self-employed workers in own not incorporated business:
| Perth: | 9.2% (144) |
| New York: | 6.0% (501,068) |

Employee of private company - Males:
| Perth: | 65.8% (520) |
| New York: | 66.2% (2,902,064) |
Self-employed in own incorporated business - Males:
| Perth: | 2.0% (16) |
| New York: | 4.9% (215,651) |
Private not-for-profit wage and salary workers - Males:
| Perth: | 5.6% (44) |
| New York: | 6.3% (277,787) |
Local government workers - Males:
| Perth: | 7.5% (59) |
| New York: | 8.7% (380,426) |
State government workers - Males:
| Perth: | 6.6% (52) |
| New York: | 4.1% (181,784) |
Federal government workers - Males:
| Perth: | 1.8% (14) |
| New York: | 2.3% (102,647) |
Self-employed workers in own not incorporated business - Males:
| Perth: | 10.8% (85) |
| New York: | 7.1% (312,497) |

Employee of private company - Females:
| Perth: | 56.6% (434) |
| New York: | 60.9% (2,438,070) |
Self-employed in own incorporated business - Females:
| Perth: | 0.7% (5) |
| New York: | 1.7% (67,968) |
Private not-for-profit wage and salary workers - Females:
| Perth: | 21.8% (167) |
| New York: | 13.3% (532,569) |
Local government workers - Females:
| Perth: | 5.2% (40) |
| New York: | 11.9% (477,694) |
State government workers - Females:
| Perth: | 6.5% (50) |
| New York: | 5.0% (201,889) |
Federal government workers - Females:
| Perth: | 1.6% (12) |
| New York: | 2.1% (82,453) |
Self-employed workers in own not incorporated business - Females:
| Perth: | 7.7% (59) |
| New York: | 4.7% (188,571) |