Work and Jobs in Pharr, Texas (TX) Detailed Stats
Occupations, Industries, Unemployment, Workers, Commute
Settings
X


Recent posts about work in Pharr, Texas on our local forum with over 2,400,000 registered users:
 | What is it like for a white person living in McAllen/ Edinburg? (61 replies) |
| What can you tell me about Pharr TX? (75 replies) |
| Need help choosing a city in Hidalgo County! (4 replies) |
| McAllen or Harlingen? (6 replies) |
| Coming Soon to Austin (1 reply) |
| Moving to Rio Grande Valley-Nurses help! (6 replies) |
Latest news about work in Pharr, TX collected exclusively by city-data.com from local newspapers, TV, and radio stations
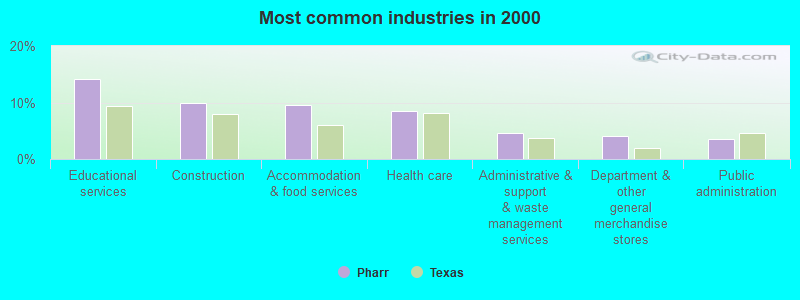
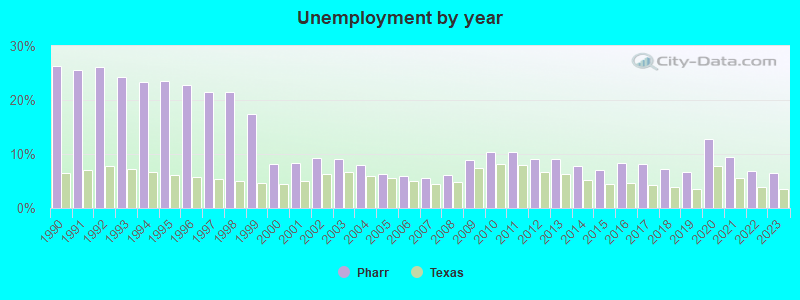
The unemployment rate in 2023 in Pharr, TX was 6.5%, which was 46.2% greater than the unemployment rate of 3.5% across the entire state of Texas. Compared to the unemployment rate of 9.0% in 2013, this represents a decrease of 38.5%. The most common industries in Pharr are: Educational services (14.1% of civilian employees), Construction (9.9% of civilian employees), Accommodation & food services (9.5% of civilian employees). 90.8% of workers work in Hidalgo County and 6.7% of all workers work at home. 69.2% of workers are employees of private companies, which is about the same as the rate of 69.6% across the entire state of Texas.
Whole page based on the data from 2000 / 2022 when the population of Pharr, Texas was 46,660 / 80,170
Whole page based on the data from 2000 / 2022 when the population of Pharr, Texas was 46,660 / 80,170
Most common industries
Most common industries | |||
|---|---|---|---|
Industry | All | Males | Females |
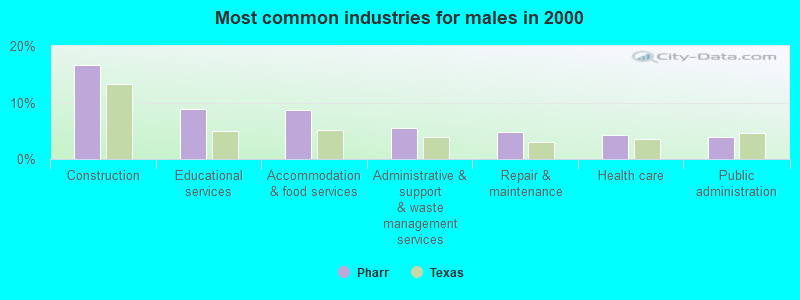
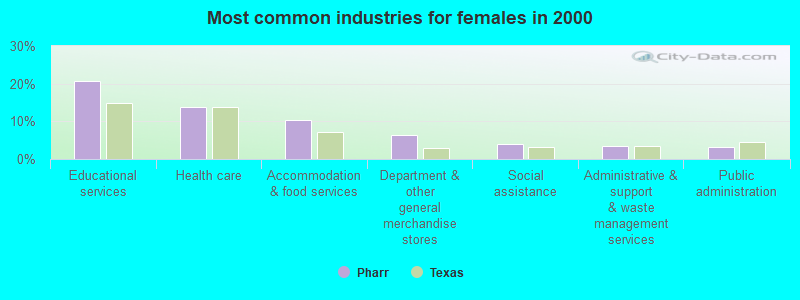
| Educational services | 14.1% (2,043) | 8.8% (719) | 20.8% (1,324) |
| Construction | 9.9% (1,435) | 16.6% (1,354) | 1.3% (81) |
| Accommodation and food services | 9.5% (1,374) | 8.7% (711) | 10.4% (663) |
| Health care | 8.4% (1,220) | 4.2% (342) | 13.8% (878) |
| Administrative and support and waste management services | 4.6% (669) | 5.5% (446) | 3.5% (223) |
| Department and other general merchandise stores | 4.1% (594) | 2.4% (193) | 6.3% (401) |
| Public administration | 3.6% (517) | 3.9% (322) | 3.1% (195) |
| Repair and maintenance | 3.3% (476) | 4.7% (386) | 1.4% (90) |
| Agriculture, forestry, fishing and hunting | 2.8% (400) | 3.7% (298) | 1.6% (102) |
| Food and beverage stores | 2.6% (379) | 2.5% (206) | 2.7% (173) |
| Motor vehicle and parts dealers | 2.2% (325) | 2.9% (237) | 1.4% (88) |
| Social assistance | 2.0% (291) | 0.4% (30) | 4.1% (261) |
| Finance and insurance | 2.0% (286) | 1.3% (105) | 2.8% (181) |
| Truck transportation | 1.9% (273) | 3.2% (261) | 0.2% (12) |
| Professional, scientific, and technical services | 1.6% (225) | 1.0% (85) | 2.2% (140) |
| Groceries and related products merchant wholesalers | 1.4% (207) | 1.9% (157) | 0.8% (50) |
| Other transportation, and support activities, and couriers | 1.4% (202) | 2.1% (169) | 0.5% (33) |
| Personal and laundry services | 1.4% (198) | 0.5% (42) | 2.5% (156) |
| Food | 1.2% (181) | 2.1% (170) | 0.2% (11) |
| Apparel | 1.2% (169) | 0.3% (25) | 2.3% (144) |
| Arts, entertainment, and recreation | 1.1% (165) | 1.5% (120) | 0.7% (45) |
| Other direct selling establishments | 1.0% (152) | 0.5% (43) | 1.7% (109) |
| Religious, grantmaking, civic, professional, and similar organizations | 1.0% (152) | 0.8% (64) | 1.4% (88) |
| Miscellaneous manufacturing | 1.0% (144) | 1.3% (105) | 0.6% (39) |
| Clothing and accessories, including shoe, stores | 1.0% (143) | 0.3% (25) | 1.9% (118) |
| Mining, quarrying, and oil and gas extraction | 0.8% (118) | 1.4% (118) | 0.0% (0) |
| Broadcasting and telecommunications | 0.8% (114) | 0.6% (47) | 1.1% (67) |
| Private households | 0.8% (113) | 0.1% (12) | 1.6% (101) |
| Publishing, and motion picture and sound recording industries | 0.8% (111) | 1.0% (85) | 0.4% (26) |
| Used merchandise, gift, novelty, and souvenir, and other miscellaneous stores | 0.7% (107) | 0.8% (67) | 0.6% (40) |
| Building material and garden equipment and supplies dealers | 0.6% (92) | 0.9% (77) | 0.2% (15) |
| Computer and electronic products | 0.6% (89) | 0.7% (60) | 0.5% (29) |
| Furniture and home furnishings, and household appliance stores | 0.6% (83) | 0.8% (69) | 0.2% (14) |
| Real estate and rental and leasing | 0.6% (83) | 0.5% (39) | 0.7% (44) |
| Machinery, equipment, and supplies merchant wholesalers | 0.6% (80) | 0.6% (51) | 0.5% (29) |
| Warehousing and storage | 0.5% (75) | 0.8% (68) | 0.1% (7) |
| Metal and metal products | 0.5% (74) | 0.7% (61) | 0.2% (13) |
| Plastics and rubber products | 0.4% (62) | 0.5% (40) | 0.3% (22) |
| Miscellaneous nondurable goods merchant wholesalers | 0.4% (61) | 0.6% (46) | 0.2% (15) |
| Fuel dealers | 0.4% (60) | 0.7% (60) | 0.0% (0) |
| Machinery | 0.4% (58) | 0.7% (58) | 0.0% (0) |
| Furniture and related product manufacturing | 0.4% (58) | 0.7% (55) | 0.0% (3) |
| Pharmacies and drug stores | 0.4% (56) | 0.4% (35) | 0.3% (21) |
| Radio, TV, and computer stores | 0.4% (55) | 0.2% (15) | 0.6% (40) |
| Utilities | 0.4% (55) | 0.7% (55) | 0.0% (0) |
| Miscellaneous durable goods merchant wholesalers | 0.3% (48) | 0.3% (21) | 0.4% (27) |
| Gasoline stations | 0.3% (44) | 0.1% (5) | 0.6% (39) |
| Transportation equipment | 0.3% (43) | 0.3% (24) | 0.3% (19) |
| Paper | 0.3% (40) | 0.4% (34) | 0.1% (6) |
| Nonmetallic mineral products | 0.2% (36) | 0.4% (36) | 0.0% (0) |
| U. S. Postal service | 0.2% (36) | 0.3% (25) | 0.2% (11) |
| Motor vehicles, parts and supplies merchant wholesalers | 0.2% (35) | 0.2% (20) | 0.2% (15) |
| Wood products | 0.2% (31) | 0.4% (31) | 0.0% (0) |
| Office supplies and stationery stores | 0.2% (28) | 0.3% (28) | 0.0% (0) |
| Metals and minerals, except petroleum, merchant wholesalers | 0.2% (28) | 0.3% (28) | 0.0% (0) |
| Electrical equipment, appliances, and components | 0.2% (26) | 0.2% (15) | 0.2% (11) |
| Music stores | 0.2% (25) | 0.3% (25) | 0.0% (0) |
| Apparel, fabrics, and notions merchant wholesalers | 0.2% (23) | 0.1% (9) | 0.2% (14) |
| Petroleum and petroleum products merchant wholesalers | 0.1% (21) | 0.3% (21) | 0.0% (0) |
| Textile mills and textile products | 0.1% (19) | 0.1% (11) | 0.1% (8) |
| Recyclable material merchant wholesalers | 0.1% (19) | 0.2% (19) | 0.0% (0) |
| Health and personal care, except drug, stores | 0.1% (18) | 0.0% (0) | 0.3% (18) |
| Furniture and home furnishing merchant wholesalers | 0.1% (18) | 0.2% (13) | 0.1% (5) |
| Jewelry, luggage, and leather goods stores | 0.1% (16) | 0.1% (7) | 0.1% (9) |
Unemployment in Pharr
- Unemployment by race in 2022
- Unemployment rate for White non-Hispanic residents
- 12.6%Males
- 1.0%Females
- Unemployment rate for American Indian and Alaska Native residents
- 35.6%Females
- Unemployment rate for other race residents
- 5.6%Males
- 9.3%Females
- Unemployment rate for two or more race residents
- 4.0%Males
- 7.1%Females
- Unemployment rate for Hispanic or Latino residents
- 3.9%Males
- 5.9%Females
- Unemployment by race in 2000
- Unemployment rate for White non-Hispanic residents
- 5.9%Males
- 2.1%Females
- Unemployment rate for American Indian and Alaska Native residents
- 29.2%Females
- Unemployment rate for other race residents
- 13.8%Males
- 14.6%Females
- Unemployment rate for two or more race residents
- 13.7%Males
- 28.3%Females
- Unemployment rate for Hispanic or Latino residents
- 10.4%Males
- 11.4%Females
Unemployment in 2023:
| Pharr: | 6.5% |
| Texas: | 3.5% |
Unemployment in 2022:
| Pharr: | 6.9% |
| Texas: | 3.9% |
Unemployment in 2021:
| Pharr: | 9.5% |
| Texas: | 5.6% |
Unemployment in 2020:
| Pharr: | 12.7% |
| Texas: | 7.7% |
Unemployment in 2019:
| Pharr: | 6.6% |
| Texas: | 3.5% |
Unemployment in 2018:
| Pharr: | 7.2% |
| Texas: | 3.9% |
Unemployment in 2017:
| Pharr: | 8.2% |
| Texas: | 4.3% |
Unemployment in 2016:
| Pharr: | 8.3% |
| Texas: | 4.6% |
Unemployment in 2015:
| Pharr: | 7.0% |
| Texas: | 4.5% |
Unemployment in 2014:
| Pharr: | 7.7% |
| Texas: | 5.2% |
Unemployment in 2013:
| Pharr: | 9.0% |
| Texas: | 6.3% |
Unemployment in 2012:
| Pharr: | 9.1% |
| Texas: | 6.7% |
Unemployment in 2011:
| Pharr: | 10.4% |
| Texas: | 8.0% |
Unemployment in 2010:
| Pharr: | 10.3% |
| Texas: | 8.2% |
Unemployment in 2009:
| Pharr: | 8.8% |
| Texas: | 7.5% |
Unemployment in 2008:
| Pharr: | 6.1% |
| Texas: | 4.9% |
Unemployment in 2007:
| Pharr: | 5.5% |
| Texas: | 4.4% |
Unemployment in 2006:
| Pharr: | 5.9% |
| Texas: | 5.0% |
Unemployment in 2005:
| Pharr: | 6.3% |
| Texas: | 5.5% |
Unemployment in 2004:
| Pharr: | 8.0% |
| Texas: | 6.0% |
Unemployment in 2003:
| Pharr: | 9.1% |
| Texas: | 6.7% |
Unemployment in 2002:
| Pharr: | 9.2% |
| Texas: | 6.3% |
Unemployment in 2001:
| Pharr: | 8.4% |
| Texas: | 5.0% |
Unemployment in 2000:
| Pharr: | 8.1% |
| Texas: | 4.4% |
Unemployment in 1999:
| Pharr: | 17.5% |
| Texas: | 4.7% |
Unemployment in 1998:
| Pharr: | 21.5% |
| Texas: | 5.0% |
Unemployment in 1997:
| Pharr: | 21.5% |
| Texas: | 5.4% |
Unemployment in 1996:
| Pharr: | 22.8% |
| Texas: | 5.8% |
Unemployment in 1995:
| Pharr: | 23.5% |
| Texas: | 6.1% |
Unemployment in 1994:
| Pharr: | 23.3% |
| Texas: | 6.6% |
Unemployment in 1993:
| Pharr: | 24.2% |
| Texas: | 7.2% |
Unemployment in 1992:
| Pharr: | 26.2% |
| Texas: | 7.7% |
Unemployment in 1991:
| Pharr: | 25.6% |
| Texas: | 7.0% |
Unemployment in 1990:
| Pharr: | 26.3% |
| Texas: | 6.4% |
Time leaving home to go to work

12:00 a.m. to 4:59 a.m.:
| Pharr: | 5.2% (1,526) |
| Texas: | 5.5% (678,264) |
5:00 a.m. to 5:29 a.m.:
| Pharr: | 2.7% (790) |
| Texas: | 4.3% (525,841) |
5:30 a.m. to 5:59 a.m.:
| Pharr: | 3.2% (941) |
| Texas: | 4.9% (603,953) |
6:00 a.m. to 6:29 a.m.:
| Pharr: | 6.1% (1,803) |
| Texas: | 9.4% (1,155,020) |
6:30 a.m. to 6:59 a.m.:
| Pharr: | 8.5% (2,516) |
| Texas: | 9.3% (1,152,822) |
7:00 a.m. to 7:29 a.m.:
| Pharr: | 14.7% (4,366) |
| Texas: | 15.3% (1,885,477) |
7:30 a.m. to 7:59 a.m.:
| Pharr: | 14.2% (4,194) |
| Texas: | 11.9% (1,469,628) |
8:00 a.m. to 8:29 a.m.:
| Pharr: | 14.8% (4,386) |
| Texas: | 11.3% (1,400,175) |
8:30 a.m. to 8:59 a.m.:
| Pharr: | 3.3% (988) |
| Texas: | 4.9% (599,574) |
9:00 a.m. to 9:59 a.m.:
| Pharr: | 8.2% (2,434) |
| Texas: | 6.7% (829,367) |
10:00 a.m. to 10:59 a.m.:
| Pharr: | 5.0% (1,487) |
| Texas: | 3.2% (390,354) |
11:00 a.m. to 11:59 a.m.:
| Pharr: | 2.9% (849) |
| Texas: | 1.3% (162,330) |
12:00 p.m. to 3:59 p.m.:
| Pharr: | 5.5% (1,637) |
| Texas: | 5.8% (720,594) |
4:00 p.m. to 11:59 p.m.:
| Pharr: | 5.7% (1,698) |
| Texas: | 6.3% (777,072) |

<5am:
| Pharr: | 3.1% (438) |
| Texas: | 3.1% (281,361) |
5:30am:
| Pharr: | 1.1% (156) |
| Texas: | 2.9% (262,060) |
6am:
| Pharr: | 2.7% (380) |
| Texas: | 4.4% (403,423) |
6:30am:
| Pharr: | 6.0% (847) |
| Texas: | 8.8% (808,876) |
7am:
| Pharr: | 8.5% (1,209) |
| Texas: | 10.7% (976,557) |
7:30am:
| Pharr: | 16.4% (2,316) |
| Texas: | 16.4% (1,500,904) |
8am:
| Pharr: | 20.0% (2,826) |
| Texas: | 16.8% (1,536,308) |
8:30am:
| Pharr: | 13.1% (1,848) |
| Texas: | 10.0% (913,601) |
9am:
| Pharr: | 3.7% (518) |
| Texas: | 4.4% (398,656) |
10am:
| Pharr: | 6.3% (889) |
| Texas: | 5.2% (472,592) |
11am:
| Pharr: | 2.9% (416) |
| Texas: | 2.2% (197,844) |
12pm:
| Pharr: | 1.5% (219) |
| Texas: | 0.9% (86,997) |
4pm:
| Pharr: | 6.6% (940) |
| Texas: | 5.5% (503,565) |
>4pm:
| Pharr: | 6.2% (882) |
| Texas: | 6.1% (563,107) |

12:00 a.m. to 4:59 a.m. - Males:
| Pharr: | 6.0% (994) |
| Texas: | 7.0% (477,284) |
5:00 a.m. to 5:29 a.m. - Males:
| Pharr: | 3.1% (511) |
| Texas: | 5.8% (394,876) |
5:30 a.m. to 5:59 a.m. - Males:
| Pharr: | 4.6% (772) |
| Texas: | 5.9% (402,788) |
6:00 a.m. to 6:29 a.m. - Males:
| Pharr: | 9.4% (1,556) |
| Texas: | 10.9% (751,118) |
6:30 a.m. to 6:59 a.m. - Males:
| Pharr: | 7.6% (1,266) |
| Texas: | 9.5% (652,306) |
7:00 a.m. to 7:29 a.m. - Males:
| Pharr: | 11.8% (1,969) |
| Texas: | 14.1% (970,598) |
7:30 a.m. to 7:59 a.m. - Males:
| Pharr: | 12.2% (2,035) |
| Texas: | 10.2% (696,429) |
8:00 a.m. to 8:29 a.m. - Males:
| Pharr: | 15.7% (2,609) |
| Texas: | 10.6% (729,041) |
8:30 a.m. to 8:59 a.m. - Males:
| Pharr: | 4.2% (705) |
| Texas: | 4.1% (281,762) |
9:00 a.m. to 9:59 a.m. - Males:
| Pharr: | 4.1% (686) |
| Texas: | 5.8% (401,071) |
10:00 a.m. to 10:59 a.m. - Males:
| Pharr: | 5.2% (868) |
| Texas: | 2.7% (186,469) |
11:00 a.m. to 11:59 a.m. - Males:
| Pharr: | 3.6% (607) |
| Texas: | 1.2% (82,242) |
12:00 p.m. to 3:59 p.m. - Males:
| Pharr: | 3.3% (553) |
| Texas: | 5.8% (397,795) |
4:00 p.m. to 11:59 p.m. - Males:
| Pharr: | 9.1% (1,506) |
| Texas: | 6.4% (435,950) |

12:00 a.m. to 4:59 a.m. - Females:
| Pharr: | 4.1% (532) |
| Texas: | 3.7% (200,980) |
5:00 a.m. to 5:29 a.m. - Females:
| Pharr: | 2.1% (279) |
| Texas: | 2.4% (130,965) |
5:30 a.m. to 5:59 a.m. - Females:
| Pharr: | 1.3% (169) |
| Texas: | 3.7% (201,165) |
6:00 a.m. to 6:29 a.m. - Females:
| Pharr: | 1.9% (247) |
| Texas: | 7.4% (403,902) |
6:30 a.m. to 6:59 a.m. - Females:
| Pharr: | 9.6% (1,250) |
| Texas: | 9.1% (500,516) |
7:00 a.m. to 7:29 a.m. - Females:
| Pharr: | 18.5% (2,397) |
| Texas: | 16.7% (914,879) |
7:30 a.m. to 7:59 a.m. - Females:
| Pharr: | 16.6% (2,159) |
| Texas: | 14.1% (773,199) |
8:00 a.m. to 8:29 a.m. - Females:
| Pharr: | 13.7% (1,777) |
| Texas: | 12.2% (671,134) |
8:30 a.m. to 8:59 a.m. - Females:
| Pharr: | 2.2% (283) |
| Texas: | 5.8% (317,812) |
9:00 a.m. to 9:59 a.m. - Females:
| Pharr: | 13.5% (1,748) |
| Texas: | 7.8% (428,296) |
10:00 a.m. to 10:59 a.m. - Females:
| Pharr: | 4.8% (619) |
| Texas: | 3.7% (203,885) |
11:00 a.m. to 11:59 a.m. - Females:
| Pharr: | 1.9% (242) |
| Texas: | 1.5% (80,088) |
12:00 p.m. to 3:59 p.m. - Females:
| Pharr: | 8.4% (1,084) |
| Texas: | 5.9% (322,799) |
4:00 p.m. to 11:59 p.m. - Females:
| Pharr: | 1.5% (192) |
| Texas: | 6.2% (341,122) |
Travel time to work
Percentage of workers working in this county: 90.8%
Number of people working at home: 2,189 (6.7% of all workers)
Daytime population change due to commuting: +1,260 (+2.7%)
Workers who live and work in this city: 4,271 (30.2%)
Number of people working at home: 2,189 (6.7% of all workers)
Daytime population change due to commuting: +1,260 (+2.7%)
Workers who live and work in this city: 4,271 (30.2%)

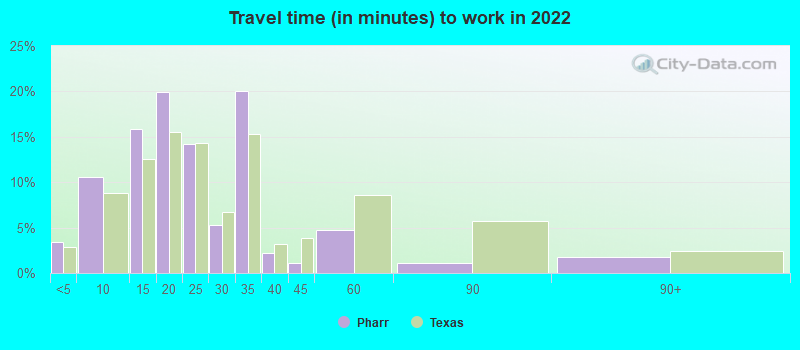

Less than 5 minutes:
| Pharr: | 3.4% (1,009) |
| Texas: | 2.8% (350,462) |
5 to 9 minutes:
| Pharr: | 10.6% (3,166) |
| Texas: | 8.8% (1,087,762) |
10 to 14 minutes:
| Pharr: | 15.8% (4,745) |
| Texas: | 12.6% (1,550,271) |
15 to 19 minutes:
| Pharr: | 19.9% (5,969) |
| Texas: | 15.6% (1,918,353) |
20 to 24 minutes:
| Pharr: | 14.2% (4,258) |
| Texas: | 14.4% (1,772,079) |
25 to 29 minutes:
| Pharr: | 5.3% (1,576) |
| Texas: | 6.7% (827,833) |
30 to 34 minutes:
| Pharr: | 20.0% (6,000) |
| Texas: | 15.3% (1,887,878) |
35 to 39 minutes:
| Pharr: | 2.2% (661) |
| Texas: | 3.2% (394,170) |
40 to 44 minutes:
| Pharr: | 1.0% (314) |
| Texas: | 3.9% (476,118) |
45 to 59 minutes:
| Pharr: | 4.8% (1,437) |
| Texas: | 8.6% (1,058,376) |
60 to 89 minutes:
| Pharr: | 1.2% (346) |
| Texas: | 5.7% (706,002) |
90 or more minutes:
| Pharr: | 1.8% (527) |
| Texas: | 2.4% (299,884) |


Less than 5 minutes:
| Pharr: | 2.3% (332) |
| Texas: | 3.0% (277,642) |
5 to 9 minutes:
| Pharr: | 11.9% (1,683) |
| Texas: | 10.3% (942,891) |
10 to 14 minutes:
| Pharr: | 18.5% (2,615) |
| Texas: | 14.4% (1,317,555) |
15 to 19 minutes:
| Pharr: | 25.4% (3,597) |
| Texas: | 16.0% (1,467,945) |
20 to 24 minutes:
| Pharr: | 16.3% (2,311) |
| Texas: | 13.9% (1,276,781) |
25 to 29 minutes:
| Pharr: | 4.3% (611) |
| Texas: | 5.3% (482,838) |
30 to 34 minutes:
| Pharr: | 12.8% (1,815) |
| Texas: | 14.3% (1,309,699) |
35 to 39 minutes:
| Pharr: | 0.7% (104) |
| Texas: | 2.4% (219,873) |
40 to 44 minutes:
| Pharr: | 1.0% (137) |
| Texas: | 3.1% (280,916) |
45 to 59 minutes:
| Pharr: | 1.8% (253) |
| Texas: | 7.6% (692,006) |
60 to 89 minutes:
| Pharr: | 1.4% (195) |
| Texas: | 4.6% (418,905) |
90 or more minutes:
| Pharr: | 1.6% (231) |
| Texas: | 2.4% (218,800) |

Less than 5 minutes - Males:
| Pharr: | 2.1% (331) |
| Texas: | 2.7% (181,937) |
5 to 9 minutes - Males:
| Pharr: | 6.2% (975) |
| Texas: | 7.6% (522,166) |
10 to 14 minutes - Males:
| Pharr: | 15.0% (2,371) |
| Texas: | 11.5% (785,572) |
15 to 19 minutes - Males:
| Pharr: | 15.3% (2,406) |
| Texas: | 14.6% (1,001,179) |
20 to 24 minutes - Males:
| Pharr: | 16.5% (2,597) |
| Texas: | 13.9% (950,043) |
25 to 29 minutes - Males:
| Pharr: | 8.1% (1,273) |
| Texas: | 6.7% (457,259) |
30 to 34 minutes - Males:
| Pharr: | 25.1% (3,953) |
| Texas: | 16.2% (1,110,357) |
35 to 39 minutes - Males:
| Pharr: | 3.8% (594) |
| Texas: | 3.3% (223,512) |
40 to 44 minutes - Males:
| Pharr: | 0.9% (139) |
| Texas: | 4.2% (289,434) |
45 to 59 minutes - Males:
| Pharr: | 6.4% (1,002) |
| Texas: | 9.3% (639,122) |
90 or more minutes - Males:
| Pharr: | 0.8% (120) |
| Texas: | 3.1% (211,313) |

Less than 5 minutes - Females:
| Pharr: | 4.8% (678) |
| Texas: | 3.1% (168,525) |
5 to 9 minutes - Females:
| Pharr: | 15.4% (2,191) |
| Texas: | 10.3% (565,596) |
10 to 14 minutes - Females:
| Pharr: | 16.7% (2,374) |
| Texas: | 13.9% (764,699) |
15 to 19 minutes - Females:
| Pharr: | 25.0% (3,563) |
| Texas: | 16.7% (917,174) |
20 to 24 minutes - Females:
| Pharr: | 11.7% (1,661) |
| Texas: | 15.0% (822,036) |
25 to 29 minutes - Females:
| Pharr: | 2.1% (303) |
| Texas: | 6.7% (370,574) |
30 to 34 minutes - Females:
| Pharr: | 14.4% (2,047) |
| Texas: | 14.2% (777,521) |
35 to 39 minutes - Females:
| Pharr: | 0.5% (67) |
| Texas: | 3.1% (170,658) |
40 to 44 minutes - Females:
| Pharr: | 1.2% (175) |
| Texas: | 3.4% (186,684) |
45 to 59 minutes - Females:
| Pharr: | 3.1% (435) |
| Texas: | 7.6% (419,254) |
60 to 89 minutes - Females:
| Pharr: | 2.4% (346) |
| Texas: | 4.4% (238,848) |
90 or more minutes - Females:
| Pharr: | 2.9% (407) |
| Texas: | 1.6% (88,571) |
Means of transportation to work
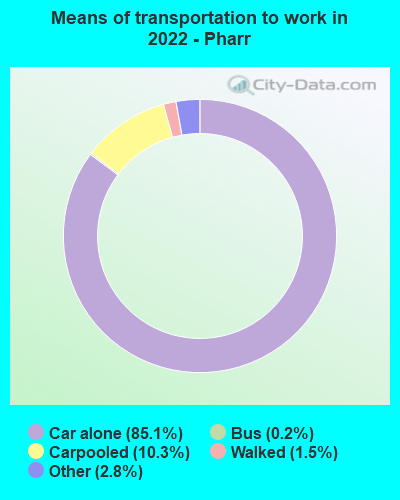

Drove car alone:
| Pharr: | 85.1% (24,496) |
| Texas: | 83.3% (4,557,023) |
Carpooled:
| Pharr: | 10.3% (2,978) |
| Texas: | 11.7% (674,818) |
Bus:
| Pharr: | 0.2% (62) |
| Texas: | 0.9% (50,435) |
Subway or elevated rail:
| Pharr: | 0.1% (20) |
| Texas: | 0.0% (992) |
Walked:
| Pharr: | 1.5% (435) |
| Texas: | 1.7% (99,911) |
Other means:
| Pharr: | 2.8% (809) |
| Texas: | 2.0% (95,481) |


Drove car alone:
| Pharr: | 73.0% (10,326) |
| Texas: | 77.7% (7,115,590) |
Carpooled:
| Pharr: | 19.8% (2,807) |
| Texas: | 14.5% (1,326,012) |
Bus or trolley bus:
| Pharr: | 0.1% (19) |
| Texas: | 1.7% (157,014) |
Streetcar or trolley car:
| Pharr: | 0.3% (43) |
| Texas: | 0.0% (1,669) |
Taxicab:
| Pharr: | 0.3% (45) |
| Texas: | 0.1% (6,102) |
Motorcycle:
| Pharr: | 0.1% (10) |
| Texas: | 0.1% (12,068) |
Bicycle:
| Pharr: | 0.2% (35) |
| Texas: | 0.2% (21,551) |
Walked:
| Pharr: | 1.4% (205) |
| Texas: | 1.9% (173,670) |
Other means:
| Pharr: | 2.8% (394) |
| Texas: | 0.9% (86,692) |


Drove car alone - Males:
| Pharr: | 87.7% (14,064) |
| Texas: | 83.6% (4,557,023) |
Carpooled - Males:
| Pharr: | 7.6% (1,212) |
| Texas: | 11.2% (674,818) |
Bus - Males:
| Pharr: | 0.2% (26) |
| Texas: | 0.8% (50,435) |
Subway or elevated rail - Males:
| Pharr: | 0.1% (20) |
| Texas: | 0.0% (992) |
Walked - Males:
| Pharr: | 1.3% (208) |
| Texas: | 1.7% (99,911) |
Other means - Males:
| Pharr: | 3.1% (505) |
| Texas: | 2.2% (95,481) |


Drove car alone - Females:
| Pharr: | 81.5% (10,370) |
| Texas: | 83.0% (4,557,023) |
Carpooled - Females:
| Pharr: | 14.0% (1,783) |
| Texas: | 12.3% (674,818) |
Bus - Females:
| Pharr: | 0.3% (37) |
| Texas: | 0.9% (50,435) |
Walked - Females:
| Pharr: | 1.8% (228) |
| Texas: | 1.8% (99,911) |
Other means - Females:
| Pharr: | 2.4% (300) |
| Texas: | 1.7% (95,481) |
Private vehicle occupancy

Drove alone:
| Pharr: | 87.2% (24,817) |
| Texas: | 87.6% (10,283,021) |
In 2 person carpool:
| Pharr: | 7.0% (1,980) |
| Texas: | 9.0% (1,052,595) |
In 3 person carpool:
| Pharr: | 3.0% (858) |
| Texas: | 2.1% (244,139) |
In 4 person carpool:
| Pharr: | 2.0% (577) |
| Texas: | 0.8% (92,732) |
In 5-6 person carpool:
| Pharr: | 0.2% (52) |
| Texas: | 0.4% (44,947) |
In 7+ person carpool:
| Pharr: | 0.2% (48) |
| Texas: | 0.1% (16,725) |

Drove alone:
| Pharr: | 78.6% (10,326) |
| Texas: | 84.3% (7,115,590) |
In 2 person carpool:
| Pharr: | 16.1% (2,111) |
| Texas: | 11.6% (982,994) |
In 3 person carpool:
| Pharr: | 2.7% (351) |
| Texas: | 2.4% (201,602) |
In 4 person carpool:
| Pharr: | 1.6% (212) |
| Texas: | 1.0% (83,518) |
In 5-6 person carpool:
| Pharr: | 1.0% (128) |
| Texas: | 0.5% (40,662) |
In 7+ person carpool:
| Pharr: | 0.0% (5) |
| Texas: | 0.2% (17,236) |
Class of workers

Employee of private company:
| Pharr: | 69.2% (23,112) |
| Texas: | 69.6% (10,139,666) |
Self-employed in own incorporated business:
| Pharr: | 3.4% (1,124) |
| Texas: | 3.5% (516,446) |
Private not-for-profit wage and salary workers:
| Pharr: | 4.4% (1,476) |
| Texas: | 6.0% (870,454) |
Local government workers:
| Pharr: | 5.5% (1,846) |
| Texas: | 7.6% (1,109,799) |
State government workers:
| Pharr: | 7.1% (2,379) |
| Texas: | 3.8% (558,618) |
Federal government workers:
| Pharr: | 1.5% (501) |
| Texas: | 2.5% (357,298) |
Self-employed workers in own not incorporated business:
| Pharr: | 8.7% (2,901) |
| Texas: | 6.8% (998,270) |
Unpaid family workers:
| Pharr: | 0.2% (80) |
| Texas: | 0.2% (27,882) |

Employee of private company:
| Pharr: | 67.7% (9,824) |
| Texas: | 69.6% (6,425,274) |
Self-employed in own incorporated business:
| Pharr: | 2.4% (355) |
| Texas: | 2.7% (250,864) |
Private not-for-profit wage and salary workers:
| Pharr: | 3.5% (503) |
| Texas: | 5.7% (526,631) |
Local government workers:
| Pharr: | 7.4% (1,067) |
| Texas: | 6.6% (608,479) |
State government workers:
| Pharr: | 8.0% (1,159) |
| Texas: | 5.4% (501,082) |
Federal government workers:
| Pharr: | 2.0% (297) |
| Texas: | 2.6% (237,177) |
Self-employed workers in own not incorporated business:
| Pharr: | 8.8% (1,276) |
| Texas: | 7.1% (653,527) |
Unpaid family workers:
| Pharr: | 0.2% (28) |
| Texas: | 0.3% (31,338) |

Employee of private company - Males:
| Pharr: | 73.1% (13,087) |
| Texas: | 73.1% (5,788,450) |
Self-employed in own incorporated business - Males:
| Pharr: | 5.4% (964) |
| Texas: | 4.2% (332,655) |
Private not-for-profit wage and salary workers - Males:
| Pharr: | 3.6% (646) |
| Texas: | 4.1% (323,476) |
Local government workers - Males:
| Pharr: | 6.5% (1,166) |
| Texas: | 5.1% (405,467) |
State government workers - Males:
| Pharr: | 1.8% (328) |
| Texas: | 3.0% (236,706) |
Federal government workers - Males:
| Pharr: | 1.9% (336) |
| Texas: | 2.7% (211,629) |
Self-employed workers in own not incorporated business - Males:
| Pharr: | 7.3% (1,301) |
| Texas: | 7.7% (609,246) |
Unpaid family workers - Males:
| Pharr: | 0.4% (80) |
| Texas: | 0.2% (12,606) |

Employee of private company - Females:
| Pharr: | 64.6% (10,025) |
| Texas: | 65.4% (4,351,216) |
Self-employed in own incorporated business - Females:
| Pharr: | 1.0% (160) |
| Texas: | 2.8% (183,791) |
Private not-for-profit wage and salary workers - Females:
| Pharr: | 5.4% (830) |
| Texas: | 8.2% (546,978) |
Local government workers - Females:
| Pharr: | 4.4% (680) |
| Texas: | 10.6% (704,332) |
State government workers - Females:
| Pharr: | 13.2% (2,051) |
| Texas: | 4.8% (321,912) |
Federal government workers - Females:
| Pharr: | 1.1% (165) |
| Texas: | 2.2% (145,669) |
Self-employed workers in own not incorporated business - Females:
| Pharr: | 10.3% (1,600) |
| Texas: | 5.8% (389,024) |