Work and Jobs in Seneca, South Carolina (SC) Detailed Stats
Occupations, Industries, Unemployment, Workers, Commute
Settings
X


Recent posts about work in Seneca, South Carolina on our local forum with over 2,400,000 registered users:
 | South Carolina’s Employment Situation, Month to Month: Dept. of Employment & Workforce (313 replies) |
| Walhalla, Westminster, or Seneca (5 replies) |
| BorgWarner to add 105 jobs in Seneca. (0 replies) |
| Retirement to Clemson area? (17 replies) |
| Which town or area is the best kept secret in SC? (51 replies) |
| 2,000 new jobs coming to Greenville County? (88 replies) |
Latest news about work in Seneca, SC collected exclusively by city-data.com from local newspapers, TV, and radio stations
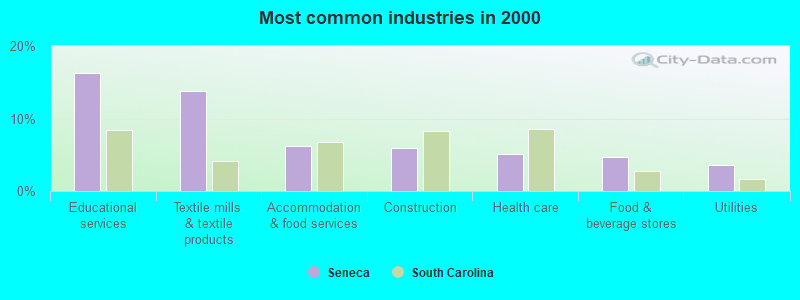
The most common industries in Seneca are: Educational services (16.3% of civilian employees), Textile mills & textile products (13.7% of civilian employees), Accommodation & food services (6.2% of civilian employees). 66.0% of workers work in Oconee County and 2.4% of all workers work at home. 71.5% of workers are employees of private companies, which is 5.7% greater than the rate of 67.4% across the entire state of South Carolina.
Whole page based on the data from 2000 / 2022 when the population of Seneca, South Carolina was 7,652 / 8,992
Whole page based on the data from 2000 / 2022 when the population of Seneca, South Carolina was 7,652 / 8,992
Most common industries
Most common industries | |||
|---|---|---|---|
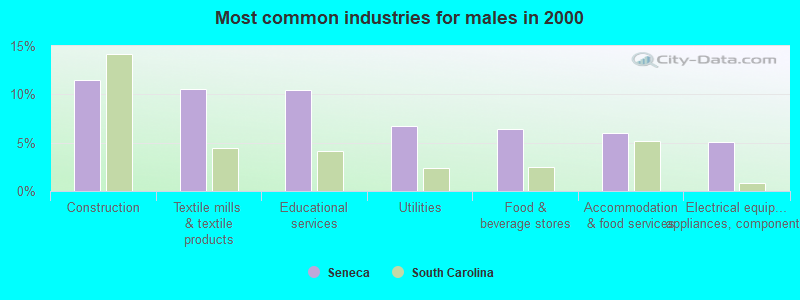
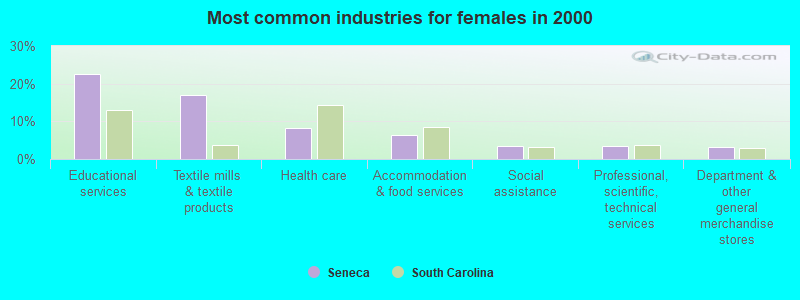
Industry | All | Males | Females |
| Educational services | 16.3% (613) | 10.5% (203) | 22.5% (410) |
| Textile mills and textile products | 13.7% (517) | 10.6% (205) | 17.1% (312) |
| Accommodation and food services | 6.2% (234) | 6.0% (117) | 6.4% (117) |
| Construction | 5.9% (223) | 11.5% (223) | 0.0% (0) |
| Health care | 5.1% (191) | 2.2% (42) | 8.2% (149) |
| Food and beverage stores | 4.6% (174) | 6.4% (125) | 2.7% (49) |
| Utilities | 3.6% (136) | 6.7% (130) | 0.3% (6) |
| Electrical equipment, appliances, and components | 3.6% (136) | 5.1% (99) | 2.0% (37) |
| Religious, grantmaking, civic, professional, and similar organizations | 2.8% (104) | 3.1% (61) | 2.4% (43) |
| Administrative and support and waste management services | 2.7% (101) | 2.8% (55) | 2.5% (46) |
| Public administration | 2.6% (98) | 2.5% (49) | 2.7% (49) |
| Professional, scientific, and technical services | 2.2% (83) | 1.1% (21) | 3.4% (62) |
| Motor vehicle and parts dealers | 2.0% (77) | 3.0% (58) | 1.0% (19) |
| Metal and metal products | 2.0% (75) | 1.5% (30) | 2.5% (45) |
| Social assistance | 1.9% (70) | 0.4% (8) | 3.4% (62) |
| Plastics and rubber products | 1.8% (69) | 1.3% (25) | 2.4% (44) |
| Department and other general merchandise stores | 1.7% (65) | 0.3% (6) | 3.2% (59) |
| Miscellaneous manufacturing | 1.6% (62) | 0.8% (15) | 2.6% (47) |
| Machinery | 1.5% (57) | 2.1% (41) | 0.9% (16) |
| Transportation equipment | 1.5% (55) | 1.4% (28) | 1.5% (27) |
| Arts, entertainment, and recreation | 1.4% (54) | 0.8% (16) | 2.1% (38) |
| Chemicals | 1.3% (50) | 2.1% (41) | 0.5% (9) |
| Personal and laundry services | 1.3% (49) | 0.8% (15) | 1.9% (34) |
| Repair and maintenance | 1.1% (40) | 2.1% (40) | 0.0% (0) |
| Finance and insurance | 0.9% (35) | 0.7% (13) | 1.2% (22) |
| Truck transportation | 0.7% (27) | 1.4% (27) | 0.0% (0) |
| Real estate and rental and leasing | 0.7% (25) | 0.7% (14) | 0.6% (11) |
| Nonmetallic mineral products | 0.6% (24) | 1.2% (24) | 0.0% (0) |
| Pharmacies and drug stores | 0.6% (23) | 0.5% (9) | 0.8% (14) |
| Food | 0.5% (20) | 1.0% (20) | 0.0% (0) |
| U. S. Postal service | 0.5% (20) | 0.7% (13) | 0.4% (7) |
| Furniture and home furnishings, and household appliance stores | 0.5% (20) | 0.0% (0) | 1.1% (20) |
| Agriculture, forestry, fishing and hunting | 0.5% (19) | 1.0% (19) | 0.0% (0) |
| Building material and garden equipment and supplies dealers | 0.5% (19) | 1.0% (19) | 0.0% (0) |
| Private households | 0.5% (18) | 0.0% (0) | 1.0% (18) |
| Petroleum and petroleum products merchant wholesalers | 0.5% (17) | 0.9% (17) | 0.0% (0) |
| Apparel | 0.4% (14) | 0.0% (0) | 0.8% (14) |
| Broadcasting and telecommunications | 0.3% (12) | 0.6% (12) | 0.0% (0) |
| Printing and related support activities | 0.3% (11) | 0.6% (11) | 0.0% (0) |
| Radio, TV, and computer stores | 0.3% (11) | 0.6% (11) | 0.0% (0) |
| Sporting goods, camera, and hobby and toy stores | 0.3% (11) | 0.6% (11) | 0.0% (0) |
| Other direct selling establishments | 0.3% (11) | 0.0% (0) | 0.6% (11) |
| Jewelry, luggage, and leather goods stores | 0.3% (10) | 0.3% (6) | 0.2% (4) |
| Machinery, equipment, and supplies merchant wholesalers | 0.3% (10) | 0.5% (10) | 0.0% (0) |
| Publishing, and motion picture and sound recording industries | 0.2% (9) | 0.3% (5) | 0.2% (4) |
| Music stores | 0.2% (8) | 0.4% (8) | 0.0% (0) |
| Computer and electronic products | 0.2% (8) | 0.4% (8) | 0.0% (0) |
| Furniture and home furnishing merchant wholesalers | 0.2% (8) | 0.4% (8) | 0.0% (0) |
| Other transportation, and support activities, and couriers | 0.2% (8) | 0.4% (8) | 0.0% (0) |
| Lumber and other construction materials merchant wholesalers | 0.2% (8) | 0.4% (8) | 0.0% (0) |
| Retail florists | 0.2% (7) | 0.0% (0) | 0.4% (7) |
| Management of companies and enterprises | 0.2% (7) | 0.0% (0) | 0.4% (7) |
| Wood products | 0.2% (6) | 0.3% (6) | 0.0% (0) |
| Clothing and accessories, including shoe, stores | 0.1% (5) | 0.0% (0) | 0.3% (5) |
Unemployment in Seneca
- Unemployment by race in 2022
- Unemployment rate for White non-Hispanic residents
- 8.8%Males
- 2.8%Females
- Unemployment rate for two or more race residents
- 96.2%Females
- Unemployment rate for Hispanic or Latino residents
- 84.0%Females
- Unemployment by race in 2000
- Unemployment rate for White non-Hispanic residents
- 4.3%Males
- 3.6%Females
- Unemployment rate for Black residents
- 3.2%Males
- 4.0%Females
- Unemployment rate for two or more race residents
- 20.9%Females
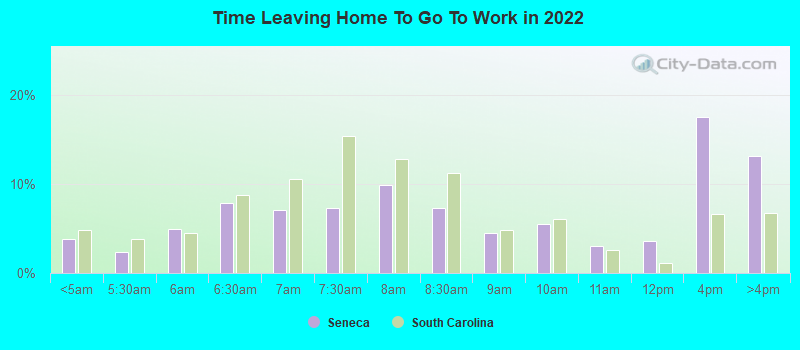
Time leaving home to go to work
12:00 a.m. to 4:59 a.m.:
| Seneca: | 3.8% (149) |
| South Carolina: | 4.9% (105,233) |
5:00 a.m. to 5:29 a.m.:
| Seneca: | 2.4% (95) |
| South Carolina: | 3.8% (81,991) |
5:30 a.m. to 5:59 a.m.:
| Seneca: | 4.9% (195) |
| South Carolina: | 4.5% (97,139) |
6:00 a.m. to 6:29 a.m.:
| Seneca: | 7.9% (312) |
| South Carolina: | 8.8% (190,089) |
6:30 a.m. to 6:59 a.m.:
| Seneca: | 7.0% (278) |
| South Carolina: | 10.6% (229,373) |
7:00 a.m. to 7:29 a.m.:
| Seneca: | 7.3% (287) |
| South Carolina: | 15.4% (332,988) |
7:30 a.m. to 7:59 a.m.:
| Seneca: | 9.9% (390) |
| South Carolina: | 12.9% (278,683) |
8:00 a.m. to 8:29 a.m.:
| Seneca: | 7.3% (287) |
| South Carolina: | 11.2% (243,383) |
8:30 a.m. to 8:59 a.m.:
| Seneca: | 4.5% (179) |
| South Carolina: | 4.8% (104,578) |
9:00 a.m. to 9:59 a.m.:
| Seneca: | 5.5% (219) |
| South Carolina: | 6.1% (132,620) |
10:00 a.m. to 10:59 a.m.:
| Seneca: | 3.1% (121) |
| South Carolina: | 2.6% (57,150) |
11:00 a.m. to 11:59 a.m.:
| Seneca: | 3.6% (143) |
| South Carolina: | 1.1% (23,839) |
12:00 p.m. to 3:59 p.m.:
| Seneca: | 17.6% (693) |
| South Carolina: | 6.6% (143,789) |
4:00 p.m. to 11:59 p.m.:
| Seneca: | 13.1% (518) |
| South Carolina: | 6.8% (147,267) |

<5am:
| Seneca: | 3.4% (125) |
| South Carolina: | 2.9% (52,042) |
5:30am:
| Seneca: | 1.2% (43) |
| South Carolina: | 2.4% (44,320) |
6am:
| Seneca: | 3.7% (137) |
| South Carolina: | 3.8% (68,753) |
6:30am:
| Seneca: | 6.1% (224) |
| South Carolina: | 8.4% (153,907) |
7am:
| Seneca: | 14.1% (519) |
| South Carolina: | 11.5% (210,295) |
7:30am:
| Seneca: | 15.0% (553) |
| South Carolina: | 15.9% (289,937) |
8am:
| Seneca: | 15.9% (586) |
| South Carolina: | 16.7% (305,268) |
8:30am:
| Seneca: | 7.3% (270) |
| South Carolina: | 10.4% (189,373) |
9am:
| Seneca: | 5.0% (184) |
| South Carolina: | 4.5% (82,760) |
10am:
| Seneca: | 3.2% (117) |
| South Carolina: | 4.6% (83,870) |
11am:
| Seneca: | 3.0% (111) |
| South Carolina: | 1.8% (32,177) |
12pm:
| Seneca: | 0.5% (18) |
| South Carolina: | 0.8% (15,242) |
4pm:
| Seneca: | 10.4% (384) |
| South Carolina: | 6.4% (116,272) |
>4pm:
| Seneca: | 10.4% (385) |
| South Carolina: | 7.7% (140,518) |

12:00 a.m. to 4:59 a.m. - Males:
| Seneca: | 3.4% (69) |
| South Carolina: | 6.1% (70,185) |
5:00 a.m. to 5:29 a.m. - Males:
| Seneca: | 2.9% (58) |
| South Carolina: | 5.2% (59,137) |
5:30 a.m. to 5:59 a.m. - Males:
| Seneca: | 6.4% (131) |
| South Carolina: | 5.4% (61,760) |
6:00 a.m. to 6:29 a.m. - Males:
| Seneca: | 12.2% (250) |
| South Carolina: | 10.2% (116,984) |
6:30 a.m. to 6:59 a.m. - Males:
| Seneca: | 8.0% (163) |
| South Carolina: | 10.5% (120,095) |
7:00 a.m. to 7:29 a.m. - Males:
| Seneca: | 3.6% (74) |
| South Carolina: | 14.6% (166,712) |
7:30 a.m. to 7:59 a.m. - Males:
| Seneca: | 8.9% (183) |
| South Carolina: | 12.0% (137,813) |
8:00 a.m. to 8:29 a.m. - Males:
| Seneca: | 5.9% (121) |
| South Carolina: | 10.8% (123,437) |
8:30 a.m. to 8:59 a.m. - Males:
| Seneca: | 2.1% (42) |
| South Carolina: | 3.8% (43,279) |
9:00 a.m. to 9:59 a.m. - Males:
| Seneca: | 5.4% (110) |
| South Carolina: | 5.4% (62,207) |
10:00 a.m. to 10:59 a.m. - Males:
| Seneca: | 2.9% (60) |
| South Carolina: | 2.1% (23,901) |
12:00 p.m. to 3:59 p.m. - Males:
| Seneca: | 34.8% (712) |
| South Carolina: | 6.4% (72,956) |
4:00 p.m. to 11:59 p.m. - Males:
| Seneca: | 9.4% (193) |
| South Carolina: | 6.8% (77,615) |

12:00 a.m. to 4:59 a.m. - Females:
| Seneca: | 2.6% (50) |
| South Carolina: | 3.4% (35,048) |
5:00 a.m. to 5:29 a.m. - Females:
| Seneca: | 1.9% (37) |
| South Carolina: | 2.2% (22,854) |
5:30 a.m. to 5:59 a.m. - Females:
| Seneca: | 3.3% (62) |
| South Carolina: | 3.5% (35,379) |
6:00 a.m. to 6:29 a.m. - Females:
| Seneca: | 4.0% (76) |
| South Carolina: | 7.1% (73,105) |
6:30 a.m. to 6:59 a.m. - Females:
| Seneca: | 5.8% (109) |
| South Carolina: | 10.7% (109,278) |
7:00 a.m. to 7:29 a.m. - Females:
| Seneca: | 10.3% (196) |
| South Carolina: | 16.3% (166,276) |
7:30 a.m. to 7:59 a.m. - Females:
| Seneca: | 10.8% (205) |
| South Carolina: | 13.8% (140,870) |
8:00 a.m. to 8:29 a.m. - Females:
| Seneca: | 8.7% (164) |
| South Carolina: | 11.7% (119,946) |
8:30 a.m. to 8:59 a.m. - Females:
| Seneca: | 7.9% (149) |
| South Carolina: | 6.0% (61,299) |
9:00 a.m. to 9:59 a.m. - Females:
| Seneca: | 5.8% (110) |
| South Carolina: | 6.9% (70,413) |
10:00 a.m. to 10:59 a.m. - Females:
| Seneca: | 2.9% (54) |
| South Carolina: | 3.3% (33,249) |
11:00 a.m. to 11:59 a.m. - Females:
| Seneca: | 3.6% (69) |
| South Carolina: | 1.4% (14,503) |
12:00 p.m. to 3:59 p.m. - Females:
| Seneca: | 4.0% (75) |
| South Carolina: | 6.9% (70,833) |
4:00 p.m. to 11:59 p.m. - Females:
| Seneca: | 26.3% (499) |
| South Carolina: | 6.8% (69,652) |
Travel time to work
Percentage of workers working in this county: 66.0%
Number of people working at home: 98 (2.4% of all workers)
Daytime population change due to commuting: +1,094 (+14.3%)
Workers who live and work in this city: 889 (24.1%)
Number of people working at home: 98 (2.4% of all workers)
Daytime population change due to commuting: +1,094 (+14.3%)
Workers who live and work in this city: 889 (24.1%)

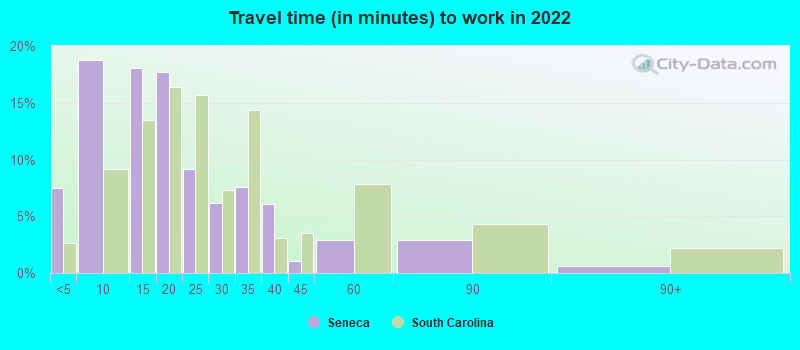

Less than 5 minutes:
| Seneca: | 7.5% (296) |
| South Carolina: | 2.7% (56,689) |
5 to 9 minutes:
| Seneca: | 18.7% (738) |
| South Carolina: | 9.2% (194,276) |
10 to 14 minutes:
| Seneca: | 18.1% (713) |
| South Carolina: | 13.5% (286,106) |
15 to 19 minutes:
| Seneca: | 17.7% (697) |
| South Carolina: | 16.4% (347,044) |
20 to 24 minutes:
| Seneca: | 9.2% (362) |
| South Carolina: | 15.7% (332,129) |
25 to 29 minutes:
| Seneca: | 6.2% (243) |
| South Carolina: | 7.3% (155,246) |
30 to 34 minutes:
| Seneca: | 7.6% (300) |
| South Carolina: | 14.4% (304,383) |
35 to 39 minutes:
| Seneca: | 6.0% (238) |
| South Carolina: | 3.0% (64,514) |
40 to 44 minutes:
| Seneca: | 1.1% (42) |
| South Carolina: | 3.5% (75,202) |
45 to 59 minutes:
| Seneca: | 2.9% (114) |
| South Carolina: | 7.8% (165,782) |
60 to 89 minutes:
| Seneca: | 2.9% (116) |
| South Carolina: | 4.3% (90,983) |
90 or more minutes:
| Seneca: | 0.6% (23) |
| South Carolina: | 2.2% (46,286) |


Less than 5 minutes:
| Seneca: | 5.0% (185) |
| South Carolina: | 3.0% (53,890) |
5 to 9 minutes:
| Seneca: | 15.7% (578) |
| South Carolina: | 10.6% (193,658) |
10 to 14 minutes:
| Seneca: | 25.5% (939) |
| South Carolina: | 15.6% (284,615) |
15 to 19 minutes:
| Seneca: | 21.7% (802) |
| South Carolina: | 17.1% (311,394) |
20 to 24 minutes:
| Seneca: | 13.9% (513) |
| South Carolina: | 15.0% (274,138) |
25 to 29 minutes:
| Seneca: | 3.0% (110) |
| South Carolina: | 5.9% (108,410) |
30 to 34 minutes:
| Seneca: | 7.6% (279) |
| South Carolina: | 13.5% (246,792) |
35 to 39 minutes:
| Seneca: | 0.5% (17) |
| South Carolina: | 2.5% (44,712) |
40 to 44 minutes:
| Seneca: | 0.5% (17) |
| South Carolina: | 2.6% (46,969) |
45 to 59 minutes:
| Seneca: | 2.4% (90) |
| South Carolina: | 6.3% (114,459) |
60 to 89 minutes:
| Seneca: | 1.6% (58) |
| South Carolina: | 3.4% (61,532) |
90 or more minutes:
| Seneca: | 1.8% (68) |
| South Carolina: | 2.4% (44,165) |

Less than 5 minutes - Males:
| Seneca: | 7.7% (137) |
| South Carolina: | 2.8% (30,989) |
5 to 9 minutes - Males:
| Seneca: | 17.9% (319) |
| South Carolina: | 8.4% (94,340) |
10 to 14 minutes - Males:
| Seneca: | 16.8% (299) |
| South Carolina: | 12.5% (140,041) |
15 to 19 minutes - Males:
| Seneca: | 20.8% (369) |
| South Carolina: | 16.0% (178,768) |
20 to 24 minutes - Males:
| Seneca: | 7.7% (137) |
| South Carolina: | 15.5% (173,312) |
25 to 29 minutes - Males:
| Seneca: | 4.2% (75) |
| South Carolina: | 7.1% (79,849) |
30 to 34 minutes - Males:
| Seneca: | 5.6% (100) |
| South Carolina: | 14.8% (165,357) |
35 to 39 minutes - Males:
| Seneca: | 2.0% (36) |
| South Carolina: | 2.9% (31,974) |
40 to 44 minutes - Males:
| Seneca: | 1.7% (30) |
| South Carolina: | 3.9% (43,134) |
45 to 59 minutes - Males:
| Seneca: | 3.5% (62) |
| South Carolina: | 8.7% (97,492) |
60 to 89 minutes - Males:
| Seneca: | 6.6% (117) |
| South Carolina: | 4.6% (51,523) |
90 or more minutes - Males:
| Seneca: | 1.6% (29) |
| South Carolina: | 2.8% (30,776) |

Less than 5 minutes - Females:
| Seneca: | 6.1% (134) |
| South Carolina: | 2.6% (25,700) |
5 to 9 minutes - Females:
| Seneca: | 16.2% (355) |
| South Carolina: | 10.0% (99,936) |
10 to 14 minutes - Females:
| Seneca: | 18.9% (414) |
| South Carolina: | 14.6% (146,065) |
15 to 19 minutes - Females:
| Seneca: | 14.4% (315) |
| South Carolina: | 16.8% (168,276) |
20 to 24 minutes - Females:
| Seneca: | 11.3% (248) |
| South Carolina: | 15.9% (158,817) |
25 to 29 minutes - Females:
| Seneca: | 8.9% (196) |
| South Carolina: | 7.5% (75,397) |
30 to 34 minutes - Females:
| Seneca: | 8.6% (189) |
| South Carolina: | 13.9% (139,026) |
35 to 39 minutes - Females:
| Seneca: | 6.1% (133) |
| South Carolina: | 3.3% (32,540) |
40 to 44 minutes - Females:
| Seneca: | 1.2% (26) |
| South Carolina: | 3.2% (32,068) |
45 to 59 minutes - Females:
| Seneca: | 2.4% (52) |
| South Carolina: | 6.8% (68,290) |
60 to 89 minutes - Females:
| Seneca: | 0.4% (8) |
| South Carolina: | 3.9% (39,460) |
Means of transportation to work
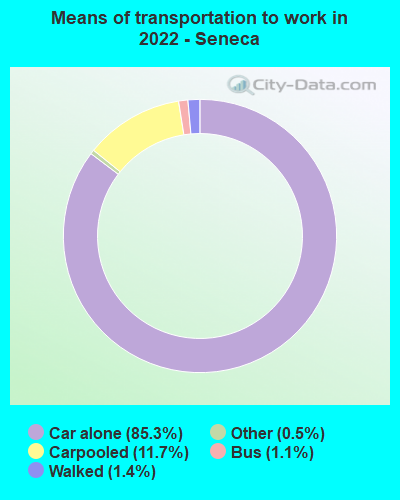
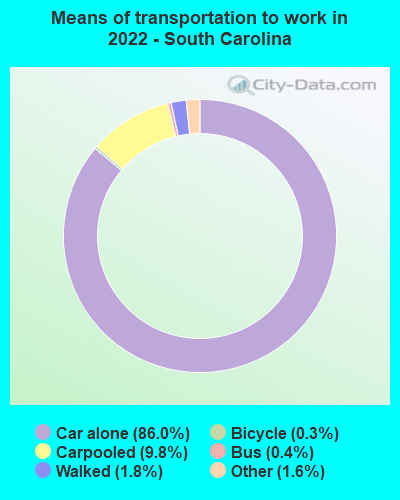
Drove car alone:
| Seneca: | 85.3% (3,492) |
| South Carolina: | 86.0% (863,900) |
Carpooled:
| Seneca: | 11.7% (478) |
| South Carolina: | 9.8% (102,301) |
Bus:
| Seneca: | 1.1% (47) |
| South Carolina: | 0.4% (4,499) |
Walked:
| Seneca: | 1.4% (57) |
| South Carolina: | 1.8% (14,450) |
Other means:
| Seneca: | 0.5% (22) |
| South Carolina: | 1.6% (14,846) |

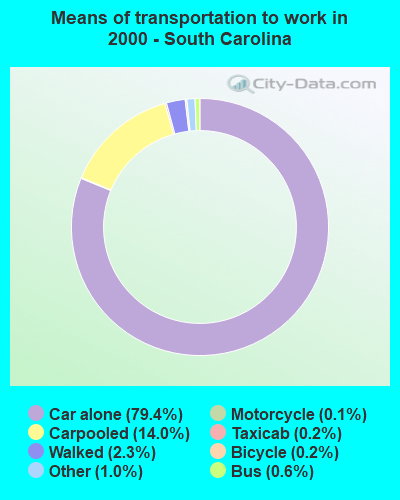
Drove car alone:
| Seneca: | 78.6% (2,898) |
| South Carolina: | 79.4% (1,447,338) |
Carpooled:
| Seneca: | 18.3% (674) |
| South Carolina: | 14.0% (255,857) |
Taxicab:
| Seneca: | 0.2% (6) |
| South Carolina: | 0.2% (3,475) |
Bicycle:
| Seneca: | 0.2% (7) |
| South Carolina: | 0.2% (3,874) |
Walked:
| Seneca: | 1.0% (36) |
| South Carolina: | 2.3% (42,567) |
Other means:
| Seneca: | 0.9% (35) |
| South Carolina: | 1.0% (17,527) |

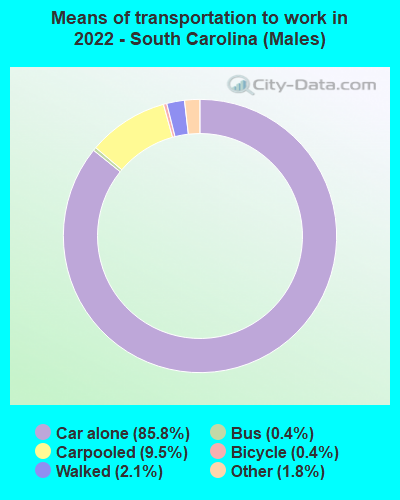
Drove car alone - Males:
| Seneca: | 88.2% (1,674) |
| South Carolina: | 85.8% (863,900) |
Carpooled - Males:
| Seneca: | 5.2% (98) |
| South Carolina: | 9.5% (102,301) |
Bus - Males:
| Seneca: | 2.5% (47) |
| South Carolina: | 0.4% (4,499) |
Walked - Males:
| Seneca: | 3.0% (57) |
| South Carolina: | 2.1% (14,450) |
Other means - Males:
| Seneca: | 1.1% (22) |
| South Carolina: | 1.8% (14,846) |

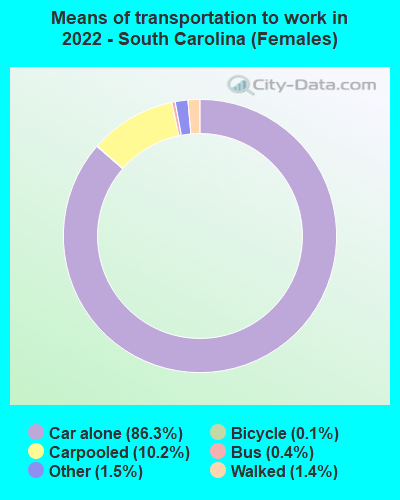
Drove car alone - Females:
| Seneca: | 82.7% (1,819) |
| South Carolina: | 86.3% (863,900) |
Carpooled - Females:
| Seneca: | 17.3% (381) |
| South Carolina: | 10.2% (102,301) |
Private vehicle occupancy

Drove alone:
| Seneca: | 81.6% (3,023) |
| South Carolina: | 90.0% (1,869,768) |
In 2 person carpool:
| Seneca: | 9.8% (364) |
| South Carolina: | 7.4% (154,163) |
In 3 person carpool:
| Seneca: | 5.3% (195) |
| South Carolina: | 1.5% (31,839) |
In 4 person carpool:
| Seneca: | 3.1% (116) |
| South Carolina: | 0.6% (13,277) |
In 7+ person carpool:
| Seneca: | 0.2% (7) |
| South Carolina: | 0.2% (4,850) |

Drove alone:
| Seneca: | 81.1% (2,898) |
| South Carolina: | 85.0% (1,447,338) |
In 2 person carpool:
| Seneca: | 14.2% (509) |
| South Carolina: | 11.0% (187,418) |
In 3 person carpool:
| Seneca: | 2.5% (89) |
| South Carolina: | 2.4% (40,124) |
In 4 person carpool:
| Seneca: | 1.2% (44) |
| South Carolina: | 0.9% (15,038) |
In 5-6 person carpool:
| Seneca: | 0.7% (26) |
| South Carolina: | 0.5% (8,470) |
In 7+ person carpool:
| Seneca: | 0.2% (6) |
| South Carolina: | 0.3% (4,807) |
Class of workers
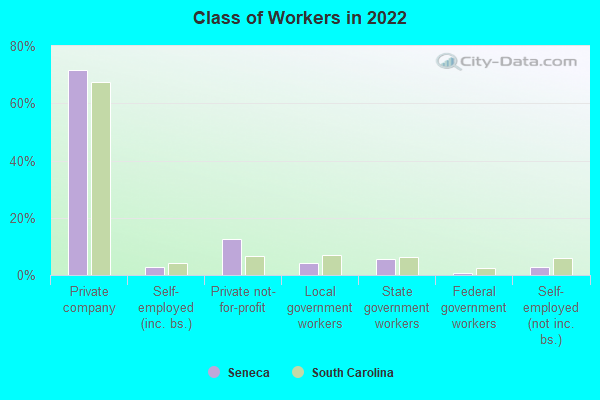
Employee of private company:
| Seneca: | 71.5% (2,849) |
| South Carolina: | 67.4% (1,654,283) |
Self-employed in own incorporated business:
| Seneca: | 2.7% (109) |
| South Carolina: | 4.2% (102,791) |
Private not-for-profit wage and salary workers:
| Seneca: | 12.4% (496) |
| South Carolina: | 6.6% (161,608) |
Local government workers:
| Seneca: | 4.3% (171) |
| South Carolina: | 6.9% (169,428) |
State government workers:
| Seneca: | 5.6% (224) |
| South Carolina: | 6.3% (153,845) |
Federal government workers:
| Seneca: | 0.6% (24) |
| South Carolina: | 2.5% (62,253) |
Self-employed workers in own not incorporated business:
| Seneca: | 2.7% (108) |
| South Carolina: | 5.9% (144,382) |
Unpaid family workers:
| Seneca: | 0.1% (5) |
| South Carolina: | 0.2% (5,457) |

Employee of private company:
| Seneca: | 68.7% (2,585) |
| South Carolina: | 70.4% (1,284,199) |
Self-employed in own incorporated business:
| Seneca: | 2.6% (98) |
| South Carolina: | 3.1% (56,628) |
Private not-for-profit wage and salary workers:
| Seneca: | 5.3% (199) |
| South Carolina: | 4.6% (84,506) |
Local government workers:
| Seneca: | 4.8% (182) |
| South Carolina: | 5.4% (99,319) |
State government workers:
| Seneca: | 12.3% (464) |
| South Carolina: | 8.1% (147,384) |
Federal government workers:
| Seneca: | 1.3% (50) |
| South Carolina: | 2.4% (43,164) |
Self-employed workers in own not incorporated business:
| Seneca: | 4.7% (177) |
| South Carolina: | 5.7% (104,649) |
Unpaid family workers:
| Seneca: | 0.2% (9) |
| South Carolina: | 0.3% (4,851) |

Employee of private company - Males:
| Seneca: | 67.9% (1,407) |
| South Carolina: | 70.5% (888,497) |
Self-employed in own incorporated business - Males:
| Seneca: | 4.6% (95) |
| South Carolina: | 5.3% (66,629) |
Private not-for-profit wage and salary workers - Males:
| Seneca: | 12.2% (253) |
| South Carolina: | 4.5% (56,196) |
Local government workers - Males:
| Seneca: | 3.8% (79) |
| South Carolina: | 5.3% (66,693) |
State government workers - Males:
| Seneca: | 5.3% (110) |
| South Carolina: | 4.5% (56,682) |
Federal government workers - Males:
| Seneca: | 1.1% (24) |
| South Carolina: | 2.8% (35,915) |
Self-employed workers in own not incorporated business - Males:
| Seneca: | 5.0% (104) |
| South Carolina: | 6.9% (86,738) |

Employee of private company - Females:
| Seneca: | 75.3% (1,442) |
| South Carolina: | 64.2% (765,786) |
Self-employed in own incorporated business - Females:
| Seneca: | 0.7% (13) |
| South Carolina: | 3.0% (36,162) |
Private not-for-profit wage and salary workers - Females:
| Seneca: | 12.7% (243) |
| South Carolina: | 8.8% (105,412) |
Local government workers - Females:
| Seneca: | 4.8% (92) |
| South Carolina: | 8.6% (102,735) |
State government workers - Females:
| Seneca: | 6.0% (114) |
| South Carolina: | 8.1% (97,163) |
Self-employed workers in own not incorporated business - Females:
| Seneca: | 0.2% (4) |
| South Carolina: | 4.8% (57,644) |
Unpaid family workers - Females:
| Seneca: | 0.3% (5) |
| South Carolina: | 0.2% (1,968) |