Work and Jobs in Shaver Lake, California (CA) Detailed Stats
Occupations, Industries, Unemployment, Workers, Commute
Settings
X


Recent posts about work in Shaver Lake, California on our local forum with over 2,400,000 registered users:
 | Job in Fresno (45 replies) |
| How about Bakersfield livability? (36 replies) |
| Fresno for Native Arizonian... (72 replies) |
| Best Mountain Town in CA? (79 replies) |
| Small town 80,000. Or less (36 replies) |
| My review of the Sacramento area (31 replies) |
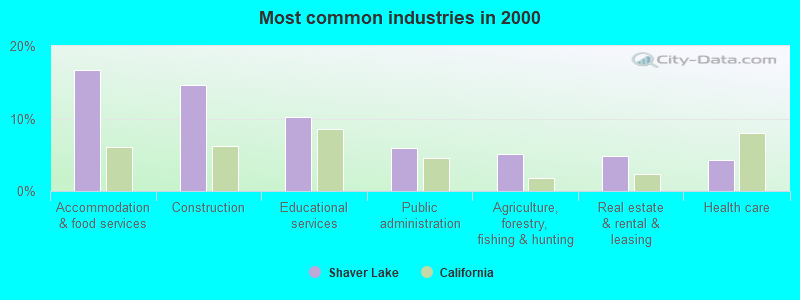
The most common industries in Shaver Lake are: Accommodation & food services (16.7% of civilian employees), Construction (14.7% of civilian employees), Educational services (10.2% of civilian employees). 68.2% of workers work in Fresno County and 17.0% of all workers work at home. 69.3% of workers are employees of private companies, which is 4.1% greater than the rate of 66.5% across the entire state of California.
Whole page based on the data from 2000 / 2022 when the population of Shaver Lake, California was 705 / 308
Whole page based on the data from 2000 / 2022 when the population of Shaver Lake, California was 705 / 308
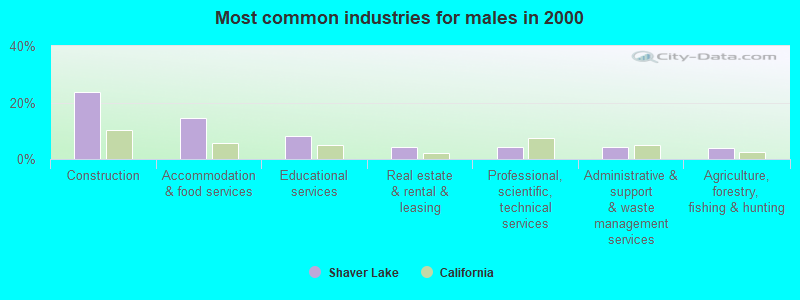
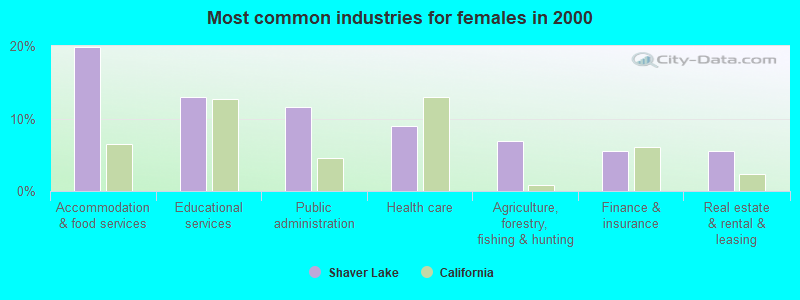
Most common industries
Most common industries | |||
|---|---|---|---|
Industry | All | Males | Females |
| Accommodation and food services | 16.7% (59) | 14.4% (30) | 19.9% (29) |
| Construction | 14.7% (52) | 23.6% (49) | 2.1% (3) |
| Educational services | 10.2% (36) | 8.2% (17) | 13.0% (19) |
| Public administration | 5.9% (21) | 1.9% (4) | 11.6% (17) |
| Agriculture, forestry, fishing and hunting | 5.1% (18) | 3.8% (8) | 6.8% (10) |
| Real estate and rental and leasing | 4.8% (17) | 4.3% (9) | 5.5% (8) |
| Health care | 4.2% (15) | 1.0% (2) | 8.9% (13) |
| Professional, scientific, and technical services | 3.4% (12) | 4.3% (9) | 2.1% (3) |
| Sporting goods, camera, and hobby and toy stores | 3.1% (11) | 3.8% (8) | 2.1% (3) |
| Religious, grantmaking, civic, professional, and similar organizations | 2.5% (9) | 3.4% (7) | 1.4% (2) |
| Administrative and support and waste management services | 2.5% (9) | 4.3% (9) | 0.0% (0) |
| Repair and maintenance | 2.3% (8) | 3.8% (8) | 0.0% (0) |
| Finance and insurance | 2.3% (8) | 0.0% (0) | 5.5% (8) |
| Utilities | 2.3% (8) | 3.8% (8) | 0.0% (0) |
| Gasoline stations | 1.4% (5) | 1.0% (2) | 2.1% (3) |
| Arts, entertainment, and recreation | 1.4% (5) | 1.0% (2) | 2.1% (3) |
| Broadcasting and telecommunications | 1.4% (5) | 2.4% (5) | 0.0% (0) |
| Other transportation, and support activities, and couriers | 1.4% (5) | 1.0% (2) | 2.1% (3) |
| Rail transportation | 1.1% (4) | 1.9% (4) | 0.0% (0) |
| Air transportation | 1.1% (4) | 0.0% (0) | 2.7% (4) |
| Social assistance | 1.1% (4) | 0.0% (0) | 2.7% (4) |
| Used merchandise, gift, novelty, and souvenir, and other miscellaneous stores | 0.8% (3) | 0.0% (0) | 2.1% (3) |
| Private households | 0.8% (3) | 1.4% (3) | 0.0% (0) |
| Professional and commercial equipment and supplies merchant wholesalers | 0.8% (3) | 1.4% (3) | 0.0% (0) |
| Electrical and electronic goods merchant wholesalers | 0.8% (3) | 1.4% (3) | 0.0% (0) |
| Publishing, and motion picture and sound recording industries | 0.8% (3) | 0.0% (0) | 2.1% (3) |
| U. S. Postal service | 0.8% (3) | 1.4% (3) | 0.0% (0) |
| Radio, TV, and computer stores | 0.8% (3) | 1.4% (3) | 0.0% (0) |
| Pharmacies and drug stores | 0.6% (2) | 0.0% (0) | 1.4% (2) |
| Truck transportation | 0.6% (2) | 1.0% (2) | 0.0% (0) |
| Personal and laundry services | 0.6% (2) | 0.0% (0) | 1.4% (2) |
| Metal and metal products | 0.6% (2) | 1.0% (2) | 0.0% (0) |
| Furniture and related product manufacturing | 0.6% (2) | 1.0% (2) | 0.0% (0) |
| Data processing, libraries, and other information services | 0.6% (2) | 0.0% (0) | 1.4% (2) |
| Hardware, plumbing and heating equipment, and supplies merchant wholesalers | 0.6% (2) | 1.0% (2) | 0.0% (0) |
| Building material and garden equipment and supplies dealers | 0.6% (2) | 0.0% (0) | 1.4% (2) |
| Department and other general merchandise stores | 0.3% (1) | 0.5% (1) | 0.0% (0) |
| Groceries and related products merchant wholesalers | 0.3% (1) | 0.5% (1) | 0.0% (0) |
Unemployment in Shaver Lake
- Unemployment by race in 2022
- Unemployment rate for White non-Hispanic residents
- 3.8%Females
- Unemployment rate for other race residents
- 23.7%Males
- 72.2%Females
- Unemployment rate for Hispanic or Latino residents
- 13.6%Males
- 22.7%Females
- Unemployment by race in 2000
- Unemployment rate for White non-Hispanic residents
- 1.5%Males
- 4.1%Females
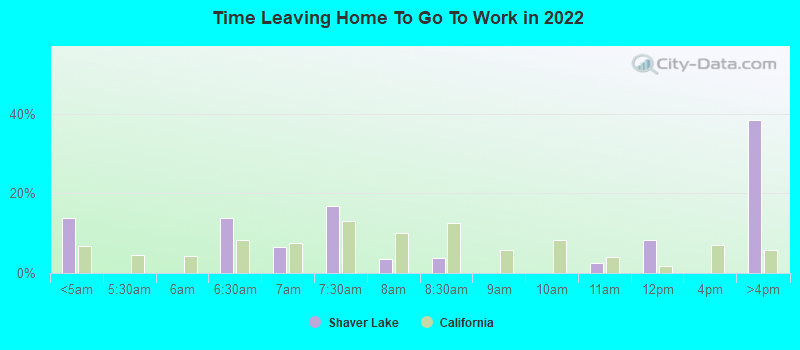
Time leaving home to go to work
12:00 a.m. to 4:59 a.m.:
| Shaver Lake: | 13.9% (10) |
| California: | 6.8% (1,050,902) |
6:00 a.m. to 6:29 a.m.:
| Shaver Lake: | 13.9% (10) |
| California: | 8.3% (1,273,588) |
6:30 a.m. to 6:59 a.m.:
| Shaver Lake: | 6.6% (5) |
| California: | 7.5% (1,156,338) |
7:00 a.m. to 7:29 a.m.:
| Shaver Lake: | 16.9% (13) |
| California: | 13.2% (2,027,702) |
7:30 a.m. to 7:59 a.m.:
| Shaver Lake: | 3.6% (3) |
| California: | 10.1% (1,550,402) |
8:00 a.m. to 8:29 a.m.:
| Shaver Lake: | 3.9% (3) |
| California: | 12.7% (1,953,986) |
10:00 a.m. to 10:59 a.m.:
| Shaver Lake: | 2.6% (2) |
| California: | 4.0% (613,193) |
11:00 a.m. to 11:59 a.m.:
| Shaver Lake: | 8.3% (6) |
| California: | 1.8% (280,975) |
4:00 p.m. to 11:59 p.m.:
| Shaver Lake: | 38.4% (29) |
| California: | 5.8% (891,240) |
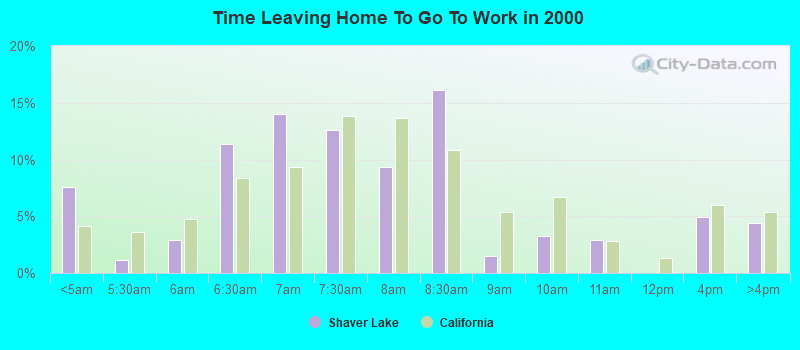
<5am:
| Shaver Lake: | 7.6% (26) |
| California: | 4.2% (606,086) |
5:30am:
| Shaver Lake: | 1.2% (4) |
| California: | 3.6% (523,209) |
6am:
| Shaver Lake: | 2.9% (10) |
| California: | 4.8% (692,256) |
6:30am:
| Shaver Lake: | 11.4% (39) |
| California: | 8.4% (1,216,867) |
7am:
| Shaver Lake: | 14.0% (48) |
| California: | 9.4% (1,362,830) |
7:30am:
| Shaver Lake: | 12.6% (43) |
| California: | 13.8% (2,006,950) |
8am:
| Shaver Lake: | 9.4% (32) |
| California: | 13.7% (1,986,831) |
8:30am:
| Shaver Lake: | 16.1% (55) |
| California: | 10.9% (1,577,815) |
9am:
| Shaver Lake: | 1.5% (5) |
| California: | 5.4% (778,152) |
10am:
| Shaver Lake: | 3.2% (11) |
| California: | 6.7% (972,355) |
11am:
| Shaver Lake: | 2.9% (10) |
| California: | 2.9% (414,479) |
4pm:
| Shaver Lake: | 5.0% (17) |
| California: | 6.0% (865,284) |
>4pm:
| Shaver Lake: | 4.4% (15) |
| California: | 5.3% (776,167) |
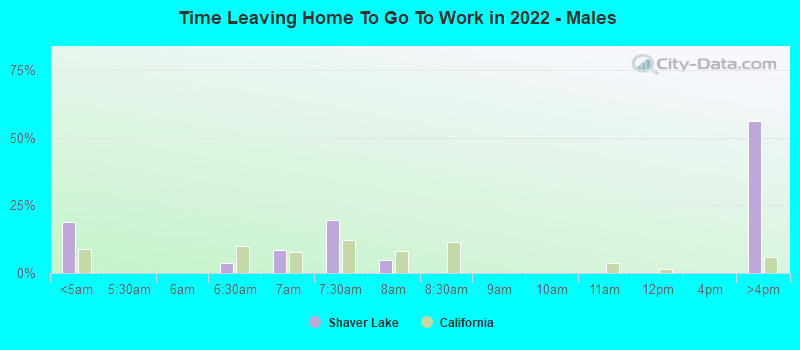
12:00 a.m. to 4:59 a.m. - Males:
| Shaver Lake: | 19.0% (10) |
| California: | 8.7% (747,612) |
6:00 a.m. to 6:29 a.m. - Males:
| Shaver Lake: | 3.7% (2) |
| California: | 9.8% (842,941) |
6:30 a.m. to 6:59 a.m. - Males:
| Shaver Lake: | 8.5% (5) |
| California: | 7.7% (657,557) |
7:00 a.m. to 7:29 a.m. - Males:
| Shaver Lake: | 19.7% (11) |
| California: | 12.4% (1,058,532) |
7:30 a.m. to 7:59 a.m. - Males:
| Shaver Lake: | 4.9% (3) |
| California: | 8.2% (702,727) |
4:00 p.m. to 11:59 p.m. - Males:
| Shaver Lake: | 56.2% (30) |
| California: | 5.8% (499,471) |
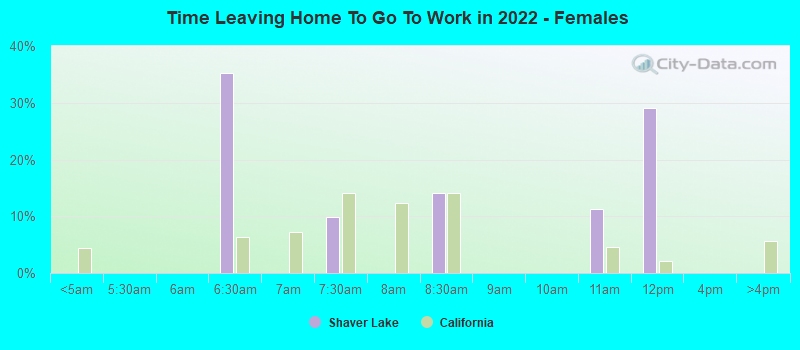
6:00 a.m. to 6:29 a.m. - Females:
| Shaver Lake: | 35.2% (8) |
| California: | 6.3% (430,647) |
7:00 a.m. to 7:29 a.m. - Females:
| Shaver Lake: | 9.8% (2) |
| California: | 14.1% (969,170) |
8:00 a.m. to 8:29 a.m. - Females:
| Shaver Lake: | 14.0% (3) |
| California: | 14.1% (969,448) |
10:00 a.m. to 10:59 a.m. - Females:
| Shaver Lake: | 11.2% (2) |
| California: | 4.5% (311,768) |
11:00 a.m. to 11:59 a.m. - Females:
| Shaver Lake: | 29.0% (6) |
| California: | 2.0% (139,355) |
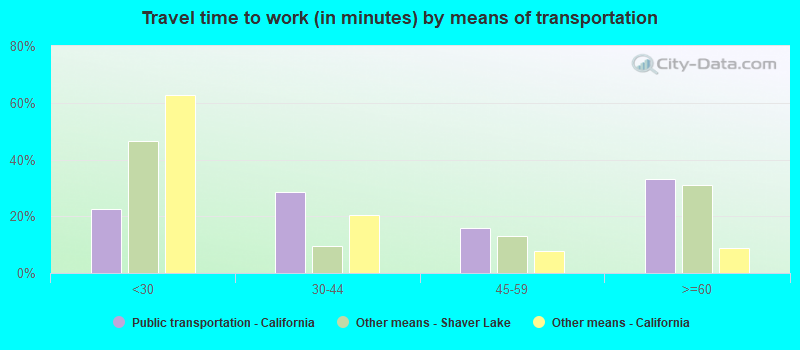
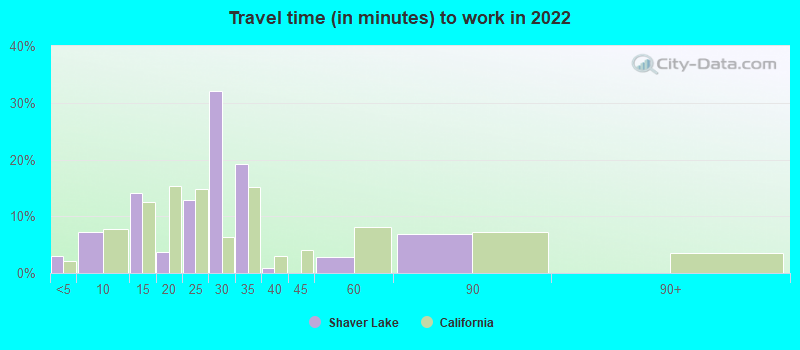
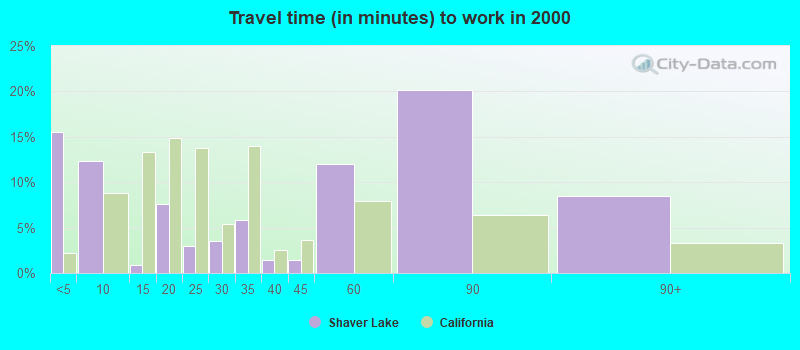
Travel time to work
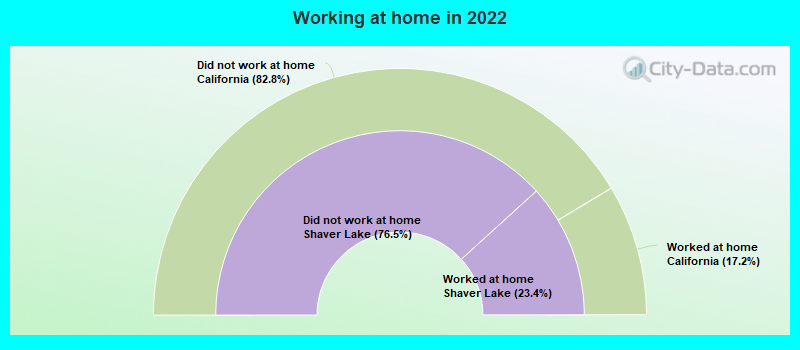
Percentage of workers working in this county: 68.2%
Number of people working at home: 15 (17.0% of all workers)
Number of people working at home: 15 (17.0% of all workers)
Less than 5 minutes:
| Shaver Lake: | 3.1% (14) |
| California: | 2.1% (323,064) |
5 to 9 minutes:
| Shaver Lake: | 7.2% (32) |
| California: | 7.8% (1,208,682) |
10 to 14 minutes:
| Shaver Lake: | 14.1% (63) |
| California: | 12.4% (1,917,610) |
15 to 19 minutes:
| Shaver Lake: | 3.7% (17) |
| California: | 15.3% (2,367,483) |
20 to 24 minutes:
| Shaver Lake: | 12.9% (58) |
| California: | 14.8% (2,279,693) |
25 to 29 minutes:
| Shaver Lake: | 32.0% (143) |
| California: | 6.4% (981,997) |
30 to 34 minutes:
| Shaver Lake: | 19.2% (85) |
| California: | 15.2% (2,339,223) |
35 to 39 minutes:
| Shaver Lake: | 0.9% (4) |
| California: | 2.9% (453,226) |
45 to 59 minutes:
| Shaver Lake: | 2.7% (12) |
| California: | 8.2% (1,259,482) |
60 to 89 minutes:
| Shaver Lake: | 6.9% (31) |
| California: | 7.2% (1,111,698) |
Less than 5 minutes:
| Shaver Lake: | 15.5% (53) |
| California: | 2.2% (324,703) |
5 to 9 minutes:
| Shaver Lake: | 12.3% (42) |
| California: | 8.8% (1,280,443) |
10 to 14 minutes:
| Shaver Lake: | 0.9% (3) |
| California: | 13.3% (1,930,263) |
15 to 19 minutes:
| Shaver Lake: | 7.6% (26) |
| California: | 14.9% (2,157,970) |
20 to 24 minutes:
| Shaver Lake: | 2.9% (10) |
| California: | 13.8% (2,004,060) |
25 to 29 minutes:
| Shaver Lake: | 3.5% (12) |
| California: | 5.4% (782,241) |
30 to 34 minutes:
| Shaver Lake: | 5.8% (20) |
| California: | 13.9% (2,025,657) |
35 to 39 minutes:
| Shaver Lake: | 1.5% (5) |
| California: | 2.5% (366,487) |
40 to 44 minutes:
| Shaver Lake: | 1.5% (5) |
| California: | 3.6% (528,043) |
45 to 59 minutes:
| Shaver Lake: | 12.0% (41) |
| California: | 7.9% (1,151,598) |
60 to 89 minutes:
| Shaver Lake: | 20.2% (69) |
| California: | 6.4% (933,123) |
90 or more minutes:
| Shaver Lake: | 8.5% (29) |
| California: | 3.3% (483,698) |
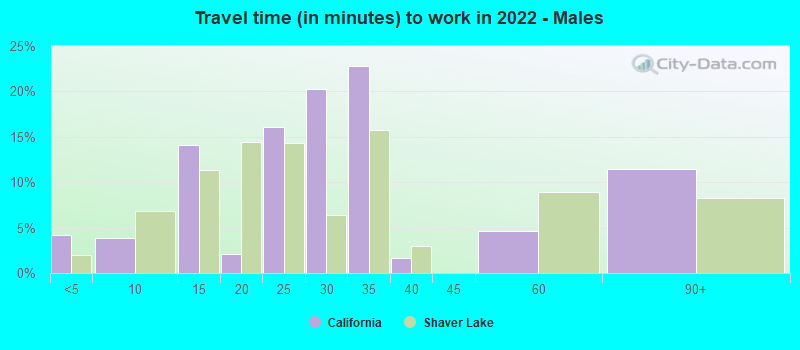
Less than 5 minutes - Males:
| Shaver Lake: | 4.2% (11) |
| California: | 2.0% (173,603) |
5 to 9 minutes - Males:
| Shaver Lake: | 3.9% (10) |
| California: | 6.8% (580,822) |
10 to 14 minutes - Males:
| Shaver Lake: | 14.1% (38) |
| California: | 11.4% (974,497) |
15 to 19 minutes - Males:
| Shaver Lake: | 2.0% (5) |
| California: | 14.5% (1,239,386) |
20 to 24 minutes - Males:
| Shaver Lake: | 16.1% (43) |
| California: | 14.3% (1,223,429) |
25 to 29 minutes - Males:
| Shaver Lake: | 20.2% (54) |
| California: | 6.4% (545,844) |
30 to 34 minutes - Males:
| Shaver Lake: | 22.8% (61) |
| California: | 15.8% (1,352,210) |
35 to 39 minutes - Males:
| Shaver Lake: | 1.6% (4) |
| California: | 3.0% (253,732) |
45 to 59 minutes - Males:
| Shaver Lake: | 4.6% (12) |
| California: | 8.9% (762,659) |
60 to 89 minutes - Males:
| Shaver Lake: | 11.4% (31) |
| California: | 8.3% (711,394) |
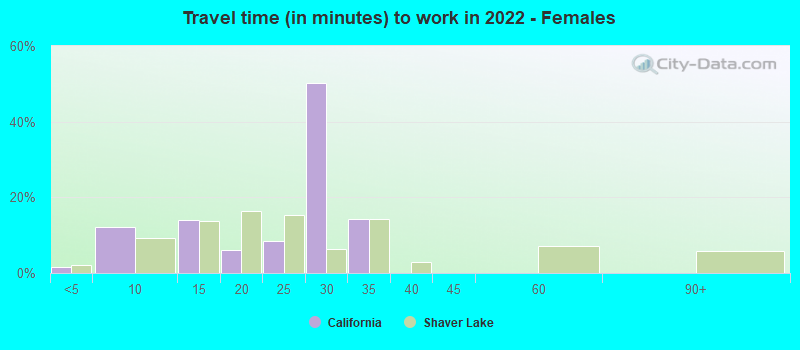
Less than 5 minutes - Females:
| Shaver Lake: | 1.7% (3) |
| California: | 2.2% (149,461) |
5 to 9 minutes - Females:
| Shaver Lake: | 12.1% (22) |
| California: | 9.2% (627,860) |
10 to 14 minutes - Females:
| Shaver Lake: | 14.1% (25) |
| California: | 13.7% (943,113) |
15 to 19 minutes - Females:
| Shaver Lake: | 6.2% (11) |
| California: | 16.4% (1,128,097) |
20 to 24 minutes - Females:
| Shaver Lake: | 8.4% (15) |
| California: | 15.4% (1,056,264) |
25 to 29 minutes - Females:
| Shaver Lake: | 50.3% (90) |
| California: | 6.4% (436,153) |
30 to 34 minutes - Females:
| Shaver Lake: | 14.1% (25) |
| California: | 14.4% (987,013) |
Means of transportation to work
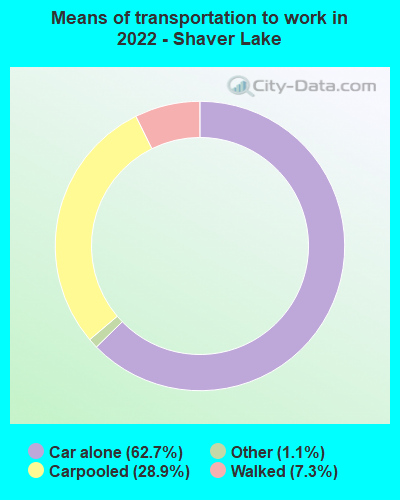

Drove car alone:
| Shaver Lake: | 62.7% (287) |
| California: | 79.1% (5,345,368) |
Carpooled:
| Shaver Lake: | 28.9% (132) |
| California: | 11.9% (878,699) |
Walked:
| Shaver Lake: | 7.3% (33) |
| California: | 2.9% (218,374) |
Other means:
| Shaver Lake: | 1.1% (5) |
| California: | 2.1% (137,489) |
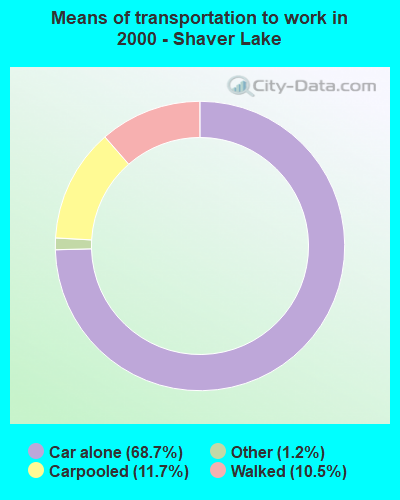

Drove car alone:
| Shaver Lake: | 68.7% (235) |
| California: | 71.8% (10,432,462) |
Carpooled:
| Shaver Lake: | 11.7% (40) |
| California: | 14.5% (2,113,313) |
Walked:
| Shaver Lake: | 10.5% (36) |
| California: | 2.9% (414,581) |
Other means:
| Shaver Lake: | 1.2% (4) |
| California: | 0.8% (115,064) |
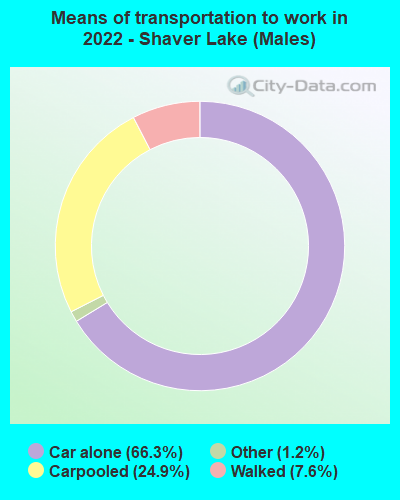

Drove car alone - Males:
| Shaver Lake: | 66.3% (172) |
| California: | 80.0% (5,345,368) |
Carpooled - Males:
| Shaver Lake: | 24.9% (65) |
| California: | 11.1% (878,699) |
Walked - Males:
| Shaver Lake: | 7.6% (20) |
| California: | 2.7% (218,374) |
Other means - Males:
| Shaver Lake: | 1.2% (3) |
| California: | 2.1% (137,489) |
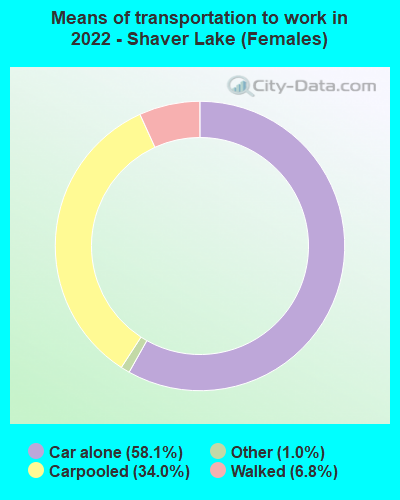

Drove car alone - Females:
| Shaver Lake: | 58.1% (115) |
| California: | 77.9% (5,345,368) |
Carpooled - Females:
| Shaver Lake: | 34.0% (67) |
| California: | 12.8% (878,699) |
Walked - Females:
| Shaver Lake: | 6.8% (13) |
| California: | 3.2% (218,374) |
Other means - Females:
| Shaver Lake: | 1.0% (2) |
| California: | 2.0% (137,489) |
Private vehicle occupancy
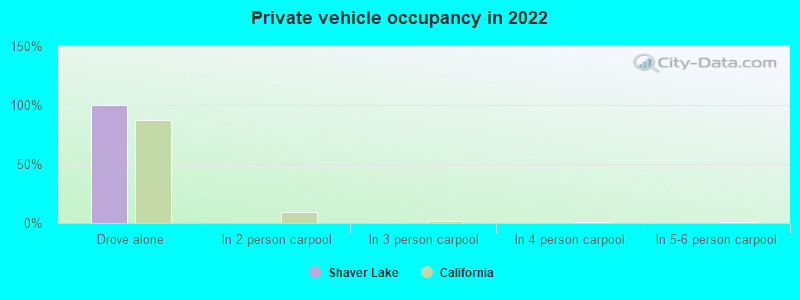
Drove alone:
| Shaver Lake: | 100.0% (49) |
| California: | 86.9% (12,187,486) |
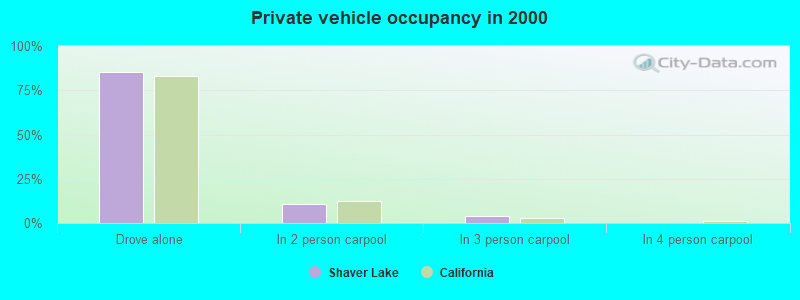
Drove alone:
| Shaver Lake: | 85.5% (235) |
| California: | 83.2% (10,432,462) |
In 2 person carpool:
| Shaver Lake: | 10.5% (29) |
| California: | 12.5% (1,564,905) |
In 3 person carpool:
| Shaver Lake: | 4.0% (11) |
| California: | 2.6% (330,732) |
Class of workers
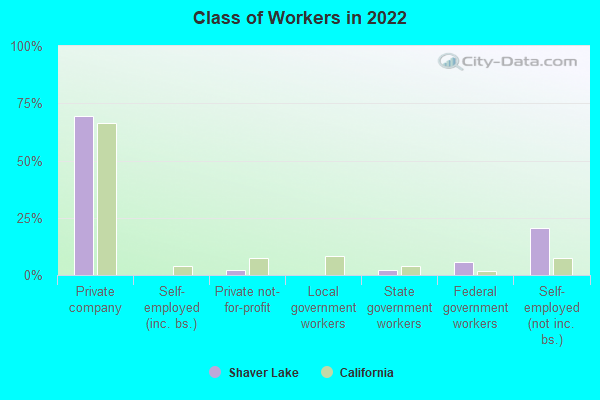
Employee of private company:
| Shaver Lake: | 69.3% (64) |
| California: | 66.5% (12,596,030) |
Private not-for-profit wage and salary workers:
| Shaver Lake: | 2.3% (2) |
| California: | 7.5% (1,417,407) |
State government workers:
| Shaver Lake: | 2.3% (2) |
| California: | 4.1% (780,915) |
Federal government workers:
| Shaver Lake: | 5.7% (5) |
| California: | 2.0% (369,858) |
Self-employed workers in own not incorporated business:
| Shaver Lake: | 20.5% (19) |
| California: | 7.4% (1,410,735) |
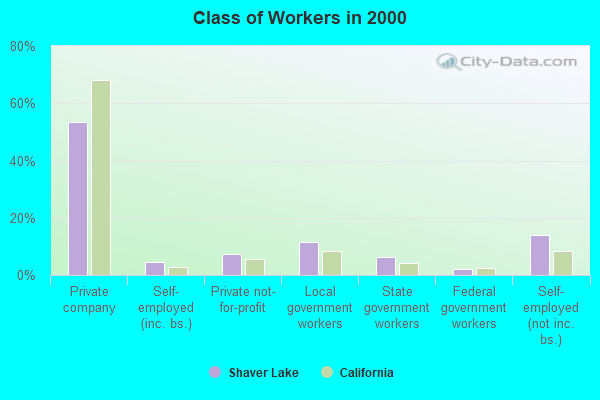
Employee of private company:
| Shaver Lake: | 53.4% (189) |
| California: | 68.0% (10,009,465) |
Self-employed in own incorporated business:
| Shaver Lake: | 4.5% (16) |
| California: | 2.7% (402,392) |
Private not-for-profit wage and salary workers:
| Shaver Lake: | 7.3% (26) |
| California: | 5.7% (845,536) |
Local government workers:
| Shaver Lake: | 11.6% (41) |
| California: | 8.3% (1,218,764) |
State government workers:
| Shaver Lake: | 6.2% (22) |
| California: | 4.0% (594,953) |
Federal government workers:
| Shaver Lake: | 2.3% (8) |
| California: | 2.3% (344,354) |
Self-employed workers in own not incorporated business:
| Shaver Lake: | 14.1% (50) |
| California: | 8.5% (1,249,530) |
Unpaid family workers:
| Shaver Lake: | 0.6% (2) |
| California: | 0.4% (53,934) |
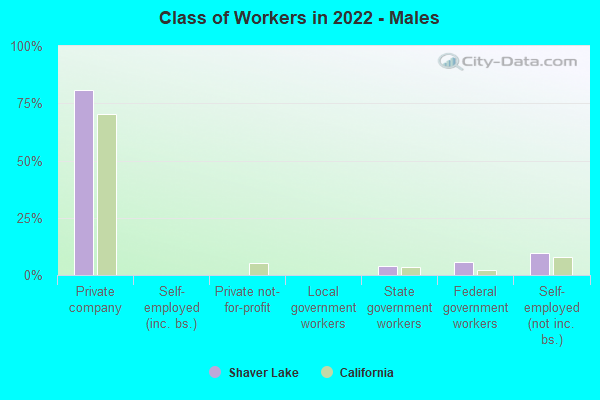
Employee of private company - Males:
| Shaver Lake: | 80.8% (44) |
| California: | 70.3% (7,191,252) |
State government workers - Males:
| Shaver Lake: | 3.8% (2) |
| California: | 3.4% (343,636) |
Federal government workers - Males:
| Shaver Lake: | 5.8% (3) |
| California: | 2.1% (209,874) |
Self-employed workers in own not incorporated business - Males:
| Shaver Lake: | 9.6% (5) |
| California: | 8.1% (824,359) |
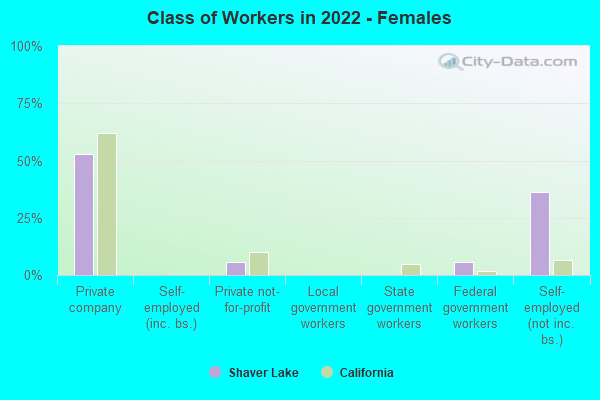
Employee of private company - Females:
| Shaver Lake: | 52.8% (20) |
| California: | 62.0% (5,404,778) |
Private not-for-profit wage and salary workers - Females:
| Shaver Lake: | 5.6% (2) |
| California: | 10.2% (888,285) |
Federal government workers - Females:
| Shaver Lake: | 5.6% (2) |
| California: | 1.8% (159,984) |
Self-employed workers in own not incorporated business - Females:
| Shaver Lake: | 36.1% (14) |
| California: | 6.7% (586,376) |