Work and Jobs in Shelburne, New Hampshire (NH) Detailed Stats
Occupations, Industries, Unemployment, Workers, Commute

Recent posts about work in Shelburne, New Hampshire on our local forum with over 2,400,000 registered users:
 | Moving to NE Region - Need Advice (10 replies) |
| Moving to the Berlin/White Mountain Area...Need some help! (39 replies) |
| another Berlin thread (2 replies) |
| Looking for a "hands-on" farm for kids in greater Nashua (3 replies) |
| 10 things I HATE about New Hampshire? (116 replies) |
| We're coming up to Lancaster! (12 replies) |
Latest news about work in Shelburne, NH collected exclusively by city-data.com from local newspapers, TV, and radio stations
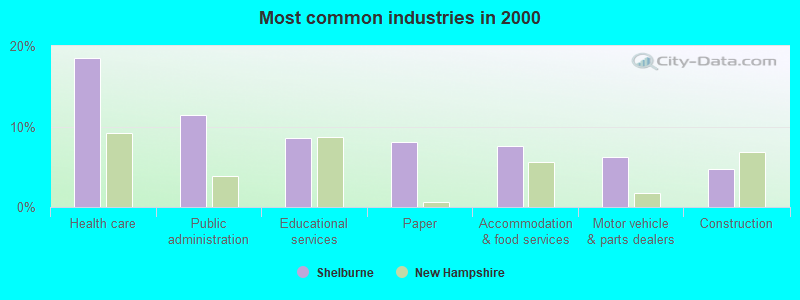
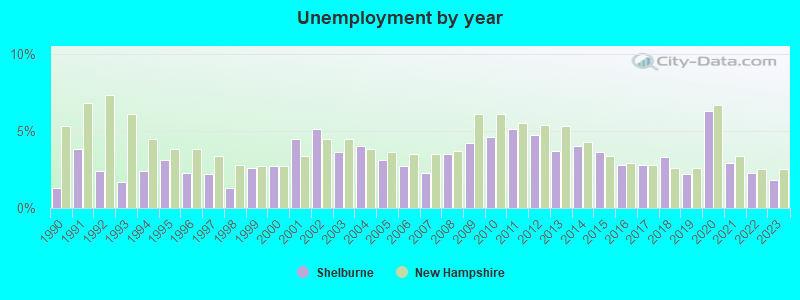
The unemployment rate in 2023 in Shelburne, NH was 1.8%, which was 38.9% less than the unemployment rate of 2.5% across the entire state of New Hampshire. Compared to the unemployment rate of 3.7% in 2013, this represents a decrease of 105.6%. The most common industries in Shelburne are: Health care (18.6% of civilian employees), Public administration (11.4% of civilian employees), Educational services (8.6% of civilian employees). 53.8% of workers are employees of private companies, which is 27.1% less than the rate of 68.4% across the entire state of New Hampshire.
Most common industries
Most common industries | |||
|---|---|---|---|
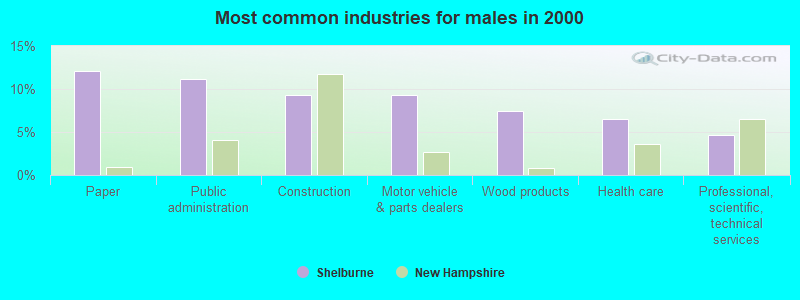
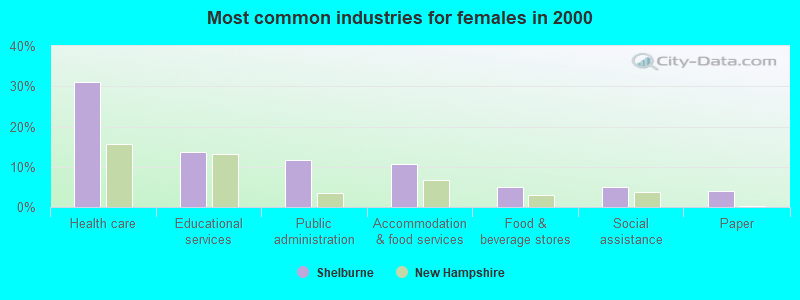
Industry | All | Males | Females |
| Health care | 18.6% (39) | 6.5% (7) | 31.1% (32) |
| Public administration | 11.4% (24) | 11.2% (12) | 11.7% (12) |
| Educational services | 8.6% (18) | 3.7% (4) | 13.6% (14) |
| Paper | 8.1% (17) | 12.1% (13) | 3.9% (4) |
| Accommodation and food services | 7.6% (16) | 4.7% (5) | 10.7% (11) |
| Motor vehicle and parts dealers | 6.2% (13) | 9.3% (10) | 2.9% (3) |
| Construction | 4.8% (10) | 9.3% (10) | 0.0% (0) |
| Wood products | 3.8% (8) | 7.5% (8) | 0.0% (0) |
| Food and beverage stores | 3.8% (8) | 2.8% (3) | 4.9% (5) |
| Professional, scientific, and technical services | 3.8% (8) | 4.7% (5) | 2.9% (3) |
| Social assistance | 2.4% (5) | 0.0% (0) | 4.9% (5) |
| Repair and maintenance | 1.9% (4) | 3.7% (4) | 0.0% (0) |
| Metal and metal products | 1.4% (3) | 0.0% (0) | 2.9% (3) |
| Plastics and rubber products | 1.4% (3) | 2.8% (3) | 0.0% (0) |
| Fuel dealers | 1.4% (3) | 2.8% (3) | 0.0% (0) |
| Data processing, libraries, and other information services | 1.4% (3) | 0.0% (0) | 2.9% (3) |
| Finance and insurance | 1.4% (3) | 0.0% (0) | 2.9% (3) |
| Agriculture, forestry, fishing and hunting | 1.0% (2) | 1.9% (2) | 0.0% (0) |
| Petroleum and petroleum products merchant wholesalers | 1.0% (2) | 1.9% (2) | 0.0% (0) |
| Furniture and home furnishings, and household appliance stores | 1.0% (2) | 1.9% (2) | 0.0% (0) |
| Electrical equipment, appliances, and components | 1.0% (2) | 1.9% (2) | 0.0% (0) |
| Lumber and other construction materials merchant wholesalers | 1.0% (2) | 1.9% (2) | 0.0% (0) |
| Building material and garden equipment and supplies dealers | 1.0% (2) | 1.9% (2) | 0.0% (0) |
| Department and other general merchandise stores | 1.0% (2) | 1.9% (2) | 0.0% (0) |
| Chemicals | 1.0% (2) | 0.0% (0) | 1.9% (2) |
| Used merchandise, gift, novelty, and souvenir, and other miscellaneous stores | 1.0% (2) | 1.9% (2) | 0.0% (0) |
| Other transportation, and support activities, and couriers | 1.0% (2) | 1.9% (2) | 0.0% (0) |
| Publishing, and motion picture and sound recording industries | 1.0% (2) | 1.9% (2) | 0.0% (0) |
| Religious, grantmaking, civic, professional, and similar organizations | 1.0% (2) | 0.0% (0) | 1.9% (2) |
| Pharmacies and drug stores | 0.5% (1) | 0.0% (0) | 1.0% (1) |
Unemployment in Shelburne
- Unemployment by race in 2000
- Unemployment rate for White non-Hispanic residents
- 11.5%Males
Unemployment in 2023:
| Shelburne: | 1.8% |
| New Hampshire: | 2.5% |
Unemployment in 2022:
| Shelburne: | 2.3% |
| New Hampshire: | 2.5% |
Unemployment in 2021:
| Shelburne: | 2.9% |
| New Hampshire: | 3.4% |
Unemployment in 2020:
| Shelburne: | 6.3% |
| New Hampshire: | 6.7% |
Unemployment in 2019:
| Shelburne: | 2.2% |
| New Hampshire: | 2.6% |
Unemployment in 2018:
| Shelburne: | 3.3% |
| New Hampshire: | 2.6% |
Unemployment in 2017:
| Shelburne: | 2.8% |
| New Hampshire: | 2.8% |
Unemployment in 2016:
| Shelburne: | 2.8% |
| New Hampshire: | 2.9% |
Unemployment in 2015:
| Shelburne: | 3.6% |
| New Hampshire: | 3.4% |
Unemployment in 2014:
| Shelburne: | 4.0% |
| New Hampshire: | 4.3% |
Unemployment in 2013:
| Shelburne: | 3.7% |
| New Hampshire: | 5.3% |
Unemployment in 2012:
| Shelburne: | 4.7% |
| New Hampshire: | 5.4% |
Unemployment in 2011:
| Shelburne: | 5.1% |
| New Hampshire: | 5.5% |
Unemployment in 2010:
| Shelburne: | 4.6% |
| New Hampshire: | 6.1% |
Unemployment in 2009:
| Shelburne: | 4.2% |
| New Hampshire: | 6.1% |
Unemployment in 2008:
| Shelburne: | 3.5% |
| New Hampshire: | 3.7% |
Unemployment in 2007:
| Shelburne: | 2.3% |
| New Hampshire: | 3.5% |
Unemployment in 2006:
| Shelburne: | 2.7% |
| New Hampshire: | 3.5% |
Unemployment in 2005:
| Shelburne: | 3.1% |
| New Hampshire: | 3.6% |
Unemployment in 2004:
| Shelburne: | 4.0% |
| New Hampshire: | 3.8% |
Unemployment in 2003:
| Shelburne: | 3.6% |
| New Hampshire: | 4.5% |
Unemployment in 2002:
| Shelburne: | 5.1% |
| New Hampshire: | 4.5% |
Unemployment in 2001:
| Shelburne: | 4.5% |
| New Hampshire: | 3.4% |
Unemployment in 2000:
| Shelburne: | 2.7% |
| New Hampshire: | 2.7% |
Unemployment in 1999:
| Shelburne: | 2.6% |
| New Hampshire: | 2.7% |
Unemployment in 1998:
| Shelburne: | 1.3% |
| New Hampshire: | 2.8% |
Unemployment in 1997:
| Shelburne: | 2.2% |
| New Hampshire: | 3.4% |
Unemployment in 1996:
| Shelburne: | 2.3% |
| New Hampshire: | 3.8% |
Unemployment in 1995:
| Shelburne: | 3.1% |
| New Hampshire: | 3.8% |
Unemployment in 1994:
| Shelburne: | 2.4% |
| New Hampshire: | 4.5% |
Unemployment in 1993:
| Shelburne: | 1.7% |
| New Hampshire: | 6.1% |
Unemployment in 1992:
| Shelburne: | 2.4% |
| New Hampshire: | 7.3% |
Unemployment in 1991:
| Shelburne: | 3.8% |
| New Hampshire: | 6.8% |
Unemployment in 1990:
| Shelburne: | 1.3% |
| New Hampshire: | 5.3% |
Time leaving home to go to work

<5am:
| Shelburne: | 1.0% (2) |
| New Hampshire: | 3.3% (20,948) |
5:30am:
| Shelburne: | 5.7% (12) |
| New Hampshire: | 3.1% (19,529) |
6am:
| Shelburne: | 1.0% (2) |
| New Hampshire: | 4.8% (30,560) |
6:30am:
| Shelburne: | 6.7% (14) |
| New Hampshire: | 8.7% (55,574) |
7am:
| Shelburne: | 7.6% (16) |
| New Hampshire: | 11.3% (72,142) |
7:30am:
| Shelburne: | 24.8% (52) |
| New Hampshire: | 14.7% (93,945) |
8am:
| Shelburne: | 17.1% (36) |
| New Hampshire: | 14.7% (93,766) |
8:30am:
| Shelburne: | 20.0% (42) |
| New Hampshire: | 10.7% (68,355) |
9am:
| Shelburne: | 0.5% (1) |
| New Hampshire: | 4.9% (31,547) |
10am:
| Shelburne: | 3.3% (7) |
| New Hampshire: | 4.4% (28,251) |
11am:
| Shelburne: | 5.7% (12) |
| New Hampshire: | 1.9% (12,237) |
4pm:
| Shelburne: | 5.2% (11) |
| New Hampshire: | 6.8% (43,620) |
>4pm:
| Shelburne: | 1.4% (3) |
| New Hampshire: | 5.8% (36,810) |
Travel time to work


Less than 5 minutes:
| Shelburne: | 6.7% (14) |
| New Hampshire: | 3.9% (24,932) |
5 to 9 minutes:
| Shelburne: | 17.1% (36) |
| New Hampshire: | 11.7% (74,466) |
10 to 14 minutes:
| Shelburne: | 11.9% (25) |
| New Hampshire: | 15.2% (97,185) |
15 to 19 minutes:
| Shelburne: | 11.0% (23) |
| New Hampshire: | 14.3% (91,417) |
20 to 24 minutes:
| Shelburne: | 12.9% (27) |
| New Hampshire: | 13.1% (83,562) |
25 to 29 minutes:
| Shelburne: | 9.0% (19) |
| New Hampshire: | 5.7% (36,290) |
30 to 34 minutes:
| Shelburne: | 16.7% (35) |
| New Hampshire: | 10.9% (69,722) |
40 to 44 minutes:
| Shelburne: | 5.7% (12) |
| New Hampshire: | 3.2% (20,648) |
45 to 59 minutes:
| Shelburne: | 6.2% (13) |
| New Hampshire: | 6.9% (44,234) |
60 to 89 minutes:
| Shelburne: | 1.4% (3) |
| New Hampshire: | 5.7% (36,458) |
90 or more minutes:
| Shelburne: | 1.4% (3) |
| New Hampshire: | 2.7% (17,126) |
Means of transportation to work

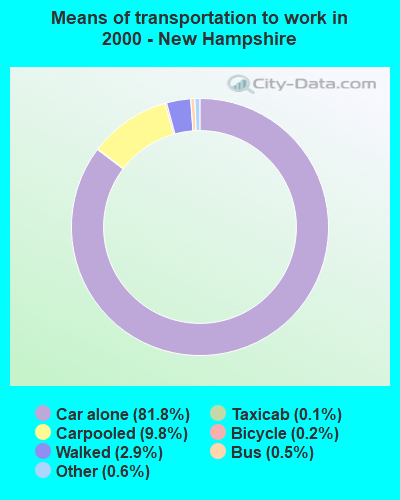
Drove car alone:
| Shelburne: | 86.2% (181) |
| New Hampshire: | 81.8% (522,043) |
Carpooled:
| Shelburne: | 10.0% (21) |
| New Hampshire: | 9.8% (62,763) |
Walked:
| Shelburne: | 3.8% (8) |
| New Hampshire: | 2.9% (18,545) |
Private vehicle occupancy

Drove alone:
| Shelburne: | 89.6% (181) |
| New Hampshire: | 89.3% (522,043) |
In 2 person carpool:
| Shelburne: | 10.4% (21) |
| New Hampshire: | 9.0% (52,861) |
Class of workers

Employee of private company:
| Shelburne: | 53.8% (113) |
| New Hampshire: | 68.4% (445,255) |
Self-employed in own incorporated business:
| Shelburne: | 3.3% (7) |
| New Hampshire: | 2.9% (18,595) |
Private not-for-profit wage and salary workers:
| Shelburne: | 13.3% (28) |
| New Hampshire: | 8.1% (52,725) |
Local government workers:
| Shelburne: | 9.0% (19) |
| New Hampshire: | 7.2% (46,607) |
State government workers:
| Shelburne: | 9.5% (20) |
| New Hampshire: | 3.3% (21,558) |
Federal government workers:
| Shelburne: | 4.8% (10) |
| New Hampshire: | 2.3% (15,106) |
Self-employed workers in own not incorporated business:
| Shelburne: | 6.2% (13) |
| New Hampshire: | 7.6% (49,520) |

Employee of private company - Males:
| Shelburne: | 67.3% (72) |
| New Hampshire: | 71.5% (246,493) |
Self-employed in own incorporated business - Males:
| Shelburne: | 4.7% (5) |
| New Hampshire: | 4.0% (13,714) |
Private not-for-profit wage and salary workers - Males:
| Shelburne: | 3.7% (4) |
| New Hampshire: | 4.7% (16,096) |
Local government workers - Males:
| Shelburne: | 3.7% (4) |
| New Hampshire: | 4.8% (16,494) |
State government workers - Males:
| Shelburne: | 8.4% (9) |
| New Hampshire: | 3.0% (10,226) |
Federal government workers - Males:
| Shelburne: | 4.7% (5) |
| New Hampshire: | 2.6% (8,801) |
Self-employed workers in own not incorporated business - Males:
| Shelburne: | 7.5% (8) |
| New Hampshire: | 9.3% (32,158) |

Employee of private company - Females:
| Shelburne: | 39.8% (41) |
| New Hampshire: | 64.9% (198,762) |
Self-employed in own incorporated business - Females:
| Shelburne: | 1.9% (2) |
| New Hampshire: | 1.6% (4,881) |
Private not-for-profit wage and salary workers - Females:
| Shelburne: | 23.3% (24) |
| New Hampshire: | 12.0% (36,629) |
Local government workers - Females:
| Shelburne: | 14.6% (15) |
| New Hampshire: | 9.8% (30,113) |
State government workers - Females:
| Shelburne: | 10.7% (11) |
| New Hampshire: | 3.7% (11,332) |
Federal government workers - Females:
| Shelburne: | 4.9% (5) |
| New Hampshire: | 2.1% (6,305) |
Self-employed workers in own not incorporated business - Females:
| Shelburne: | 4.9% (5) |
| New Hampshire: | 5.7% (17,362) |