Work and Jobs in Shiloh, South Carolina (SC) Detailed Stats
Data:
Unemployment (%)
Unemployment (% change since 2000)
Unemployment (%) - White
Unemployment (% change since 2000) - White
Unemployment (%) - Black or African American
Unemployment (% change since 2000) - Black or African American
Unemployment (%) - Asian
Unemployment (% change since 2000) - Asian
Unemployment (%) - Hispanic or Latino
Unemployment (% change since 2000) - Hispanic or Latino
Unemployment (%) - American Indian and Alaska Native
Unemployment (% change since 2000) - American Indian and Alaska Native
Unemployment (%) - Multirace
Unemployment (% change since 2000) - Multirace
Unemployment (%) - Other Race
Unemployment (% change since 2000) - Other Race
Industry diversity
Most Common Industries - Agriculture, forestry, fishing and hunting, and mining (%)
Most Common Industries - Agriculture, forestry, fishing and hunting (%)
Most Common Industries - Mining, quarrying, and oil and gas extraction (%)
Most Common Industries - Construction (%)
Most Common Industries - Manufacturing (%)
Most Common Industries - Wholesale trade (%)
Most Common Industries - Retail trade (%)
Most Common Industries - Transportation and warehousing, and utilities (%)
Most Common Industries - Transportation and warehousing (%)
Most Common Industries - Utilities (%)
Most Common Industries - Information (%)
Most Common Industries - Finance and insurance, and real estate and rental and leasing (%)
Most Common Industries - Finance and insurance (%)
Most Common Industries - Real estate and rental and leasing (%)
Most Common Industries - Professional, scientific, and management, and administrative and waste management services (%)
Most Common Industries - Professional, scientific, and technical services (%)
Most Common Industries - Management of companies and enterprises (%)
Most Common Industries - Administrative and support and waste management services (%)
Most Common Industries - Educational services, and health care and social assistance (%)
Most Common Industries - Educational services (%)
Most Common Industries - Health care and social assistance (%)
Most Common Industries - Arts, entertainment, and recreation, and accommodation and food services (%)
Most Common Industries - Arts, entertainment, and recreation (%)
Most Common Industries - Accommodation and food services (%)
Most Common Industries - Other services, except public administration (%)
Most Common Industries - Public administration (%)
Occupation diversity
Most Common Occupations - Management, business, science, and arts occupations (%)
Most Common Occupations - Management, business, and financial occupations (%)
Most Common Occupations - Management occupations (%)
Most Common Occupations - Business and financial operations occupations (%)
Most Common Occupations - Computer, engineering, and science occupations (%)
Most Common Occupations - Computer and mathematical occupations (%)
Most Common Occupations - Architecture and engineering occupations (%)
Most Common Occupations - Life, physical, and social science occupations (%)
Most Common Occupations - Education, legal, community service, arts, and media occupations (%)
Most Common Occupations - Community and social service occupations (%)
Most Common Occupations - Legal occupations (%)
Most Common Occupations - Education, training, and library occupations (%)
Most Common Occupations - Arts, design, entertainment, sports, and media occupations (%)
Most Common Occupations - Healthcare practitioners and technical occupations (%)
Most Common Occupations - Health diagnosing and treating practitioners and other technical occupations (%)
Most Common Occupations - Health technologists and technicians (%)
Most Common Occupations - Service occupations (%)
Most Common Occupations - Healthcare support occupations (%)
Most Common Occupations - Protective service occupations (%)
Most Common Occupations - Fire fighting and prevention, and other protective service workers including supervisors (%)
Most Common Occupations - Law enforcement workers including supervisors (%)
Most Common Occupations - Food preparation and serving related occupations (%)
Most Common Occupations - Building and grounds cleaning and maintenance occupations (%)
Most Common Occupations - Personal care and service occupations (%)
Most Common Occupations - Sales and office occupations (%)
Most Common Occupations - Sales and related occupations (%)
Most Common Occupations - Office and administrative support occupations (%)
Most Common Occupations - Natural resources, construction, and maintenance occupations (%)
Most Common Occupations - Farming, fishing, and forestry occupations (%)
Most Common Occupations - Construction and extraction occupations (%)
Most Common Occupations - Installation, maintenance, and repair occupations (%)
Most Common Occupations - Production, transportation, and material moving occupations (%)
Most Common Occupations - Production occupations (%)
Most Common Occupations - Transportation occupations (%)
Most Common Occupations - Material moving occupations (%)
Private vehicle occupancy - Drove alone (% change since 2000)
Private vehicle occupancy - Carpooled (%)
Private vehicle occupancy - Carpooled (% change since 2000)
Private vehicle occupancy - In 2-person carpool (%)
Private vehicle occupancy - In 2-person carpool (% change since 2000)
Private vehicle occupancy - In 3-person carpool (%)
Private vehicle occupancy - In 3-person carpool (% change since 2000)
Private vehicle occupancy - In 4-person carpool (%)
Private vehicle occupancy - In 4-person carpool (% change since 2000)
Private vehicle occupancy - In 5- or 6-person carpool (%)
Private vehicle occupancy - In 5- or 6-person carpool (% change since 2000)
Private vehicle occupancy - In 7-or-more-person carpool (%)
Private vehicle occupancy - In 7-or-more-person carpool (% change since 2000)
Time Leaving Home To Go To Work - 12:00 a.m. to 4:59 a.m. (%)
Time Leaving Home To Go To Work - 12:00 a.m. to 4:59 a.m. (% change since 2000)
Time Leaving Home To Go To Work - 5:00 a.m. to 5:59 a.m. (%)
Time Leaving Home To Go To Work - 5:00 a.m. to 5:59 a.m. (% change since 2000)
Time Leaving Home To Go To Work - 6:00 a.m. to 6:59 a.m. (%)
Time Leaving Home To Go To Work - 6:00 a.m. to 6:59 a.m. (% change since 2000)
Time Leaving Home To Go To Work - 7:00 a.m. to 7:59 a.m. (%)
Time Leaving Home To Go To Work - 7:00 a.m. to 7:59 a.m. (% change since 2000)
Time Leaving Home To Go To Work - 8:00 a.m. to 8:59 a.m. (%)
Time Leaving Home To Go To Work - 8:00 a.m. to 8:59 a.m. (% change since 2000)
Time Leaving Home To Go To Work - 9:00 a.m. to 9:59 a.m. (%)
Time Leaving Home To Go To Work - 9:00 a.m. to 9:59 a.m. (% change since 2000)
Time Leaving Home To Go To Work - 10:00 a.m. to 10:59 a.m. (%)
Time Leaving Home To Go To Work - 10:00 a.m. to 10:59 a.m. (% change since 2000)
Time Leaving Home To Go To Work - 11:00 a.m. to 11:59 a.m. (%)
Time Leaving Home To Go To Work - 11:00 a.m. to 11:59 a.m. (% change since 2000)
Time Leaving Home To Go To Work - 12:00 p.m. to 3:59 p.m. (%)
Time Leaving Home To Go To Work - 12:00 p.m. to 3:59 p.m. (% change since 2000)
Time Leaving Home To Go To Work - 4:00 p.m. to 11:59 p.m. (%)
Time Leaving Home To Go To Work - 4:00 p.m. to 11:59 p.m. (% change since 2000)
Class of Workers - Employee of private company (%)
Class of Workers - Employee of private company (% change since 2000)
Class of Workers - Self-employed in own incorporated business (%)
Class of Workers - Self-employed in own incorporated business (% change since 2000)
Class of Workers - Private not-for-profit wage and salary workers (%)
Class of Workers - Private not-for-profit wage and salary workers (% change since 2000)
Class of Workers - Local government workers (%)
Class of Workers - Local government workers (% change since 2000)
Class of Workers - State government workers (%)
Class of Workers - State government workers (% change since 2000)
Class of Workers - Federal government workers (%)
Class of Workers - Federal government workers (% change since 2000)
Class of Workers - Self-employed workers in own not incorporated business and Unpaid family workers (%)
Class of Workers - Self-employed workers in own not incorporated business and Unpaid family workers (% change since 2000)
Means of transportation to work - Drove car alone (%)
Means of transportation to work - Drove car alone (% change since 2000)
Means of transportation to work - Carpooled (%)
Means of transportation to work - Carpooled (% change since 2000)
Means of transportation to work - Public transportation (%)
Means of transportation to work - Public transportation (% change since 2000)
Means of transportation to work - Bus or trolley bus (%)
Means of transportation to work - Bus or trolley bus (% change since 2000)
Means of transportation to work - Streetcar or trolley car (%)
Means of transportation to work - Streetcar or trolley car (% change since 2000)
Means of transportation to work - Subway or elevated (%)
Means of transportation to work - Subway or elevated (% change since 2000)
Means of transportation to work - Railroad (%)
Means of transportation to work - Railroad (% change since 2000)
Means of transportation to work - Ferryboat (%)
Means of transportation to work - Ferryboat (% change since 2000)
Means of transportation to work - Taxicab (%)
Means of transportation to work - Taxicab (% change since 2000)
Means of transportation to work - Motorcycle (%)
Means of transportation to work - Motorcycle (% change since 2000)
Means of transportation to work - Bicycle (%)
Means of transportation to work - Bicycle (% change since 2000)
Means of transportation to work - Walked (%)
Means of transportation to work - Walked (% change since 2000)
Means of transportation to work - Other means (%)
Means of transportation to work - Other means (% change since 2000)
Working at home (%)
Working at home (% change since 2000)
Travel time to work - Less than 5 minutes (%)
Travel time to work - Less than 5 minutes (% change since 2000)
Travel time to work - 5 to 9 minutes (%)
Travel time to work - 5 to 9 minutes (% change since 2000)
Travel time to work - 10 to 19 minutes (%)
Travel time to work - 10 to 19 minutes (% change since 2000)
Travel time to work - 20 to 29 minutes (%)
Travel time to work - 20 to 29 minutes (% change since 2000)
Travel time to work - 30 to 39 minutes (%)
Travel time to work - 30 to 39 minutes (% change since 2000)
Travel time to work - 40 to 59 minutes (%)
Travel time to work - 40 to 59 minutes (% change since 2000)
Travel time to work - 60 to 89 minutes (%)
Travel time to work - 60 to 89 minutes (% change since 2000)
Travel time to work - 90 or more minutes (%)
Travel time to work - 90 or more minutes (% change since 2000)
Latest news about work in Shiloh, SC collected exclusively by city-data.com from local newspapers, TV, and radio stations
33.3% of workers work in Sumter County. 100.0% of workers are employees of private companies, which is 32.6% greater than the rate of 67.4% across the entire state of South Carolina.
Whole page based on the data from 2000 / 2022 when the population of Shiloh, South Carolina was 259 / 193
Unemployment in Shiloh Unemployment by race in 2022
Unemployment rate for White non-Hispanic residents 24.6% Females
Time leaving home to go to work 5:30 a.m. to 5:59 a.m.: Shiloh:
3.3% (4)South Carolina:
4.5% (97,139)
6:00 a.m. to 6:29 a.m.: Shiloh:
16.9% (20)South Carolina:
8.8% (190,089)
6:30 a.m. to 6:59 a.m.: Shiloh:
19.2% (23)South Carolina:
10.6% (229,373)
7:00 a.m. to 7:29 a.m.: Shiloh:
10.6% (13)South Carolina:
15.4% (332,988)
7:30 a.m. to 7:59 a.m.: Shiloh:
12.4% (15)South Carolina:
12.9% (278,683)
8:00 a.m. to 8:29 a.m.: Shiloh:
8.1% (10)South Carolina:
11.2% (243,383)
12:00 p.m. to 3:59 p.m.: Shiloh:
2.3% (3)South Carolina:
6.6% (143,789)
4:00 p.m. to 11:59 p.m.: Shiloh:
29.3% (35)South Carolina:
6.8% (147,267)
6am: Shiloh:
4.9% (6)South Carolina:
3.8% (68,753)
6:30am: Shiloh:
17.1% (21)South Carolina:
8.4% (153,907)
7:30am: Shiloh:
28.5% (35)South Carolina:
15.9% (289,937)
8am: Shiloh:
22.0% (27)South Carolina:
16.7% (305,268)
8:30am: Shiloh:
13.0% (16)South Carolina:
10.4% (189,373)
6:30 a.m. to 6:59 a.m. - Males: Shiloh:
6.1% (4)South Carolina:
10.5% (120,095)
7:30 a.m. to 7:59 a.m. - Males: Shiloh:
20.6% (13)South Carolina:
12.0% (137,813)
8:00 a.m. to 8:29 a.m. - Males: Shiloh:
17.5% (11)South Carolina:
10.8% (123,437)
12:00 p.m. to 3:59 p.m. - Males: Shiloh:
4.2% (3)South Carolina:
6.4% (72,956)
4:00 p.m. to 11:59 p.m. - Males: Shiloh:
63.5% (40)South Carolina:
6.8% (77,615)
5:30 a.m. to 5:59 a.m. - Females: Shiloh:
8.9% (5)South Carolina:
3.5% (35,379)
6:00 a.m. to 6:29 a.m. - Females: Shiloh:
37.3% (21)South Carolina:
7.1% (73,105)
6:30 a.m. to 6:59 a.m. - Females: Shiloh:
37.3% (21)South Carolina:
10.7% (109,278)
7:00 a.m. to 7:29 a.m. - Females: Shiloh:
20.6% (12)South Carolina:
16.3% (166,276)
Travel time to work Percentage of workers working in this county: 33.3%
5 to 9 minutes: Shiloh:
31.7% (39)South Carolina:
10.6% (193,658)
15 to 19 minutes: Shiloh:
13.0% (16)South Carolina:
17.1% (311,394)
30 to 34 minutes: Shiloh:
16.3% (20)South Carolina:
13.5% (246,792)
35 to 39 minutes: Shiloh:
4.9% (6)South Carolina:
2.5% (44,712)
45 to 59 minutes: Shiloh:
10.6% (13)South Carolina:
6.3% (114,459)
60 to 89 minutes: Shiloh:
8.9% (11)South Carolina:
3.4% (61,532)
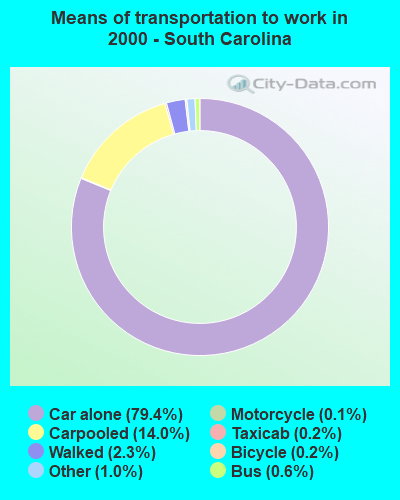
Means of transportation to work Drove car alone: Shiloh:
75.6% (93)South Carolina:
79.4% (1,447,338)
Carpooled: Shiloh:
9.8% (12)South Carolina:
14.0% (255,857)
Private vehicle occupancy Drove alone: Shiloh:
99.6% (112)South Carolina:
90.0% (1,869,768)
Drove alone: Shiloh:
88.6% (93)South Carolina:
85.0% (1,447,338)
In 2 person carpool: Shiloh:
5.7% (6)South Carolina:
11.0% (187,418)
In 3 person carpool: Shiloh:
5.7% (6)South Carolina:
2.4% (40,124)
Class of workers
Employee of private company: Shiloh:
100.0% (122)South Carolina:
67.4% (1,654,283)
Employee of private company: Shiloh:
62.6% (77)South Carolina:
70.4% (1,284,199)
Local government workers: Shiloh:
8.9% (11)South Carolina:
5.4% (99,319)
Federal government workers: Shiloh:
6.5% (8)South Carolina:
2.4% (43,164)
Self-employed workers in own not incorporated business: Shiloh:
22.0% (27)South Carolina:
5.7% (104,649)
Employee of private company - Males: Shiloh:
100.0% (66)South Carolina:
70.5% (888,497)
Employee of private company - Females: Shiloh:
100.0% (56)South Carolina:
64.2% (765,786)