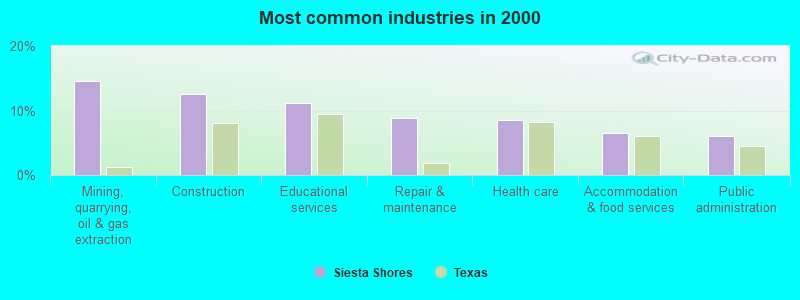
The most common industries in Siesta Shores are: Mining, quarrying, oil & gas extraction (14.6% of civilian employees), Construction (12.5% of civilian employees), Educational services (11.2% of civilian employees). 81.0% of workers work in Zapata County and 11.1% of all workers work at home. 49.4% of workers are employees of private companies, which is 40.7% less than the rate of 69.6% across the entire state of Texas.
Whole page based on the data from 2000 / 2022 when the population of Siesta Shores, Texas was 890 / 1,663
Most common industries
Most common industries
Industry
All
Males
Females
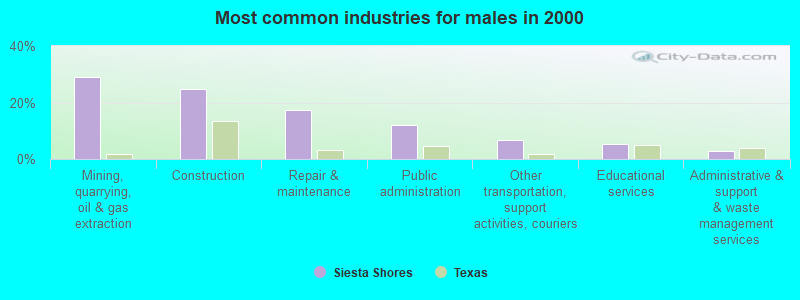
Mining, quarrying, and oil and gas extraction
14.6% (43)
28.9% (43)
0.0% (0)
Construction
12.5% (37)
24.8% (37)
0.0% (0)
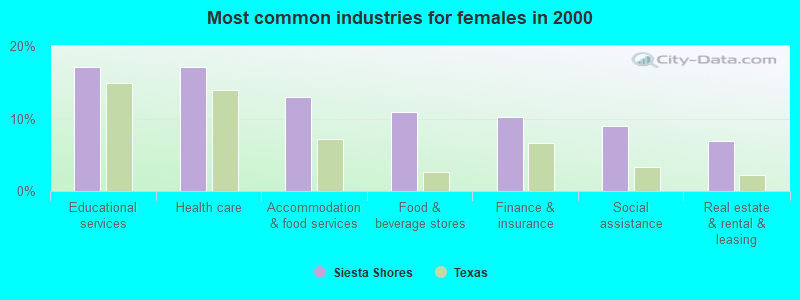
Educational services
11.2% (33)
5.4% (8)
17.1% (25)
Repair and maintenance
8.8% (26)
17.4% (26)
0.0% (0)
Health care
8.5% (25)
0.0% (0)
17.1% (25)
Accommodation and food services
6.4% (19)
0.0% (0)
13.0% (19)
Public administration
6.1% (18)
12.1% (18)
0.0% (0)
Other transportation, and support activities, and couriers
6.1% (18)
6.7% (10)
5.5% (8)
Finance and insurance
6.1% (18)
2.0% (3)
10.3% (15)
Food and beverage stores
5.4% (16)
0.0% (0)
11.0% (16)
Social assistance
4.4% (13)
0.0% (0)
8.9% (13)
Real estate and rental and leasing
3.4% (10)
0.0% (0)
6.8% (10)
Data processing, libraries, and other information services
2.7% (8)
0.0% (0)
5.5% (8)
Personal and laundry services
2.4% (7)
0.0% (0)
4.8% (7)
Administrative and support and waste management services
1.4% (4)
2.7% (4)
0.0% (0)
Unemployment in Siesta Shores
Unemployment by race in 2022
Unemployment rate for Hispanic or Latino residents
19.8%Males
Unemployment by race in 2000
Unemployment rate for White non-Hispanic residents
34.8%Males
Time leaving home to go to work
12:00 a.m. to 4:59 a.m.:
Siesta Shores:
14.4% (56)
Texas:
5.5% (678,264)
5:30 a.m. to 5:59 a.m.:
Siesta Shores:
1.3% (5)
Texas:
4.9% (603,953)
6:00 a.m. to 6:29 a.m.:
Siesta Shores:
17.5% (68)
Texas:
9.4% (1,155,020)
7:00 a.m. to 7:29 a.m.:
Siesta Shores:
6.7% (26)
Texas:
15.3% (1,885,477)
7:30 a.m. to 7:59 a.m.:
Siesta Shores:
37.6% (145)
Texas:
11.9% (1,469,628)
8:00 a.m. to 8:29 a.m.:
Siesta Shores:
14.4% (55)
Texas:
11.3% (1,400,175)
9:00 a.m. to 9:59 a.m.:
Siesta Shores:
6.4% (25)
Texas:
6.7% (829,367)
4:00 p.m. to 11:59 p.m.:
Siesta Shores:
2.4% (9)
Texas:
6.3% (777,072)
<5am:
Siesta Shores:
16.9% (49)
Texas:
3.1% (281,361)
6am:
Siesta Shores:
5.2% (15)
Texas:
4.4% (403,423)
6:30am:
Siesta Shores:
8.3% (24)
Texas:
8.8% (808,876)
7am:
Siesta Shores:
2.4% (7)
Texas:
10.7% (976,557)
7:30am:
Siesta Shores:
8.3% (24)
Texas:
16.4% (1,500,904)
8am:
Siesta Shores:
13.8% (40)
Texas:
16.8% (1,536,308)
8:30am:
Siesta Shores:
20.7% (60)
Texas:
10.0% (913,601)
9am:
Siesta Shores:
5.2% (15)
Texas:
4.4% (398,656)
10am:
Siesta Shores:
2.1% (6)
Texas:
5.2% (472,592)
11am:
Siesta Shores:
5.5% (16)
Texas:
2.2% (197,844)
4pm:
Siesta Shores:
8.3% (24)
Texas:
5.5% (503,565)
>4pm:
Siesta Shores:
1.0% (3)
Texas:
6.1% (563,107)
12:00 a.m. to 4:59 a.m. - Males:
Siesta Shores:
19.7% (55)
Texas:
7.0% (477,284)
5:30 a.m. to 5:59 a.m. - Males:
Siesta Shores:
1.7% (5)
Texas:
5.9% (402,788)
6:00 a.m. to 6:29 a.m. - Males:
Siesta Shores:
24.0% (67)
Texas:
10.9% (751,118)
7:00 a.m. to 7:29 a.m. - Males:
Siesta Shores:
9.1% (25)
Texas:
14.1% (970,598)
7:30 a.m. to 7:59 a.m. - Males:
Siesta Shores:
32.9% (92)
Texas:
10.2% (696,429)
8:00 a.m. to 8:29 a.m. - Males:
Siesta Shores:
9.1% (25)
Texas:
10.6% (729,041)
4:00 p.m. to 11:59 p.m. - Males:
Siesta Shores:
3.3% (9)
Texas:
6.4% (435,950)
7:30 a.m. to 7:59 a.m. - Females:
Siesta Shores:
49.8% (53)
Texas:
14.1% (773,199)
8:00 a.m. to 8:29 a.m. - Females:
Siesta Shores:
28.1% (30)
Texas:
12.2% (671,134)
9:00 a.m. to 9:59 a.m. - Females:
Siesta Shores:
23.6% (25)
Texas:
7.8% (428,296)
Travel time to work
Percentage of workers working in this county: 81.0% Number of people working at home: 50 (11.1% of all workers)
5 to 9 minutes:
Siesta Shores:
13.1% (38)
Texas:
10.3% (942,891)
10 to 14 minutes:
Siesta Shores:
29.3% (85)
Texas:
14.4% (1,317,555)
15 to 19 minutes:
Siesta Shores:
22.1% (64)
Texas:
16.0% (1,467,945)
20 to 24 minutes:
Siesta Shores:
4.1% (12)
Texas:
13.9% (1,276,781)
30 to 34 minutes:
Siesta Shores:
5.5% (16)
Texas:
14.3% (1,309,699)
60 to 89 minutes:
Siesta Shores:
11.7% (34)
Texas:
4.6% (418,905)
90 or more minutes:
Siesta Shores:
11.7% (34)
Texas:
2.4% (218,800)
Means of transportation to work
Drove car alone:
Siesta Shores:
75.9% (220)
Texas:
77.7% (7,115,590)
Carpooled:
Siesta Shores:
21.7% (63)
Texas:
14.5% (1,326,012)
Private vehicle occupancy
Drove alone:
Siesta Shores:
67.1% (247)
Texas:
87.6% (10,283,021)
In 2 person carpool:
Siesta Shores:
8.5% (31)
Texas:
9.0% (1,052,595)
In 3 person carpool:
Siesta Shores:
15.8% (58)
Texas:
2.1% (244,139)
In 5-6 person carpool:
Siesta Shores:
8.6% (32)
Texas:
0.4% (44,947)
Drove alone:
Siesta Shores:
77.7% (220)
Texas:
84.3% (7,115,590)
In 2 person carpool:
Siesta Shores:
19.1% (54)
Texas:
11.6% (982,994)
In 3 person carpool:
Siesta Shores:
3.2% (9)
Texas:
2.4% (201,602)
Class of workers
Employee of private company:
Siesta Shores:
49.4% (223)
Texas:
69.6% (10,139,666)
Local government workers:
Siesta Shores:
19.5% (88)
Texas:
7.6% (1,109,799)
Self-employed workers in own not incorporated business:
Siesta Shores:
31.1% (140)
Texas:
6.8% (998,270)
Employee of private company:
Siesta Shores:
41.4% (122)
Texas:
69.6% (6,425,274)
Self-employed in own incorporated business:
Siesta Shores:
8.8% (26)
Texas:
2.7% (250,864)
Private not-for-profit wage and salary workers:
Siesta Shores:
10.2% (30)
Texas:
5.7% (526,631)
Local government workers:
Siesta Shores:
7.8% (23)
Texas:
6.6% (608,479)
State government workers:
Siesta Shores:
10.2% (30)
Texas:
5.4% (501,082)
Federal government workers:
Siesta Shores:
2.4% (7)
Texas:
2.6% (237,177)
Self-employed workers in own not incorporated business:
Siesta Shores:
19.3% (57)
Texas:
7.1% (653,527)
Employee of private company - Males:
Siesta Shores:
55.8% (187)
Texas:
73.1% (5,788,450)
Local government workers - Males:
Siesta Shores:
18.8% (63)
Texas:
5.1% (405,467)
Self-employed workers in own not incorporated business - Males:
Siesta Shores:
25.4% (85)
Texas:
7.7% (609,246)
Employee of private company - Females:
Siesta Shores:
31.2% (37)
Texas:
65.4% (4,351,216)
Local government workers - Females:
Siesta Shores:
21.4% (25)
Texas:
10.6% (704,332)
Self-employed workers in own not incorporated business - Females:
Siesta Shores:
47.3% (56)
Texas:
5.8% (389,024)
Discuss Siesta Shores, Texas (TX) on our hugely popular Texas forum.