Work and Jobs in Simonton, Texas (TX) Detailed Stats
Occupations, Industries, Unemployment, Workers, Commute
Settings
X


Recent posts about work in Simonton, Texas on our local forum with over 2,400,000 registered users:
 | Where do all the Texans live around Katy/Fulshear? (53 replies) |
| Husband's new job is in Houston, we want to live in the country (32 replies) |
| New community in Fulshear: Polo Ranch (24 replies) |
| Katy/Cypress flood zones (30 replies) |
| California Style Mexican Food in Houston (155 replies) |
| University of Houston vs Texas A&M (70 replies) |
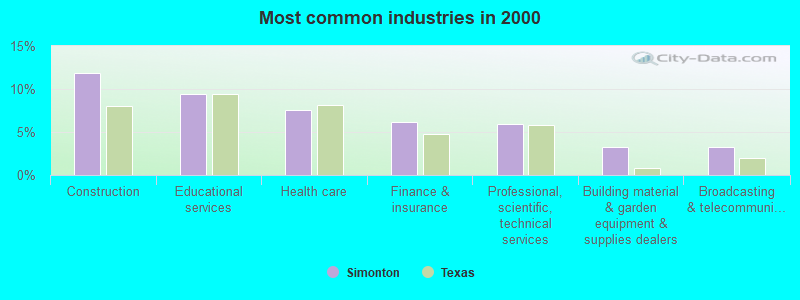
The most common industries in Simonton are: Construction (11.8% of civilian employees), Educational services (9.4% of civilian employees), Health care (7.5% of civilian employees). 51.5% of workers work in Fort Bend County and 15.7% of all workers work at home. 62.4% of workers are employees of private companies, which is 11.5% less than the rate of 69.6% across the entire state of Texas.
Whole page based on the data from 2000 / 2022 when the population of Simonton, Texas was 718 / 914
Whole page based on the data from 2000 / 2022 when the population of Simonton, Texas was 718 / 914
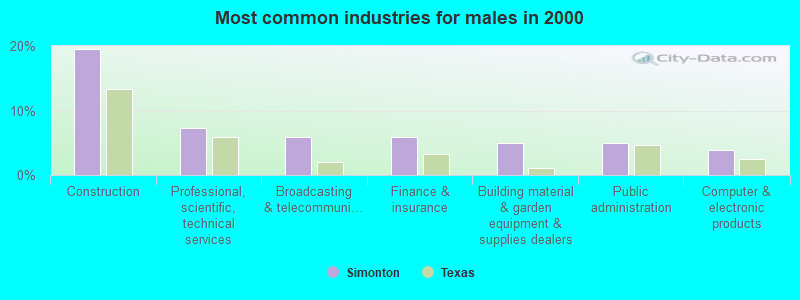
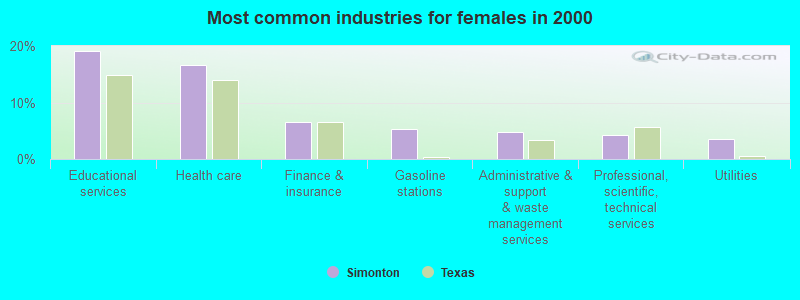
Most common industries
Most common industries | |||
|---|---|---|---|
Industry | All | Males | Females |
| Construction | 11.8% (44) | 19.6% (40) | 2.4% (4) |
| Educational services | 9.4% (35) | 1.5% (3) | 19.0% (32) |
| Health care | 7.5% (28) | 0.0% (0) | 16.7% (28) |
| Finance and insurance | 6.2% (23) | 5.9% (12) | 6.5% (11) |
| Professional, scientific, and technical services | 5.9% (22) | 7.4% (15) | 4.2% (7) |
| Building material and garden equipment and supplies dealers | 3.2% (12) | 4.9% (10) | 1.2% (2) |
| Broadcasting and telecommunications | 3.2% (12) | 5.9% (12) | 0.0% (0) |
| Mining, quarrying, and oil and gas extraction | 3.0% (11) | 3.4% (7) | 2.4% (4) |
| Utilities | 3.0% (11) | 2.5% (5) | 3.6% (6) |
| Petroleum and coal products | 2.7% (10) | 2.5% (5) | 3.0% (5) |
| Administrative and support and waste management services | 2.7% (10) | 1.0% (2) | 4.8% (8) |
| Public administration | 2.7% (10) | 4.9% (10) | 0.0% (0) |
| Gasoline stations | 2.4% (9) | 0.0% (0) | 5.4% (9) |
| Computer and electronic products | 2.2% (8) | 3.9% (8) | 0.0% (0) |
| Motor vehicle and parts dealers | 2.2% (8) | 3.9% (8) | 0.0% (0) |
| Food | 1.9% (7) | 2.0% (4) | 1.8% (3) |
| Petroleum and petroleum products merchant wholesalers | 1.9% (7) | 2.0% (4) | 1.8% (3) |
| Miscellaneous manufacturing | 1.9% (7) | 2.5% (5) | 1.2% (2) |
| Real estate and rental and leasing | 1.9% (7) | 1.0% (2) | 3.0% (5) |
| Food and beverage stores | 1.9% (7) | 1.5% (3) | 2.4% (4) |
| Metal and metal products | 1.6% (6) | 2.9% (6) | 0.0% (0) |
| U. S. Postal service | 1.6% (6) | 1.5% (3) | 1.8% (3) |
| Accommodation and food services | 1.3% (5) | 0.0% (0) | 3.0% (5) |
| Furniture and home furnishings, and household appliance stores | 1.3% (5) | 1.5% (3) | 1.2% (2) |
| Repair and maintenance | 1.3% (5) | 2.5% (5) | 0.0% (0) |
| Used merchandise, gift, novelty, and souvenir, and other miscellaneous stores | 1.1% (4) | 0.0% (0) | 2.4% (4) |
| Machinery | 1.1% (4) | 1.0% (2) | 1.2% (2) |
| Social assistance | 1.1% (4) | 0.0% (0) | 2.4% (4) |
| Data processing, libraries, and other information services | 1.1% (4) | 1.0% (2) | 1.2% (2) |
| Personal and laundry services | 1.1% (4) | 2.0% (4) | 0.0% (0) |
| Office supplies and stationery stores | 1.1% (4) | 1.0% (2) | 1.2% (2) |
| Groceries and related products merchant wholesalers | 0.8% (3) | 1.5% (3) | 0.0% (0) |
| Metals and minerals, except petroleum, merchant wholesalers | 0.8% (3) | 0.0% (0) | 1.8% (3) |
| Department and other general merchandise stores | 0.8% (3) | 0.0% (0) | 1.8% (3) |
| Apparel, fabrics, and notions merchant wholesalers | 0.8% (3) | 0.0% (0) | 1.8% (3) |
| Pharmacies and drug stores | 0.5% (2) | 1.0% (2) | 0.0% (0) |
| Clothing and accessories, including shoe, stores | 0.5% (2) | 1.0% (2) | 0.0% (0) |
| Jewelry, luggage, and leather goods stores | 0.5% (2) | 0.0% (0) | 1.2% (2) |
| Music stores | 0.5% (2) | 1.0% (2) | 0.0% (0) |
| Publishing, and motion picture and sound recording industries | 0.5% (2) | 1.0% (2) | 0.0% (0) |
| Private households | 0.5% (2) | 1.0% (2) | 0.0% (0) |
| Furniture and related product manufacturing | 0.5% (2) | 1.0% (2) | 0.0% (0) |
| Professional and commercial equipment and supplies merchant wholesalers | 0.5% (2) | 1.0% (2) | 0.0% (0) |
| Machinery, equipment, and supplies merchant wholesalers | 0.5% (2) | 1.0% (2) | 0.0% (0) |
| Truck transportation | 0.5% (2) | 1.0% (2) | 0.0% (0) |
| Religious, grantmaking, civic, professional, and similar organizations | 0.3% (1) | 0.5% (1) | 0.0% (0) |
Unemployment in Simonton
- Unemployment by race in 2022
- Unemployment rate for White non-Hispanic residents
- 1.8%Females
- Unemployment rate for two or more race residents
- 7.7%Males
- Unemployment by race in 2000
- Unemployment rate for White non-Hispanic residents
- 4.2%Males
- 2.5%Females
Time leaving home to go to work

12:00 a.m. to 4:59 a.m.:
| Simonton: | 4.4% (15) |
| Texas: | 5.5% (678,264) |
5:00 a.m. to 5:29 a.m.:
| Simonton: | 4.2% (14) |
| Texas: | 4.3% (525,841) |
5:30 a.m. to 5:59 a.m.:
| Simonton: | 4.8% (16) |
| Texas: | 4.9% (603,953) |
6:00 a.m. to 6:29 a.m.:
| Simonton: | 6.0% (20) |
| Texas: | 9.4% (1,155,020) |
6:30 a.m. to 6:59 a.m.:
| Simonton: | 8.7% (30) |
| Texas: | 9.3% (1,152,822) |
7:00 a.m. to 7:29 a.m.:
| Simonton: | 19.8% (68) |
| Texas: | 15.3% (1,885,477) |
7:30 a.m. to 7:59 a.m.:
| Simonton: | 3.2% (11) |
| Texas: | 11.9% (1,469,628) |
8:00 a.m. to 8:29 a.m.:
| Simonton: | 22.4% (77) |
| Texas: | 11.3% (1,400,175) |
8:30 a.m. to 8:59 a.m.:
| Simonton: | 4.4% (15) |
| Texas: | 4.9% (599,574) |
9:00 a.m. to 9:59 a.m.:
| Simonton: | 4.2% (15) |
| Texas: | 6.7% (829,367) |
10:00 a.m. to 10:59 a.m.:
| Simonton: | 8.1% (28) |
| Texas: | 3.2% (390,354) |
11:00 a.m. to 11:59 a.m.:
| Simonton: | 3.3% (11) |
| Texas: | 1.3% (162,330) |
12:00 p.m. to 3:59 p.m.:
| Simonton: | 1.8% (6) |
| Texas: | 5.8% (720,594) |
4:00 p.m. to 11:59 p.m.:
| Simonton: | 3.0% (10) |
| Texas: | 6.3% (777,072) |

<5am:
| Simonton: | 1.9% (7) |
| Texas: | 3.1% (281,361) |
5:30am:
| Simonton: | 5.4% (20) |
| Texas: | 2.9% (262,060) |
6am:
| Simonton: | 11.3% (42) |
| Texas: | 4.4% (403,423) |
6:30am:
| Simonton: | 14.0% (52) |
| Texas: | 8.8% (808,876) |
7am:
| Simonton: | 13.2% (49) |
| Texas: | 10.7% (976,557) |
7:30am:
| Simonton: | 17.7% (66) |
| Texas: | 16.4% (1,500,904) |
8am:
| Simonton: | 7.5% (28) |
| Texas: | 16.8% (1,536,308) |
8:30am:
| Simonton: | 10.8% (40) |
| Texas: | 10.0% (913,601) |
9am:
| Simonton: | 1.9% (7) |
| Texas: | 4.4% (398,656) |
10am:
| Simonton: | 3.8% (14) |
| Texas: | 5.2% (472,592) |
12pm:
| Simonton: | 0.8% (3) |
| Texas: | 0.9% (86,997) |
4pm:
| Simonton: | 4.8% (18) |
| Texas: | 5.5% (503,565) |
>4pm:
| Simonton: | 1.6% (6) |
| Texas: | 6.1% (563,107) |

5:00 a.m. to 5:29 a.m. - Males:
| Simonton: | 3.3% (7) |
| Texas: | 5.8% (394,876) |
5:30 a.m. to 5:59 a.m. - Males:
| Simonton: | 8.1% (16) |
| Texas: | 5.9% (402,788) |
6:00 a.m. to 6:29 a.m. - Males:
| Simonton: | 8.1% (16) |
| Texas: | 10.9% (751,118) |
6:30 a.m. to 6:59 a.m. - Males:
| Simonton: | 5.9% (12) |
| Texas: | 9.5% (652,306) |
7:00 a.m. to 7:29 a.m. - Males:
| Simonton: | 7.9% (16) |
| Texas: | 14.1% (970,598) |
7:30 a.m. to 7:59 a.m. - Males:
| Simonton: | 5.2% (10) |
| Texas: | 10.2% (696,429) |
8:00 a.m. to 8:29 a.m. - Males:
| Simonton: | 31.6% (64) |
| Texas: | 10.6% (729,041) |
8:30 a.m. to 8:59 a.m. - Males:
| Simonton: | 8.0% (16) |
| Texas: | 4.1% (281,762) |
9:00 a.m. to 9:59 a.m. - Males:
| Simonton: | 6.1% (12) |
| Texas: | 5.8% (401,071) |
10:00 a.m. to 10:59 a.m. - Males:
| Simonton: | 1.4% (3) |
| Texas: | 2.7% (186,469) |
11:00 a.m. to 11:59 a.m. - Males:
| Simonton: | 2.6% (5) |
| Texas: | 1.2% (82,242) |
12:00 p.m. to 3:59 p.m. - Males:
| Simonton: | 1.1% (2) |
| Texas: | 5.8% (397,795) |
4:00 p.m. to 11:59 p.m. - Males:
| Simonton: | 5.8% (12) |
| Texas: | 6.4% (435,950) |

12:00 a.m. to 4:59 a.m. - Females:
| Simonton: | 8.7% (12) |
| Texas: | 3.7% (200,980) |
5:00 a.m. to 5:29 a.m. - Females:
| Simonton: | 2.6% (4) |
| Texas: | 2.4% (130,965) |
6:00 a.m. to 6:29 a.m. - Females:
| Simonton: | 3.2% (4) |
| Texas: | 7.4% (403,902) |
6:30 a.m. to 6:59 a.m. - Females:
| Simonton: | 12.6% (18) |
| Texas: | 9.1% (500,516) |
7:00 a.m. to 7:29 a.m. - Females:
| Simonton: | 39.1% (55) |
| Texas: | 16.7% (914,879) |
8:00 a.m. to 8:29 a.m. - Females:
| Simonton: | 8.5% (12) |
| Texas: | 12.2% (671,134) |
9:00 a.m. to 9:59 a.m. - Females:
| Simonton: | 1.6% (2) |
| Texas: | 7.8% (428,296) |
10:00 a.m. to 10:59 a.m. - Females:
| Simonton: | 17.7% (25) |
| Texas: | 3.7% (203,885) |
11:00 a.m. to 11:59 a.m. - Females:
| Simonton: | 4.2% (6) |
| Texas: | 1.5% (80,088) |
12:00 p.m. to 3:59 p.m. - Females:
| Simonton: | 3.1% (4) |
| Texas: | 5.9% (322,799) |
Travel time to work
Percentage of workers working in this county: 51.5%
Number of people working at home: 65 (15.7% of all workers)
Number of people working at home: 65 (15.7% of all workers)


Less than 5 minutes:
| Simonton: | 3.8% (14) |
| Texas: | 3.0% (277,642) |
5 to 9 minutes:
| Simonton: | 5.4% (20) |
| Texas: | 10.3% (942,891) |
10 to 14 minutes:
| Simonton: | 2.7% (10) |
| Texas: | 14.4% (1,317,555) |
15 to 19 minutes:
| Simonton: | 9.1% (34) |
| Texas: | 16.0% (1,467,945) |
20 to 24 minutes:
| Simonton: | 1.1% (4) |
| Texas: | 13.9% (1,276,781) |
25 to 29 minutes:
| Simonton: | 3.2% (12) |
| Texas: | 5.3% (482,838) |
30 to 34 minutes:
| Simonton: | 11.3% (42) |
| Texas: | 14.3% (1,309,699) |
35 to 39 minutes:
| Simonton: | 3.2% (12) |
| Texas: | 2.4% (219,873) |
40 to 44 minutes:
| Simonton: | 2.4% (9) |
| Texas: | 3.1% (280,916) |
45 to 59 minutes:
| Simonton: | 24.5% (91) |
| Texas: | 7.6% (692,006) |
60 to 89 minutes:
| Simonton: | 25.3% (94) |
| Texas: | 4.6% (418,905) |
90 or more minutes:
| Simonton: | 2.7% (10) |
| Texas: | 2.4% (218,800) |
Means of transportation to work


Drove car alone:
| Simonton: | 80.4% (299) |
| Texas: | 77.7% (7,115,590) |
Carpooled:
| Simonton: | 13.4% (50) |
| Texas: | 14.5% (1,326,012) |
Motorcycle:
| Simonton: | 0.8% (3) |
| Texas: | 0.1% (12,068) |
Private vehicle occupancy

Drove alone:
| Simonton: | 89.5% (303) |
| Texas: | 87.6% (10,283,021) |
In 2 person carpool:
| Simonton: | 9.4% (32) |
| Texas: | 9.0% (1,052,595) |

Drove alone:
| Simonton: | 85.7% (299) |
| Texas: | 84.3% (7,115,590) |
In 2 person carpool:
| Simonton: | 11.2% (39) |
| Texas: | 11.6% (982,994) |
In 4 person carpool:
| Simonton: | 2.3% (8) |
| Texas: | 1.0% (83,518) |
In 5-6 person carpool:
| Simonton: | 0.9% (3) |
| Texas: | 0.5% (40,662) |
Class of workers

Employee of private company:
| Simonton: | 62.4% (259) |
| Texas: | 69.6% (10,139,666) |
Self-employed in own incorporated business:
| Simonton: | 3.7% (15) |
| Texas: | 3.5% (516,446) |
Private not-for-profit wage and salary workers:
| Simonton: | 6.9% (29) |
| Texas: | 6.0% (870,454) |
Local government workers:
| Simonton: | 6.9% (29) |
| Texas: | 7.6% (1,109,799) |
Federal government workers:
| Simonton: | 2.1% (9) |
| Texas: | 2.5% (357,298) |
Self-employed workers in own not incorporated business:
| Simonton: | 16.8% (70) |
| Texas: | 6.8% (998,270) |
Unpaid family workers:
| Simonton: | 1.1% (4) |
| Texas: | 0.2% (27,882) |

Employee of private company:
| Simonton: | 69.9% (260) |
| Texas: | 69.6% (6,425,274) |
Self-employed in own incorporated business:
| Simonton: | 5.9% (22) |
| Texas: | 2.7% (250,864) |
Private not-for-profit wage and salary workers:
| Simonton: | 4.8% (18) |
| Texas: | 5.7% (526,631) |
Local government workers:
| Simonton: | 7.8% (29) |
| Texas: | 6.6% (608,479) |
State government workers:
| Simonton: | 1.1% (4) |
| Texas: | 5.4% (501,082) |
Federal government workers:
| Simonton: | 1.6% (6) |
| Texas: | 2.6% (237,177) |
Self-employed workers in own not incorporated business:
| Simonton: | 7.0% (26) |
| Texas: | 7.1% (653,527) |
Unpaid family workers:
| Simonton: | 1.9% (7) |
| Texas: | 0.3% (31,338) |

Employee of private company - Males:
| Simonton: | 64.5% (145) |
| Texas: | 73.1% (5,788,450) |
Self-employed in own incorporated business - Males:
| Simonton: | 4.9% (11) |
| Texas: | 4.2% (332,655) |
Private not-for-profit wage and salary workers - Males:
| Simonton: | 6.4% (14) |
| Texas: | 4.1% (323,476) |
Local government workers - Males:
| Simonton: | 3.9% (9) |
| Texas: | 5.1% (405,467) |
Federal government workers - Males:
| Simonton: | 3.9% (9) |
| Texas: | 2.7% (211,629) |
Self-employed workers in own not incorporated business - Males:
| Simonton: | 15.3% (34) |
| Texas: | 7.7% (609,246) |
Unpaid family workers - Males:
| Simonton: | 1.0% (2) |
| Texas: | 0.2% (12,606) |

Employee of private company - Females:
| Simonton: | 59.9% (114) |
| Texas: | 65.4% (4,351,216) |
Self-employed in own incorporated business - Females:
| Simonton: | 2.3% (4) |
| Texas: | 2.8% (183,791) |
Private not-for-profit wage and salary workers - Females:
| Simonton: | 7.6% (14) |
| Texas: | 8.2% (546,978) |
Local government workers - Females:
| Simonton: | 10.5% (20) |
| Texas: | 10.6% (704,332) |
Self-employed workers in own not incorporated business - Females:
| Simonton: | 18.6% (35) |
| Texas: | 5.8% (389,024) |
Unpaid family workers - Females:
| Simonton: | 1.2% (2) |
| Texas: | 0.2% (15,276) |