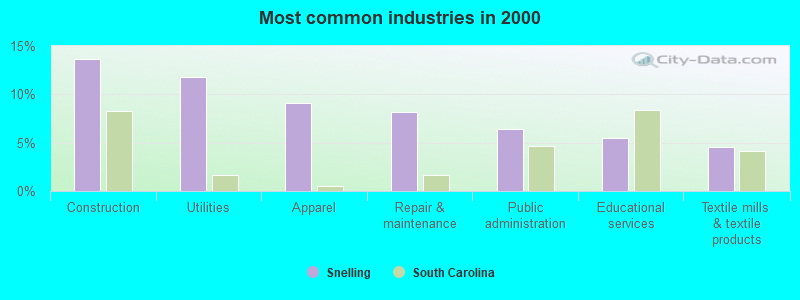
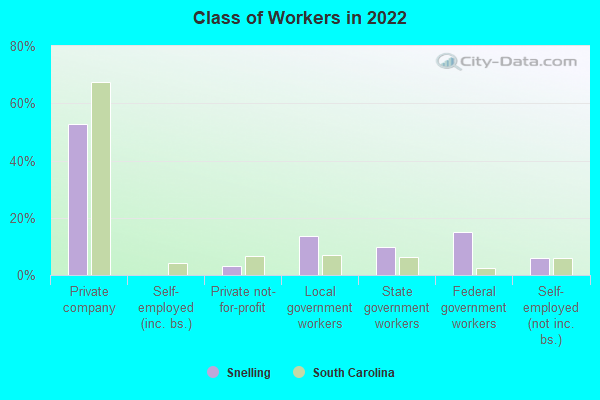
The most common industries in Snelling are: Construction (13.6% of civilian employees), Utilities (11.8% of civilian employees), Apparel (9.1% of civilian employees). 65.4% of workers work in Barnwell County and 1.5% of all workers work at home. 52.6% of workers are employees of private companies, which is 28.1% less than the rate of 67.4% across the entire state of South Carolina.
Whole page based on the data from 2000 / 2022 when the population of Snelling, South Carolina was 246 / 269
Most common industries
Most common industries
Industry
All
Males
Females
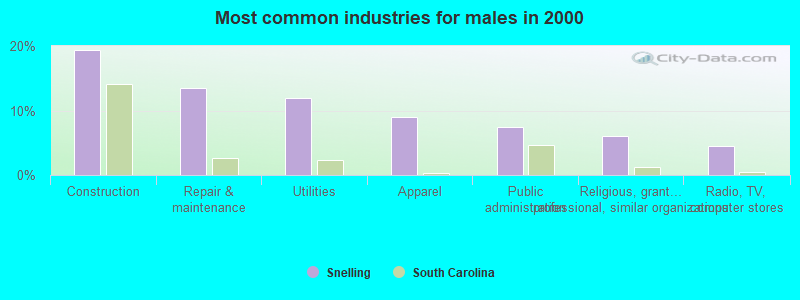
Construction
13.6% (15)
19.4% (13)
4.7% (2)
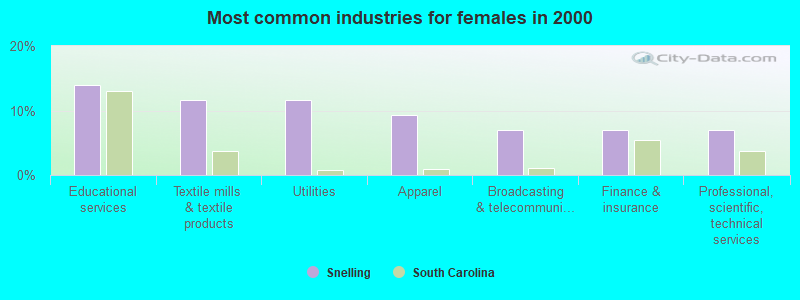
Utilities
11.8% (13)
11.9% (8)
11.6% (5)
Apparel
9.1% (10)
9.0% (6)
9.3% (4)
Repair and maintenance
8.2% (9)
13.4% (9)
0.0% (0)
Public administration
6.4% (7)
7.5% (5)
4.7% (2)
Educational services
5.5% (6)
0.0% (0)
14.0% (6)
Textile mills and textile products
4.5% (5)
0.0% (0)
11.6% (5)
Broadcasting and telecommunications
4.5% (5)
3.0% (2)
7.0% (3)
Professional, scientific, and technical services
4.5% (5)
3.0% (2)
7.0% (3)
Metal and metal products
3.6% (4)
3.0% (2)
4.7% (2)
Religious, grantmaking, civic, professional, and similar organizations
3.6% (4)
6.0% (4)
0.0% (0)
Nonmetallic mineral products
2.7% (3)
4.5% (3)
0.0% (0)
Wood products
2.7% (3)
4.5% (3)
0.0% (0)
Radio, TV, and computer stores
2.7% (3)
4.5% (3)
0.0% (0)
Finance and insurance
2.7% (3)
0.0% (0)
7.0% (3)
Plastics and rubber products
1.8% (2)
3.0% (2)
0.0% (0)
Machinery
1.8% (2)
3.0% (2)
0.0% (0)
Motor vehicle and parts dealers
1.8% (2)
3.0% (2)
0.0% (0)
Miscellaneous manufacturing
1.8% (2)
0.0% (0)
4.7% (2)
Truck transportation
1.8% (2)
0.0% (0)
4.7% (2)
Clothing and accessories, including shoe, stores
1.8% (2)
0.0% (0)
4.7% (2)
Other direct selling establishments
1.8% (2)
0.0% (0)
4.7% (2)
Chemicals
0.9% (1)
1.5% (1)
0.0% (0)
Unemployment in Snelling
Unemployment by race in 2022
Unemployment rate for White non-Hispanic residents
1.8%Males
Unemployment by race in 2000
Unemployment rate for White non-Hispanic residents
6.2%Males
6.2%Females
Unemployment rate for Black residents
9.1%Males
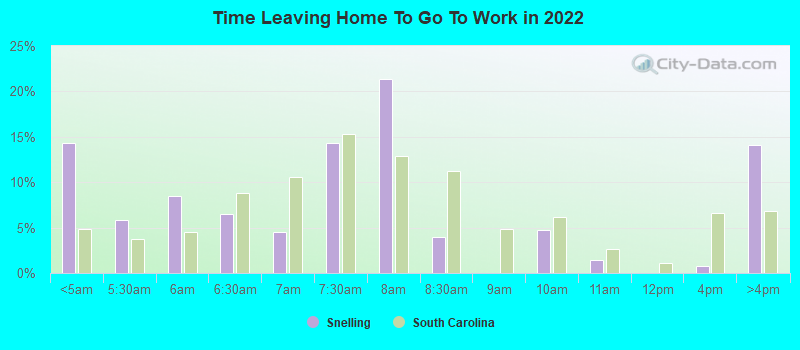
Time leaving home to go to work
12:00 a.m. to 4:59 a.m.:
Snelling:
14.3% (19)
South Carolina:
4.9% (105,233)
5:00 a.m. to 5:29 a.m.:
Snelling:
5.9% (8)
South Carolina:
3.8% (81,991)
5:30 a.m. to 5:59 a.m.:
Snelling:
8.4% (11)
South Carolina:
4.5% (97,139)
6:00 a.m. to 6:29 a.m.:
Snelling:
6.5% (9)
South Carolina:
8.8% (190,089)
6:30 a.m. to 6:59 a.m.:
Snelling:
4.5% (6)
South Carolina:
10.6% (229,373)
7:00 a.m. to 7:29 a.m.:
Snelling:
14.3% (19)
South Carolina:
15.4% (332,988)
7:30 a.m. to 7:59 a.m.:
Snelling:
21.4% (28)
South Carolina:
12.9% (278,683)
8:00 a.m. to 8:29 a.m.:
Snelling:
3.9% (5)
South Carolina:
11.2% (243,383)
9:00 a.m. to 9:59 a.m.:
Snelling:
4.8% (6)
South Carolina:
6.1% (132,620)
10:00 a.m. to 10:59 a.m.:
Snelling:
1.5% (2)
South Carolina:
2.6% (57,150)
12:00 p.m. to 3:59 p.m.:
Snelling:
0.8% (1)
South Carolina:
6.6% (143,789)
4:00 p.m. to 11:59 p.m.:
Snelling:
14.1% (19)
South Carolina:
6.8% (147,267)
<5am:
Snelling:
1.8% (2)
South Carolina:
2.9% (52,042)
5:30am:
Snelling:
3.6% (4)
South Carolina:
2.4% (44,320)
6am:
Snelling:
15.5% (17)
South Carolina:
3.8% (68,753)
6:30am:
Snelling:
14.5% (16)
South Carolina:
8.4% (153,907)
7am:
Snelling:
3.6% (4)
South Carolina:
11.5% (210,295)
7:30am:
Snelling:
10.0% (11)
South Carolina:
15.9% (289,937)
8am:
Snelling:
18.2% (20)
South Carolina:
16.7% (305,268)
8:30am:
Snelling:
14.5% (16)
South Carolina:
10.4% (189,373)
9am:
Snelling:
3.6% (4)
South Carolina:
4.5% (82,760)
10am:
Snelling:
5.5% (6)
South Carolina:
4.6% (83,870)
4pm:
Snelling:
3.6% (4)
South Carolina:
6.4% (116,272)
>4pm:
Snelling:
2.7% (3)
South Carolina:
7.7% (140,518)
12:00 a.m. to 4:59 a.m. - Males:
Snelling:
18.0% (15)
South Carolina:
6.1% (70,185)
5:00 a.m. to 5:29 a.m. - Males:
Snelling:
7.3% (6)
South Carolina:
5.2% (59,137)
5:30 a.m. to 5:59 a.m. - Males:
Snelling:
7.1% (6)
South Carolina:
5.4% (61,760)
6:00 a.m. to 6:29 a.m. - Males:
Snelling:
10.4% (9)
South Carolina:
10.2% (116,984)
6:30 a.m. to 6:59 a.m. - Males:
Snelling:
7.1% (6)
South Carolina:
10.5% (120,095)
7:00 a.m. to 7:29 a.m. - Males:
Snelling:
10.8% (9)
South Carolina:
14.6% (166,712)
7:30 a.m. to 7:59 a.m. - Males:
Snelling:
6.8% (6)
South Carolina:
12.0% (137,813)
8:00 a.m. to 8:29 a.m. - Males:
Snelling:
2.7% (2)
South Carolina:
10.8% (123,437)
9:00 a.m. to 9:59 a.m. - Males:
Snelling:
5.2% (4)
South Carolina:
5.4% (62,207)
12:00 p.m. to 3:59 p.m. - Males:
Snelling:
1.3% (1)
South Carolina:
6.4% (72,956)
4:00 p.m. to 11:59 p.m. - Males:
Snelling:
22.8% (19)
South Carolina:
6.8% (77,615)
12:00 a.m. to 4:59 a.m. - Females:
Snelling:
8.4% (4)
South Carolina:
3.4% (35,048)
5:00 a.m. to 5:29 a.m. - Females:
Snelling:
3.6% (2)
South Carolina:
2.2% (22,854)
5:30 a.m. to 5:59 a.m. - Females:
Snelling:
11.0% (6)
South Carolina:
3.5% (35,379)
7:00 a.m. to 7:29 a.m. - Females:
Snelling:
19.9% (10)
South Carolina:
16.3% (166,276)
7:30 a.m. to 7:59 a.m. - Females:
Snelling:
43.1% (22)
South Carolina:
13.8% (140,870)
8:00 a.m. to 8:29 a.m. - Females:
Snelling:
5.8% (3)
South Carolina:
11.7% (119,946)
9:00 a.m. to 9:59 a.m. - Females:
Snelling:
4.2% (2)
South Carolina:
6.9% (70,413)
10:00 a.m. to 10:59 a.m. - Females:
Snelling:
4.0% (2)
South Carolina:
3.3% (33,249)
Travel time to work
Percentage of workers working in this county: 65.4% Number of people working at home: 2 (1.5% of all workers)
Less than 5 minutes:
Snelling:
1.8% (2)
South Carolina:
3.0% (53,890)
5 to 9 minutes:
Snelling:
7.3% (8)
South Carolina:
10.6% (193,658)
10 to 14 minutes:
Snelling:
26.4% (29)
South Carolina:
15.6% (284,615)
15 to 19 minutes:
Snelling:
21.8% (24)
South Carolina:
17.1% (311,394)
20 to 24 minutes:
Snelling:
8.2% (9)
South Carolina:
15.0% (274,138)
25 to 29 minutes:
Snelling:
7.3% (8)
South Carolina:
5.9% (108,410)
30 to 34 minutes:
Snelling:
8.2% (9)
South Carolina:
13.5% (246,792)
45 to 59 minutes:
Snelling:
4.5% (5)
South Carolina:
6.3% (114,459)
60 to 89 minutes:
Snelling:
7.3% (8)
South Carolina:
3.4% (61,532)
90 or more minutes:
Snelling:
4.5% (5)
South Carolina:
2.4% (44,165)
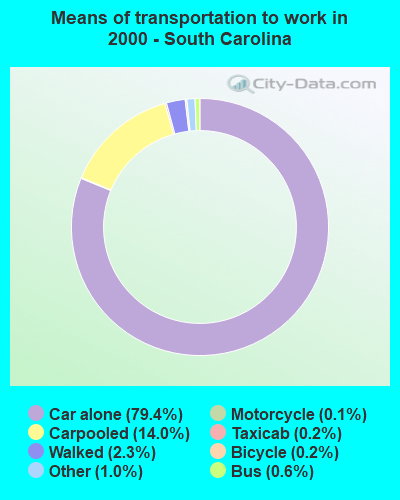
Means of transportation to work
Drove car alone:
Snelling:
78.2% (86)
South Carolina:
79.4% (1,447,338)
Carpooled:
Snelling:
15.5% (17)
South Carolina:
14.0% (255,857)
Motorcycle:
Snelling:
1.8% (2)
South Carolina:
0.1% (2,103)
Other means:
Snelling:
1.8% (2)
South Carolina:
1.0% (17,527)
Private vehicle occupancy
Drove alone:
Snelling:
89.7% (119)
South Carolina:
90.0% (1,869,768)
In 2 person carpool:
Snelling:
10.2% (13)
South Carolina:
7.4% (154,163)
Drove alone:
Snelling:
83.5% (86)
South Carolina:
85.0% (1,447,338)
In 2 person carpool:
Snelling:
12.6% (13)
South Carolina:
11.0% (187,418)
In 3 person carpool:
Snelling:
3.9% (4)
South Carolina:
2.4% (40,124)
Class of workers
Employee of private company:
Snelling:
52.6% (73)
South Carolina:
67.4% (1,654,283)
Private not-for-profit wage and salary workers:
Snelling:
3.0% (4)
South Carolina:
6.6% (161,608)
Local government workers:
Snelling:
13.5% (19)
South Carolina:
6.9% (169,428)
State government workers:
Snelling:
9.8% (14)
South Carolina:
6.3% (153,845)
Federal government workers:
Snelling:
15.0% (21)
South Carolina:
2.5% (62,253)
Self-employed workers in own not incorporated business:
Snelling:
6.0% (8)
South Carolina:
5.9% (144,382)
Employee of private company:
Snelling:
59.1% (65)
South Carolina:
70.4% (1,284,199)
Self-employed in own incorporated business:
Snelling:
9.1% (10)
South Carolina:
3.1% (56,628)
Private not-for-profit wage and salary workers:
Snelling:
3.6% (4)
South Carolina:
4.6% (84,506)
Local government workers:
Snelling:
2.7% (3)
South Carolina:
5.4% (99,319)
State government workers:
Snelling:
7.3% (8)
South Carolina:
8.1% (147,384)
Federal government workers:
Snelling:
11.8% (13)
South Carolina:
2.4% (43,164)
Self-employed workers in own not incorporated business:
Snelling:
6.4% (7)
South Carolina:
5.7% (104,649)
Employee of private company - Males:
Snelling:
48.1% (41)
South Carolina:
70.5% (888,497)
Private not-for-profit wage and salary workers - Males:
Snelling:
4.9% (4)
South Carolina:
4.5% (56,196)
Local government workers - Males:
Snelling:
8.6% (7)
South Carolina:
5.3% (66,693)
State government workers - Males:
Snelling:
6.2% (5)
South Carolina:
4.5% (56,682)
Federal government workers - Males:
Snelling:
22.2% (19)
South Carolina:
2.8% (35,915)
Self-employed workers in own not incorporated business - Males:
Snelling:
9.9% (8)
South Carolina:
6.9% (86,738)
Employee of private company - Females:
Snelling:
59.6% (32)
South Carolina:
64.2% (765,786)
Local government workers - Females:
Snelling:
21.2% (11)
South Carolina:
8.6% (102,735)
State government workers - Females:
Snelling:
15.4% (8)
South Carolina:
8.1% (97,163)
Federal government workers - Females:
Snelling:
3.8% (2)
South Carolina:
2.2% (26,338)
Discuss Snelling, South Carolina (SC) on our hugely popular South Carolina forum.