Work and Jobs in South Valley, New York (NY) Detailed Stats
Occupations, Industries, Unemployment, Workers, Commute

Recent posts about work in South Valley, New York on our local forum with over 2,400,000 registered users:
 | Ideas for the economic growth and quality of life in Syracuse (426 replies) |
| Diversity in the Sedgwick Farms Neighborhood, Syracuse, NY (60 replies) |
| Moving to Syracuse New York - Good Places To Live (45 replies) |
| Xavier Woods Condos in Syracuse Univ. Area (32 replies) |
| Upper Middle class african-american communities in ny (2066 replies) |
| smaller Upstate NY cities and towns/African American communities (6034 replies) |
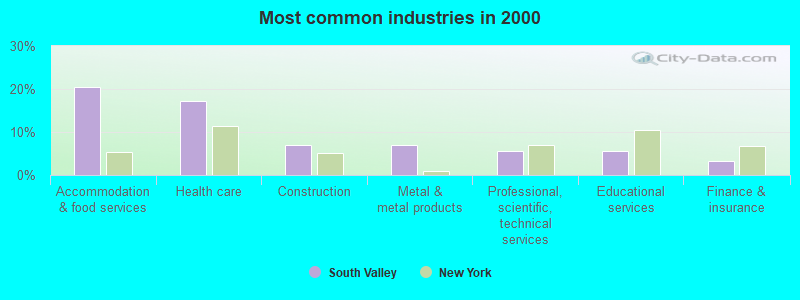
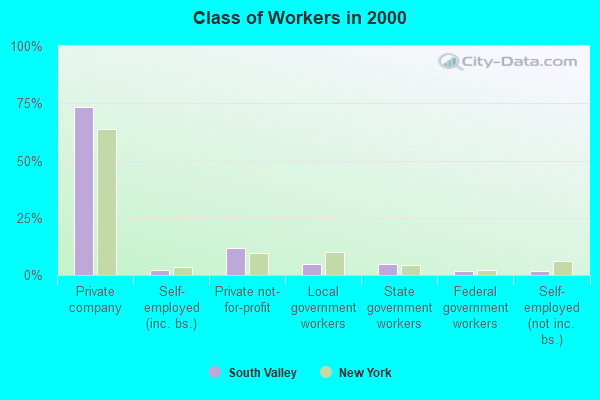
The most common industries in South Valley are: Accommodation & food services (20.5% of civilian employees), Health care (17.3% of civilian employees), Construction (7.1% of civilian employees). 73.2% of workers are employees of private companies, which is 13.0% greater than the rate of 63.7% across the entire state of New York.
Most common industries
Most common industries | |||
|---|---|---|---|
Industry | All | Males | Females |
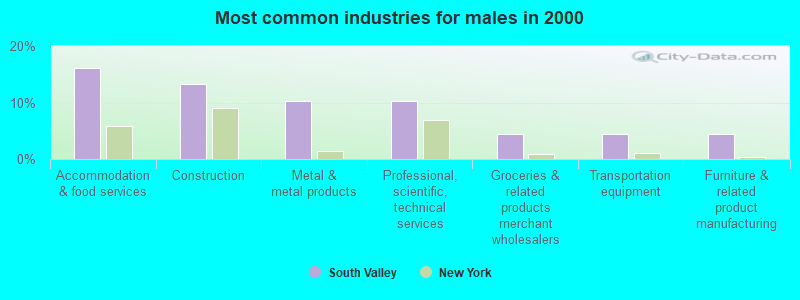
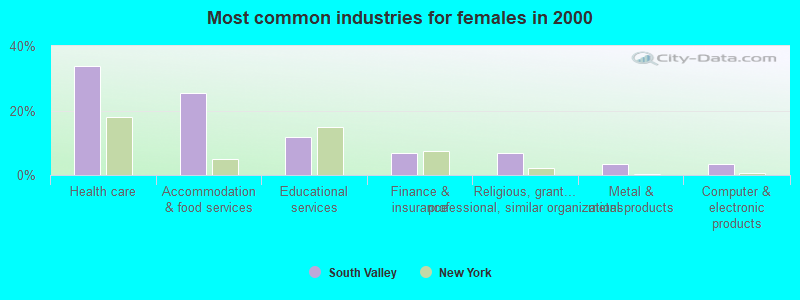
| Accommodation and food services | 20.5% (26) | 16.2% (11) | 25.4% (15) |
| Health care | 17.3% (22) | 2.9% (2) | 33.9% (20) |
| Construction | 7.1% (9) | 13.2% (9) | 0.0% (0) |
| Metal and metal products | 7.1% (9) | 10.3% (7) | 3.4% (2) |
| Professional, scientific, and technical services | 5.5% (7) | 10.3% (7) | 0.0% (0) |
| Educational services | 5.5% (7) | 0.0% (0) | 11.9% (7) |
| Finance and insurance | 3.1% (4) | 0.0% (0) | 6.8% (4) |
| Religious, grantmaking, civic, professional, and similar organizations | 3.1% (4) | 0.0% (0) | 6.8% (4) |
| Machinery | 2.4% (3) | 4.4% (3) | 0.0% (0) |
| Groceries and related products merchant wholesalers | 2.4% (3) | 4.4% (3) | 0.0% (0) |
| Transportation equipment | 2.4% (3) | 4.4% (3) | 0.0% (0) |
| Furniture and related product manufacturing | 2.4% (3) | 4.4% (3) | 0.0% (0) |
| Gasoline stations | 2.4% (3) | 4.4% (3) | 0.0% (0) |
| Truck transportation | 2.4% (3) | 4.4% (3) | 0.0% (0) |
| Other transportation, and support activities, and couriers | 2.4% (3) | 1.5% (1) | 3.4% (2) |
| Utilities | 2.4% (3) | 4.4% (3) | 0.0% (0) |
| Public administration | 1.6% (2) | 2.9% (2) | 0.0% (0) |
| Furniture and home furnishings, and household appliance stores | 1.6% (2) | 2.9% (2) | 0.0% (0) |
| Nonmetallic mineral products | 1.6% (2) | 2.9% (2) | 0.0% (0) |
| Computer and electronic products | 1.6% (2) | 0.0% (0) | 3.4% (2) |
| Food and beverage stores | 1.6% (2) | 2.9% (2) | 0.0% (0) |
| Fuel dealers | 1.6% (2) | 2.9% (2) | 0.0% (0) |
| Social assistance | 1.6% (2) | 0.0% (0) | 3.4% (2) |
| Building material and garden equipment and supplies dealers | 0.8% (1) | 0.0% (0) | 1.7% (1) |
Unemployment in South Valley
- Unemployment by race in 2000
- Unemployment rate for White non-Hispanic residents
- 8.1%Males
Time leaving home to go to work

5:30am:
| South Valley: | 11.5% (14) |
| New York: | 2.1% (174,328) |
6am:
| South Valley: | 4.1% (5) |
| New York: | 3.1% (253,826) |
6:30am:
| South Valley: | 13.9% (17) |
| New York: | 7.0% (573,349) |
7am:
| South Valley: | 6.6% (8) |
| New York: | 8.6% (706,982) |
7:30am:
| South Valley: | 14.8% (18) |
| New York: | 14.0% (1,147,579) |
8am:
| South Valley: | 12.3% (15) |
| New York: | 14.8% (1,213,706) |
9am:
| South Valley: | 1.6% (2) |
| New York: | 7.5% (614,475) |
11am:
| South Valley: | 4.1% (5) |
| New York: | 2.7% (224,011) |
12pm:
| South Valley: | 4.9% (6) |
| New York: | 1.3% (105,049) |
4pm:
| South Valley: | 16.4% (20) |
| New York: | 6.3% (517,309) |
>4pm:
| South Valley: | 9.8% (12) |
| New York: | 6.1% (501,196) |
Travel time to work


Less than 5 minutes:
| South Valley: | 4.9% (6) |
| New York: | 2.7% (219,036) |
5 to 9 minutes:
| South Valley: | 2.5% (3) |
| New York: | 8.3% (680,270) |
10 to 14 minutes:
| South Valley: | 2.5% (3) |
| New York: | 11.6% (956,590) |
15 to 19 minutes:
| South Valley: | 9.0% (11) |
| New York: | 12.4% (1,020,084) |
20 to 24 minutes:
| South Valley: | 11.5% (14) |
| New York: | 12.3% (1,013,757) |
25 to 29 minutes:
| South Valley: | 7.4% (9) |
| New York: | 4.9% (399,384) |
30 to 34 minutes:
| South Valley: | 35.2% (43) |
| New York: | 12.9% (1,058,688) |
35 to 39 minutes:
| South Valley: | 9.8% (12) |
| New York: | 2.5% (203,722) |
40 to 44 minutes:
| South Valley: | 3.3% (4) |
| New York: | 4.1% (340,311) |
45 to 59 minutes:
| South Valley: | 8.2% (10) |
| New York: | 9.8% (806,556) |
60 to 89 minutes:
| South Valley: | 2.5% (3) |
| New York: | 10.3% (848,185) |
90 or more minutes:
| South Valley: | 3.3% (4) |
| New York: | 5.1% (417,464) |
Means of transportation to work


Drove car alone:
| South Valley: | 82.0% (100) |
| New York: | 56.3% (4,620,178) |
Carpooled:
| South Valley: | 10.7% (13) |
| New York: | 9.2% (756,918) |
Walked:
| South Valley: | 7.4% (9) |
| New York: | 6.2% (511,721) |
Private vehicle occupancy

Drove alone:
| South Valley: | 88.5% (100) |
| New York: | 85.9% (4,620,178) |
In 2 person carpool:
| South Valley: | 7.1% (8) |
| New York: | 11.0% (590,255) |
In 3 person carpool:
| South Valley: | 0.9% (1) |
| New York: | 1.8% (96,470) |
In 4 person carpool:
| South Valley: | 3.5% (4) |
| New York: | 0.7% (36,112) |
Class of workers
Employee of private company:
| South Valley: | 73.2% (93) |
| New York: | 63.7% (5,340,134) |
Self-employed in own incorporated business:
| South Valley: | 2.4% (3) |
| New York: | 3.4% (283,619) |
Private not-for-profit wage and salary workers:
| South Valley: | 11.8% (15) |
| New York: | 9.7% (810,356) |
Local government workers:
| South Valley: | 4.7% (6) |
| New York: | 10.2% (858,120) |
State government workers:
| South Valley: | 4.7% (6) |
| New York: | 4.6% (383,673) |
Federal government workers:
| South Valley: | 1.6% (2) |
| New York: | 2.2% (185,100) |
Self-employed workers in own not incorporated business:
| South Valley: | 1.6% (2) |
| New York: | 6.0% (501,068) |

Employee of private company - Males:
| South Valley: | 85.3% (58) |
| New York: | 66.2% (2,902,064) |
Self-employed in own incorporated business - Males:
| South Valley: | 2.9% (2) |
| New York: | 4.9% (215,651) |
Private not-for-profit wage and salary workers - Males:
| South Valley: | 2.9% (2) |
| New York: | 6.3% (277,787) |
Local government workers - Males:
| South Valley: | 5.9% (4) |
| New York: | 8.7% (380,426) |
Self-employed workers in own not incorporated business - Males:
| South Valley: | 2.9% (2) |
| New York: | 7.1% (312,497) |

Employee of private company - Females:
| South Valley: | 59.3% (35) |
| New York: | 60.9% (2,438,070) |
Self-employed in own incorporated business - Females:
| South Valley: | 1.7% (1) |
| New York: | 1.7% (67,968) |
Private not-for-profit wage and salary workers - Females:
| South Valley: | 22.0% (13) |
| New York: | 13.3% (532,569) |
Local government workers - Females:
| South Valley: | 3.4% (2) |
| New York: | 11.9% (477,694) |
State government workers - Females:
| South Valley: | 10.2% (6) |
| New York: | 5.0% (201,889) |
Federal government workers - Females:
| South Valley: | 3.4% (2) |
| New York: | 2.1% (82,453) |