Work and Jobs in South Woodbridge, California (CA) Detailed Stats
Occupations, Industries, Unemployment, Workers, Commute

Discuss South Woodbridge, California work on our local forum with over 2,400,000 registered users
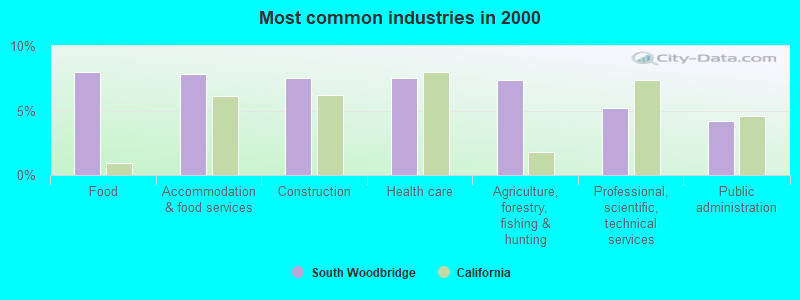
The most common industries in South Woodbridge are: Food (8.0% of civilian employees), Accommodation & food services (7.8% of civilian employees), Construction (7.6% of civilian employees). 73.1% of workers are employees of private companies, which is 7.0% greater than the rate of 68.0% across the entire state of California.
Most common industries
Most common industries | |||
|---|---|---|---|
Industry | All | Males | Females |
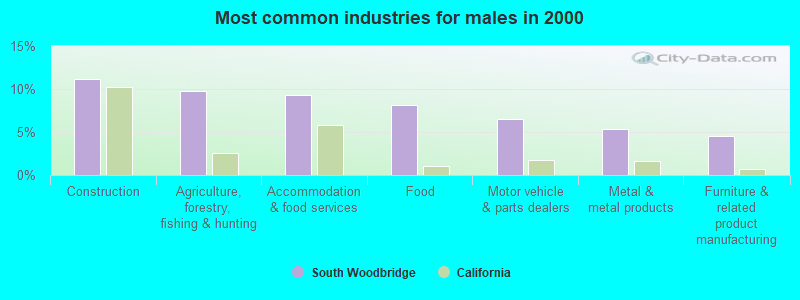
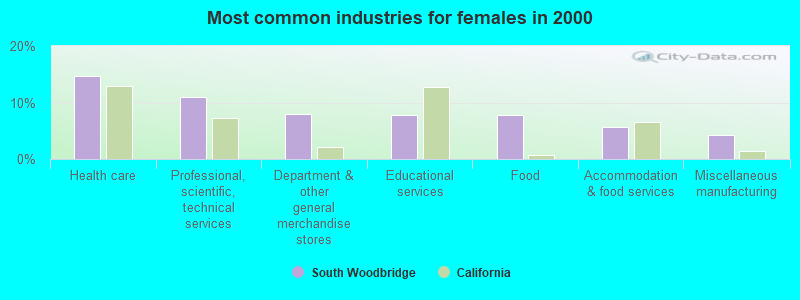
| Food | 8.0% (99) | 8.1% (59) | 7.7% (40) |
| Accommodation and food services | 7.8% (97) | 9.4% (68) | 5.6% (29) |
| Construction | 7.6% (94) | 11.1% (81) | 2.5% (13) |
| Health care | 7.6% (94) | 2.5% (18) | 14.7% (76) |
| Agriculture, forestry, fishing and hunting | 7.4% (92) | 9.8% (71) | 4.1% (21) |
| Professional, scientific, and technical services | 5.2% (65) | 1.1% (8) | 11.0% (57) |
| Public administration | 4.2% (52) | 4.1% (30) | 4.2% (22) |
| Metal and metal products | 3.8% (47) | 5.4% (39) | 1.5% (8) |
| Motor vehicle and parts dealers | 3.8% (47) | 6.5% (47) | 0.0% (0) |
| Educational services | 3.8% (47) | 1.0% (7) | 7.7% (40) |
| Department and other general merchandise stores | 3.3% (41) | 0.0% (0) | 7.9% (41) |
| Administrative and support and waste management services | 2.9% (36) | 4.4% (32) | 0.8% (4) |
| Transportation equipment | 2.7% (33) | 1.5% (11) | 4.2% (22) |
| Furniture and related product manufacturing | 2.7% (33) | 4.5% (33) | 0.0% (0) |
| Truck transportation | 2.5% (31) | 2.3% (17) | 2.7% (14) |
| Building material and garden equipment and supplies dealers | 1.9% (24) | 1.4% (10) | 2.7% (14) |
| Other transportation, and support activities, and couriers | 1.8% (23) | 3.2% (23) | 0.0% (0) |
| Finance and insurance | 1.8% (23) | 1.9% (14) | 1.7% (9) |
| Miscellaneous manufacturing | 1.8% (22) | 0.0% (0) | 4.2% (22) |
| U. S. Postal service | 1.4% (18) | 1.7% (12) | 1.2% (6) |
| Utilities | 1.4% (17) | 2.3% (17) | 0.0% (0) |
| Miscellaneous nondurable goods merchant wholesalers | 1.3% (16) | 2.2% (16) | 0.0% (0) |
| Nonmetallic mineral products | 1.2% (15) | 2.1% (15) | 0.0% (0) |
| Social assistance | 1.2% (15) | 0.0% (0) | 2.9% (15) |
| Textile mills and textile products | 1.0% (13) | 0.0% (0) | 2.5% (13) |
| Arts, entertainment, and recreation | 0.9% (11) | 1.5% (11) | 0.0% (0) |
| Repair and maintenance | 0.9% (11) | 1.5% (11) | 0.0% (0) |
| Beverage and tobacco products | 0.8% (10) | 1.4% (10) | 0.0% (0) |
| Pharmacies and drug stores | 0.8% (10) | 1.4% (10) | 0.0% (0) |
| Office supplies and stationery stores | 0.8% (10) | 1.4% (10) | 0.0% (0) |
| Paper | 0.7% (9) | 1.2% (9) | 0.0% (0) |
| Food and beverage stores | 0.7% (9) | 0.0% (0) | 1.7% (9) |
| Real estate and rental and leasing | 0.7% (9) | 1.2% (9) | 0.0% (0) |
| Religious, grantmaking, civic, professional, and similar organizations | 0.7% (9) | 0.0% (0) | 1.7% (9) |
| Personal and laundry services | 0.6% (8) | 0.0% (0) | 1.5% (8) |
| Groceries and related products merchant wholesalers | 0.6% (7) | 1.0% (7) | 0.0% (0) |
| Jewelry, luggage, and leather goods stores | 0.6% (7) | 0.0% (0) | 1.4% (7) |
| Machinery, equipment, and supplies merchant wholesalers | 0.6% (7) | 1.0% (7) | 0.0% (0) |
| Radio, TV, and computer stores | 0.6% (7) | 1.0% (7) | 0.0% (0) |
| Warehousing and storage | 0.6% (7) | 0.0% (0) | 1.4% (7) |
| Clothing and accessories, including shoe, stores | 0.5% (6) | 0.0% (0) | 1.2% (6) |
| Furniture and home furnishings, and household appliance stores | 0.5% (6) | 0.0% (0) | 1.2% (6) |
| Miscellaneous durable goods merchant wholesalers | 0.3% (4) | 0.6% (4) | 0.0% (0) |
| Private households | 0.3% (4) | 0.6% (4) | 0.0% (0) |
Unemployment in South Woodbridge
- Unemployment by race in 2000
- Unemployment rate for White non-Hispanic residents
- 5.3%Males
- 8.9%Females
- Unemployment rate for Asian residents
- 57.7%Females
- Unemployment rate for other race residents
- 7.1%Males
- Unemployment rate for Hispanic or Latino residents
- 3.9%Males
- 10.8%Females
Time leaving home to go to work
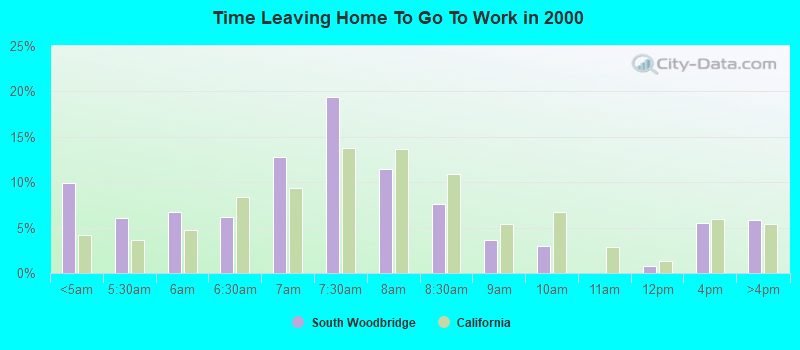
<5am:
| South Woodbridge: | 9.9% (121) |
| California: | 4.2% (606,086) |
5:30am:
| South Woodbridge: | 6.1% (75) |
| California: | 3.6% (523,209) |
6am:
| South Woodbridge: | 6.8% (83) |
| California: | 4.8% (692,256) |
6:30am:
| South Woodbridge: | 6.2% (76) |
| California: | 8.4% (1,216,867) |
7am:
| South Woodbridge: | 12.8% (157) |
| California: | 9.4% (1,362,830) |
7:30am:
| South Woodbridge: | 19.4% (238) |
| California: | 13.8% (2,006,950) |
8am:
| South Woodbridge: | 11.4% (140) |
| California: | 13.7% (1,986,831) |
8:30am:
| South Woodbridge: | 7.6% (93) |
| California: | 10.9% (1,577,815) |
9am:
| South Woodbridge: | 3.6% (44) |
| California: | 5.4% (778,152) |
10am:
| South Woodbridge: | 2.9% (36) |
| California: | 6.7% (972,355) |
12pm:
| South Woodbridge: | 0.8% (10) |
| California: | 1.3% (189,005) |
4pm:
| South Woodbridge: | 5.5% (67) |
| California: | 6.0% (865,284) |
>4pm:
| South Woodbridge: | 5.8% (71) |
| California: | 5.3% (776,167) |
Travel time to work
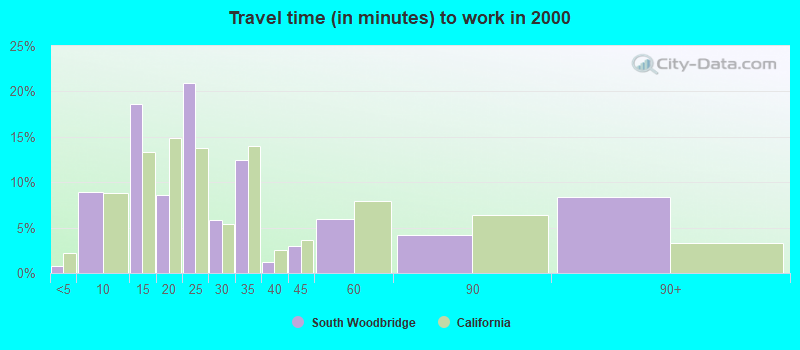
Less than 5 minutes:
| South Woodbridge: | 0.7% (9) |
| California: | 2.2% (324,703) |
5 to 9 minutes:
| South Woodbridge: | 8.9% (109) |
| California: | 8.8% (1,280,443) |
10 to 14 minutes:
| South Woodbridge: | 18.6% (228) |
| California: | 13.3% (1,930,263) |
15 to 19 minutes:
| South Woodbridge: | 8.6% (106) |
| California: | 14.9% (2,157,970) |
20 to 24 minutes:
| South Woodbridge: | 20.9% (257) |
| California: | 13.8% (2,004,060) |
25 to 29 minutes:
| South Woodbridge: | 5.8% (71) |
| California: | 5.4% (782,241) |
30 to 34 minutes:
| South Woodbridge: | 12.4% (152) |
| California: | 13.9% (2,025,657) |
35 to 39 minutes:
| South Woodbridge: | 1.2% (15) |
| California: | 2.5% (366,487) |
40 to 44 minutes:
| South Woodbridge: | 3.0% (37) |
| California: | 3.6% (528,043) |
45 to 59 minutes:
| South Woodbridge: | 5.9% (73) |
| California: | 7.9% (1,151,598) |
60 to 89 minutes:
| South Woodbridge: | 4.2% (51) |
| California: | 6.4% (933,123) |
90 or more minutes:
| South Woodbridge: | 8.4% (103) |
| California: | 3.3% (483,698) |
Means of transportation to work
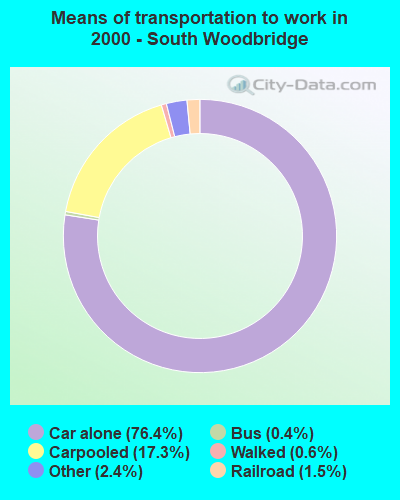

Drove car alone:
| South Woodbridge: | 76.4% (938) |
| California: | 71.8% (10,432,462) |
Carpooled:
| South Woodbridge: | 17.3% (212) |
| California: | 14.5% (2,113,313) |
Bus or trolley bus:
| South Woodbridge: | 0.4% (5) |
| California: | 3.8% (549,425) |
Railroad:
| South Woodbridge: | 1.5% (19) |
| California: | 0.3% (41,022) |
Walked:
| South Woodbridge: | 0.6% (7) |
| California: | 2.9% (414,581) |
Other means:
| South Woodbridge: | 2.4% (30) |
| California: | 0.8% (115,064) |
Private vehicle occupancy
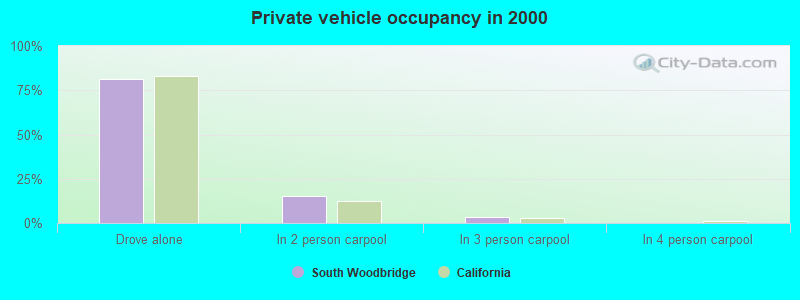
Drove alone:
| South Woodbridge: | 81.6% (938) |
| California: | 83.2% (10,432,462) |
In 2 person carpool:
| South Woodbridge: | 15.3% (176) |
| California: | 12.5% (1,564,905) |
In 3 person carpool:
| South Woodbridge: | 3.1% (36) |
| California: | 2.6% (330,732) |
Class of workers
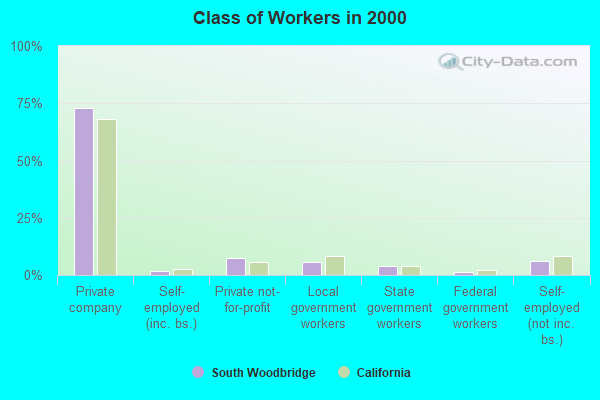
Employee of private company:
| South Woodbridge: | 73.1% (910) |
| California: | 68.0% (10,009,465) |
Self-employed in own incorporated business:
| South Woodbridge: | 1.9% (24) |
| California: | 2.7% (402,392) |
Private not-for-profit wage and salary workers:
| South Woodbridge: | 7.6% (94) |
| California: | 5.7% (845,536) |
Local government workers:
| South Woodbridge: | 5.8% (72) |
| California: | 8.3% (1,218,764) |
State government workers:
| South Woodbridge: | 3.9% (49) |
| California: | 4.0% (594,953) |
Federal government workers:
| South Woodbridge: | 1.4% (18) |
| California: | 2.3% (344,354) |
Self-employed workers in own not incorporated business:
| South Woodbridge: | 6.3% (78) |
| California: | 8.5% (1,249,530) |
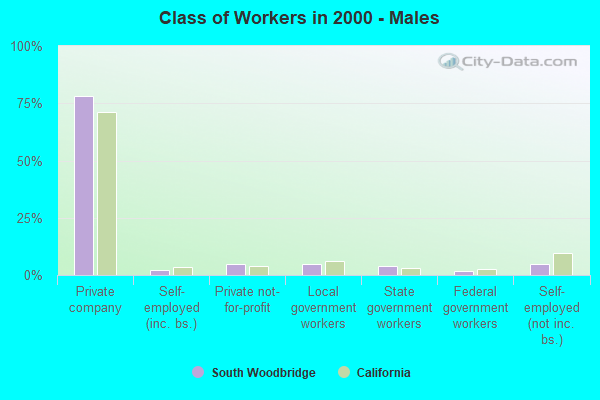
Employee of private company - Males:
| South Woodbridge: | 78.0% (567) |
| California: | 71.1% (5,716,697) |
Self-employed in own incorporated business - Males:
| South Woodbridge: | 2.2% (16) |
| California: | 3.6% (290,657) |
Private not-for-profit wage and salary workers - Males:
| South Woodbridge: | 4.7% (34) |
| California: | 3.8% (303,997) |
Local government workers - Males:
| South Woodbridge: | 4.7% (34) |
| California: | 6.2% (495,927) |
State government workers - Males:
| South Woodbridge: | 4.0% (29) |
| California: | 3.2% (255,434) |
Federal government workers - Males:
| South Woodbridge: | 1.7% (12) |
| California: | 2.5% (198,555) |
Self-employed workers in own not incorporated business - Males:
| South Woodbridge: | 4.8% (35) |
| California: | 9.5% (760,853) |
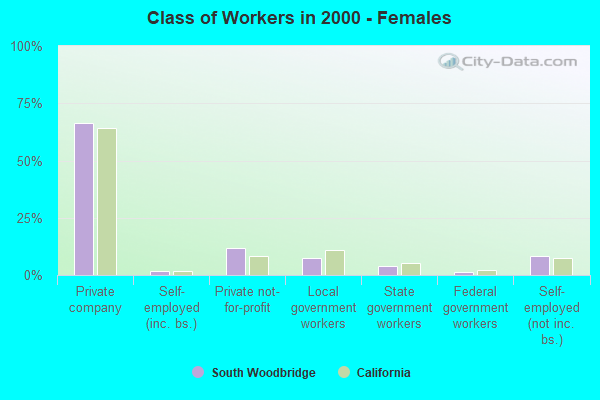
Employee of private company - Females:
| South Woodbridge: | 66.2% (343) |
| California: | 64.3% (4,292,768) |
Self-employed in own incorporated business - Females:
| South Woodbridge: | 1.5% (8) |
| California: | 1.7% (111,735) |
Private not-for-profit wage and salary workers - Females:
| South Woodbridge: | 11.6% (60) |
| California: | 8.1% (541,539) |
Local government workers - Females:
| South Woodbridge: | 7.3% (38) |
| California: | 10.8% (722,837) |
State government workers - Females:
| South Woodbridge: | 3.9% (20) |
| California: | 5.1% (339,519) |
Federal government workers - Females:
| South Woodbridge: | 1.2% (6) |
| California: | 2.2% (145,799) |
Self-employed workers in own not incorporated business - Females:
| South Woodbridge: | 8.3% (43) |
| California: | 7.3% (488,677) |