Work and Jobs in Squaw Valley, California (CA) Detailed Stats
Occupations, Industries, Unemployment, Workers, Commute
Settings
X


Recent posts about work in Squaw Valley, California on our local forum with over 2,400,000 registered users:
 | Which would you choose: $165k in the Bay Area vs. $95k to work remotely (44 replies) |
| Do we underestimate and downplay how Great Sacramento weather really is? (4609 replies) |
| Considering moving family to Sacramento (20 replies) |
| Pros of living in California...are there any? (161 replies) |
| Is Placer County a good place for Conservatives? (29 replies) |
| Southeast Clovis or Squaw Valley??? (10 replies) |
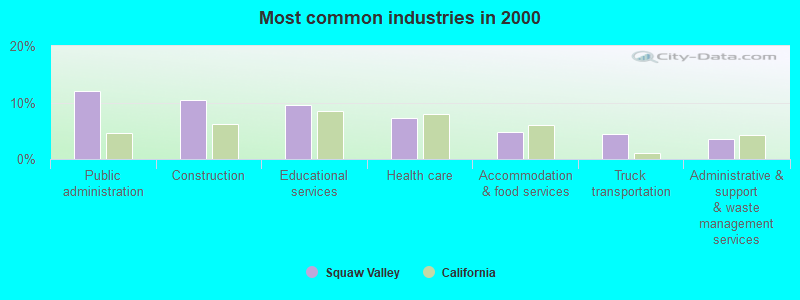
The most common industries in Squaw Valley are: Public administration (12.0% of civilian employees), Construction (10.4% of civilian employees), Educational services (9.6% of civilian employees). 95.3% of workers work in Fresno County and 7.6% of all workers work at home. 62.3% of workers are employees of private companies, which is 6.8% less than the rate of 66.5% across the entire state of California.
Whole page based on the data from 2000 / 2022 when the population of Squaw Valley, California was 2,691 / 4,599
Whole page based on the data from 2000 / 2022 when the population of Squaw Valley, California was 2,691 / 4,599
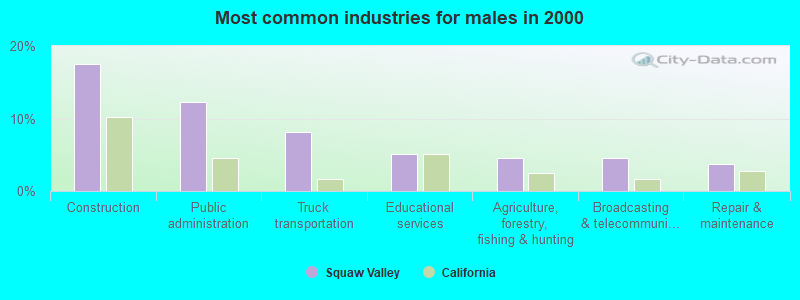
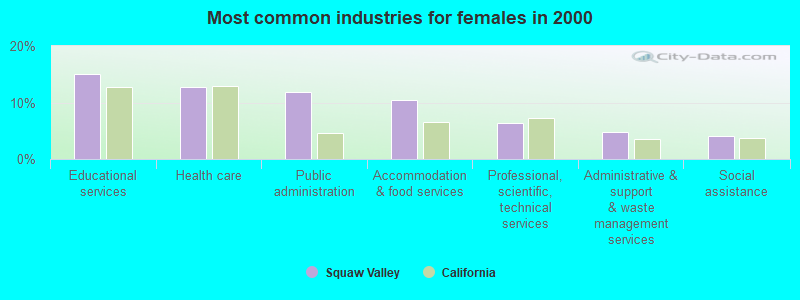
Most common industries
Most common industries | |||
|---|---|---|---|
Industry | All | Males | Females |
| Public administration | 12.0% (123) | 12.3% (69) | 11.8% (54) |
| Construction | 10.4% (106) | 17.6% (99) | 1.5% (7) |
| Educational services | 9.6% (98) | 5.2% (29) | 15.1% (69) |
| Health care | 7.2% (74) | 2.8% (16) | 12.7% (58) |
| Accommodation and food services | 4.7% (48) | 0.0% (0) | 10.5% (48) |
| Truck transportation | 4.5% (46) | 8.2% (46) | 0.0% (0) |
| Administrative and support and waste management services | 3.5% (36) | 2.5% (14) | 4.8% (22) |
| Agriculture, forestry, fishing and hunting | 2.8% (29) | 4.6% (26) | 0.7% (3) |
| Professional, scientific, and technical services | 2.8% (29) | 0.0% (0) | 6.3% (29) |
| Department and other general merchandise stores | 2.7% (28) | 2.5% (14) | 3.1% (14) |
| Real estate and rental and leasing | 2.6% (27) | 3.7% (21) | 1.3% (6) |
| Broadcasting and telecommunications | 2.5% (26) | 4.6% (26) | 0.0% (0) |
| Finance and insurance | 2.1% (21) | 1.2% (7) | 3.1% (14) |
| Repair and maintenance | 2.1% (21) | 3.7% (21) | 0.0% (0) |
| Miscellaneous nondurable goods merchant wholesalers | 2.0% (20) | 1.1% (6) | 3.1% (14) |
| Social assistance | 1.9% (19) | 0.0% (0) | 4.1% (19) |
| Motor vehicles, parts and supplies merchant wholesalers | 1.9% (19) | 3.4% (19) | 0.0% (0) |
| Motor vehicle and parts dealers | 1.8% (18) | 1.8% (10) | 1.7% (8) |
| Utilities | 1.6% (16) | 2.8% (16) | 0.0% (0) |
| Fuel dealers | 1.5% (15) | 1.2% (7) | 1.7% (8) |
| Groceries and related products merchant wholesalers | 1.5% (15) | 2.7% (15) | 0.0% (0) |
| Food and beverage stores | 1.5% (15) | 1.1% (6) | 2.0% (9) |
| Machinery, equipment, and supplies merchant wholesalers | 1.4% (14) | 2.5% (14) | 0.0% (0) |
| U. S. Postal service | 1.4% (14) | 0.0% (0) | 3.1% (14) |
| Religious, grantmaking, civic, professional, and similar organizations | 1.4% (14) | 0.0% (0) | 3.1% (14) |
| Metal and metal products | 1.3% (13) | 2.3% (13) | 0.0% (0) |
| Printing and related support activities | 1.3% (13) | 0.0% (0) | 2.8% (13) |
| Food | 1.2% (12) | 2.1% (12) | 0.0% (0) |
| Other transportation, and support activities, and couriers | 1.1% (11) | 0.9% (5) | 1.3% (6) |
| Beverage and tobacco products | 0.9% (9) | 1.6% (9) | 0.0% (0) |
| Arts, entertainment, and recreation | 0.9% (9) | 1.6% (9) | 0.0% (0) |
| Machinery | 0.8% (8) | 1.4% (8) | 0.0% (0) |
| Publishing, and motion picture and sound recording industries | 0.8% (8) | 0.0% (0) | 1.7% (8) |
| Data processing, libraries, and other information services | 0.8% (8) | 1.4% (8) | 0.0% (0) |
| Air transportation | 0.7% (7) | 1.2% (7) | 0.0% (0) |
| Radio, TV, and computer stores | 0.7% (7) | 1.2% (7) | 0.0% (0) |
| Gasoline stations | 0.6% (6) | 0.0% (0) | 1.3% (6) |
| Paper | 0.6% (6) | 0.0% (0) | 1.3% (6) |
| Personal and laundry services | 0.5% (5) | 0.0% (0) | 1.1% (5) |
| Pharmacies and drug stores | 0.4% (4) | 0.7% (4) | 0.0% (0) |
| Private households | 0.4% (4) | 0.0% (0) | 0.9% (4) |
Unemployment in Squaw Valley
- Unemployment by race in 2022
- Unemployment rate for White non-Hispanic residents
- 3.1%Males
- 1.8%Females
- Unemployment rate for other race residents
- 1.8%Males
- Unemployment rate for Hispanic or Latino residents
- 1.7%Males
- Unemployment by race in 2000
- Unemployment rate for White non-Hispanic residents
- 6.3%Males
- 5.9%Females
- Unemployment rate for American Indian and Alaska Native residents
- 54.5%Females
- Unemployment rate for other race residents
- 15.0%Males
- 18.8%Females
- Unemployment rate for Hispanic or Latino residents
- 9.1%Males
- 11.1%Females
Time leaving home to go to work

12:00 a.m. to 4:59 a.m.:
| Squaw Valley: | 15.2% (188) |
| California: | 6.8% (1,050,902) |
5:00 a.m. to 5:29 a.m.:
| Squaw Valley: | 7.4% (91) |
| California: | 4.5% (692,772) |
5:30 a.m. to 5:59 a.m.:
| Squaw Valley: | 0.6% (8) |
| California: | 4.3% (665,475) |
6:00 a.m. to 6:29 a.m.:
| Squaw Valley: | 15.9% (197) |
| California: | 8.3% (1,273,588) |
6:30 a.m. to 6:59 a.m.:
| Squaw Valley: | 6.1% (76) |
| California: | 7.5% (1,156,338) |
7:00 a.m. to 7:29 a.m.:
| Squaw Valley: | 18.4% (227) |
| California: | 13.2% (2,027,702) |
7:30 a.m. to 7:59 a.m.:
| Squaw Valley: | 23.3% (289) |
| California: | 10.1% (1,550,402) |
8:00 a.m. to 8:29 a.m.:
| Squaw Valley: | 1.1% (14) |
| California: | 12.7% (1,953,986) |
9:00 a.m. to 9:59 a.m.:
| Squaw Valley: | 1.3% (16) |
| California: | 8.4% (1,288,499) |
12:00 p.m. to 3:59 p.m.:
| Squaw Valley: | 3.4% (42) |
| California: | 7.0% (1,075,505) |
4:00 p.m. to 11:59 p.m.:
| Squaw Valley: | 4.7% (59) |
| California: | 5.8% (891,240) |

<5am:
| Squaw Valley: | 10.6% (107) |
| California: | 4.2% (606,086) |
5:30am:
| Squaw Valley: | 7.8% (79) |
| California: | 3.6% (523,209) |
6am:
| Squaw Valley: | 3.7% (37) |
| California: | 4.8% (692,256) |
6:30am:
| Squaw Valley: | 7.4% (75) |
| California: | 8.4% (1,216,867) |
7am:
| Squaw Valley: | 17.6% (178) |
| California: | 9.4% (1,362,830) |
7:30am:
| Squaw Valley: | 17.6% (178) |
| California: | 13.8% (2,006,950) |
8am:
| Squaw Valley: | 5.4% (55) |
| California: | 13.7% (1,986,831) |
8:30am:
| Squaw Valley: | 8.6% (87) |
| California: | 10.9% (1,577,815) |
9am:
| Squaw Valley: | 4.2% (42) |
| California: | 5.4% (778,152) |
10am:
| Squaw Valley: | 2.5% (25) |
| California: | 6.7% (972,355) |
11am:
| Squaw Valley: | 0.3% (3) |
| California: | 2.9% (414,479) |
12pm:
| Squaw Valley: | 2.0% (20) |
| California: | 1.3% (189,005) |
4pm:
| Squaw Valley: | 4.9% (50) |
| California: | 6.0% (865,284) |
>4pm:
| Squaw Valley: | 3.0% (30) |
| California: | 5.3% (776,167) |

12:00 a.m. to 4:59 a.m. - Males:
| Squaw Valley: | 14.8% (131) |
| California: | 8.7% (747,612) |
5:00 a.m. to 5:29 a.m. - Males:
| Squaw Valley: | 10.9% (96) |
| California: | 6.0% (509,420) |
6:00 a.m. to 6:29 a.m. - Males:
| Squaw Valley: | 13.7% (122) |
| California: | 9.8% (842,941) |
6:30 a.m. to 6:59 a.m. - Males:
| Squaw Valley: | 5.3% (47) |
| California: | 7.7% (657,557) |
7:00 a.m. to 7:29 a.m. - Males:
| Squaw Valley: | 21.4% (190) |
| California: | 12.4% (1,058,532) |
7:30 a.m. to 7:59 a.m. - Males:
| Squaw Valley: | 24.4% (217) |
| California: | 8.2% (702,727) |
4:00 p.m. to 11:59 p.m. - Males:
| Squaw Valley: | 6.9% (62) |
| California: | 5.8% (499,471) |

12:00 a.m. to 4:59 a.m. - Females:
| Squaw Valley: | 16.0% (56) |
| California: | 4.4% (303,290) |
5:30 a.m. to 5:59 a.m. - Females:
| Squaw Valley: | 1.9% (7) |
| California: | 3.2% (217,206) |
6:00 a.m. to 6:29 a.m. - Females:
| Squaw Valley: | 20.4% (72) |
| California: | 6.3% (430,647) |
6:30 a.m. to 6:59 a.m. - Females:
| Squaw Valley: | 8.0% (28) |
| California: | 7.3% (498,781) |
7:00 a.m. to 7:29 a.m. - Females:
| Squaw Valley: | 10.7% (38) |
| California: | 14.1% (969,170) |
7:30 a.m. to 7:59 a.m. - Females:
| Squaw Valley: | 19.7% (70) |
| California: | 12.4% (847,675) |
8:00 a.m. to 8:29 a.m. - Females:
| Squaw Valley: | 4.0% (14) |
| California: | 14.1% (969,448) |
9:00 a.m. to 9:59 a.m. - Females:
| Squaw Valley: | 4.3% (15) |
| California: | 9.2% (633,461) |
12:00 p.m. to 3:59 p.m. - Females:
| Squaw Valley: | 10.7% (38) |
| California: | 7.0% (480,658) |
Travel time to work
Percentage of workers working in this county: 95.3%
Number of people working at home: 105 (7.6% of all workers)
Number of people working at home: 105 (7.6% of all workers)


5 to 9 minutes:
| Squaw Valley: | 5.2% (53) |
| California: | 8.8% (1,280,443) |
10 to 14 minutes:
| Squaw Valley: | 1.1% (11) |
| California: | 13.3% (1,930,263) |
15 to 19 minutes:
| Squaw Valley: | 2.3% (23) |
| California: | 14.9% (2,157,970) |
20 to 24 minutes:
| Squaw Valley: | 0.6% (6) |
| California: | 13.8% (2,004,060) |
25 to 29 minutes:
| Squaw Valley: | 2.2% (22) |
| California: | 5.4% (782,241) |
30 to 34 minutes:
| Squaw Valley: | 8.5% (86) |
| California: | 13.9% (2,025,657) |
35 to 39 minutes:
| Squaw Valley: | 6.8% (69) |
| California: | 2.5% (366,487) |
40 to 44 minutes:
| Squaw Valley: | 7.7% (78) |
| California: | 3.6% (528,043) |
45 to 59 minutes:
| Squaw Valley: | 32.5% (329) |
| California: | 7.9% (1,151,598) |
60 to 89 minutes:
| Squaw Valley: | 21.6% (219) |
| California: | 6.4% (933,123) |
90 or more minutes:
| Squaw Valley: | 6.9% (70) |
| California: | 3.3% (483,698) |
Means of transportation to work


Drove car alone:
| Squaw Valley: | 73.5% (744) |
| California: | 71.8% (10,432,462) |
Carpooled:
| Squaw Valley: | 19.6% (198) |
| California: | 14.5% (2,113,313) |
Bus or trolley bus:
| Squaw Valley: | 0.7% (7) |
| California: | 3.8% (549,425) |
Motorcycle:
| Squaw Valley: | 0.9% (9) |
| California: | 0.2% (36,262) |
Bicycle:
| Squaw Valley: | 0.8% (8) |
| California: | 0.8% (120,567) |
Private vehicle occupancy

Drove alone:
| Squaw Valley: | 80.4% (957) |
| California: | 86.9% (12,187,486) |
In 2 person carpool:
| Squaw Valley: | 14.1% (168) |
| California: | 9.2% (1,295,561) |
In 3 person carpool:
| Squaw Valley: | 3.0% (36) |
| California: | 2.2% (309,969) |

Drove alone:
| Squaw Valley: | 79.0% (744) |
| California: | 83.2% (10,432,462) |
In 2 person carpool:
| Squaw Valley: | 18.5% (174) |
| California: | 12.5% (1,564,905) |
In 3 person carpool:
| Squaw Valley: | 2.5% (24) |
| California: | 2.6% (330,732) |
Class of workers

Employee of private company:
| Squaw Valley: | 62.3% (860) |
| California: | 66.5% (12,596,030) |
Self-employed in own incorporated business:
| Squaw Valley: | 3.4% (48) |
| California: | 4.1% (784,709) |
Private not-for-profit wage and salary workers:
| Squaw Valley: | 5.9% (81) |
| California: | 7.5% (1,417,407) |
Local government workers:
| Squaw Valley: | 8.5% (117) |
| California: | 8.2% (1,547,056) |
State government workers:
| Squaw Valley: | 8.4% (116) |
| California: | 4.1% (780,915) |
Federal government workers:
| Squaw Valley: | 3.7% (52) |
| California: | 2.0% (369,858) |
Self-employed workers in own not incorporated business:
| Squaw Valley: | 7.7% (107) |
| California: | 7.4% (1,410,735) |

Employee of private company:
| Squaw Valley: | 55.6% (568) |
| California: | 68.0% (10,009,465) |
Self-employed in own incorporated business:
| Squaw Valley: | 0.9% (9) |
| California: | 2.7% (402,392) |
Private not-for-profit wage and salary workers:
| Squaw Valley: | 7.1% (73) |
| California: | 5.7% (845,536) |
Local government workers:
| Squaw Valley: | 11.7% (119) |
| California: | 8.3% (1,218,764) |
State government workers:
| Squaw Valley: | 3.2% (33) |
| California: | 4.0% (594,953) |
Federal government workers:
| Squaw Valley: | 12.2% (125) |
| California: | 2.3% (344,354) |
Self-employed workers in own not incorporated business:
| Squaw Valley: | 9.2% (94) |
| California: | 8.5% (1,249,530) |

Employee of private company - Males:
| Squaw Valley: | 67.6% (673) |
| California: | 70.3% (7,191,252) |
Private not-for-profit wage and salary workers - Males:
| Squaw Valley: | 2.2% (22) |
| California: | 5.2% (529,122) |
Local government workers - Males:
| Squaw Valley: | 3.6% (36) |
| California: | 6.0% (610,331) |
State government workers - Males:
| Squaw Valley: | 11.7% (116) |
| California: | 3.4% (343,636) |
Federal government workers - Males:
| Squaw Valley: | 5.2% (52) |
| California: | 2.1% (209,874) |
Self-employed workers in own not incorporated business - Males:
| Squaw Valley: | 9.8% (97) |
| California: | 8.1% (824,359) |

Employee of private company - Females:
| Squaw Valley: | 48.6% (187) |
| California: | 62.0% (5,404,778) |
Self-employed in own incorporated business - Females:
| Squaw Valley: | 12.4% (48) |
| California: | 3.2% (279,945) |
Private not-for-profit wage and salary workers - Females:
| Squaw Valley: | 15.4% (59) |
| California: | 10.2% (888,285) |
Local government workers - Females:
| Squaw Valley: | 21.2% (81) |
| California: | 10.8% (936,725) |
Self-employed workers in own not incorporated business - Females:
| Squaw Valley: | 2.5% (10) |
| California: | 6.7% (586,376) |