Work and Jobs in St. Lawrence, South Dakota (SD) Detailed Stats
Data:
Unemployment (%)
Unemployment (% change since 2000)
Unemployment (%) - White
Unemployment (% change since 2000) - White
Unemployment (%) - Black or African American
Unemployment (% change since 2000) - Black or African American
Unemployment (%) - Asian
Unemployment (% change since 2000) - Asian
Unemployment (%) - Hispanic or Latino
Unemployment (% change since 2000) - Hispanic or Latino
Unemployment (%) - American Indian and Alaska Native
Unemployment (% change since 2000) - American Indian and Alaska Native
Unemployment (%) - Multirace
Unemployment (% change since 2000) - Multirace
Unemployment (%) - Other Race
Unemployment (% change since 2000) - Other Race
Industry diversity
Most Common Industries - Agriculture, forestry, fishing and hunting, and mining (%)
Most Common Industries - Agriculture, forestry, fishing and hunting (%)
Most Common Industries - Mining, quarrying, and oil and gas extraction (%)
Most Common Industries - Construction (%)
Most Common Industries - Manufacturing (%)
Most Common Industries - Wholesale trade (%)
Most Common Industries - Retail trade (%)
Most Common Industries - Transportation and warehousing, and utilities (%)
Most Common Industries - Transportation and warehousing (%)
Most Common Industries - Utilities (%)
Most Common Industries - Information (%)
Most Common Industries - Finance and insurance, and real estate and rental and leasing (%)
Most Common Industries - Finance and insurance (%)
Most Common Industries - Real estate and rental and leasing (%)
Most Common Industries - Professional, scientific, and management, and administrative and waste management services (%)
Most Common Industries - Professional, scientific, and technical services (%)
Most Common Industries - Management of companies and enterprises (%)
Most Common Industries - Administrative and support and waste management services (%)
Most Common Industries - Educational services, and health care and social assistance (%)
Most Common Industries - Educational services (%)
Most Common Industries - Health care and social assistance (%)
Most Common Industries - Arts, entertainment, and recreation, and accommodation and food services (%)
Most Common Industries - Arts, entertainment, and recreation (%)
Most Common Industries - Accommodation and food services (%)
Most Common Industries - Other services, except public administration (%)
Most Common Industries - Public administration (%)
Occupation diversity
Most Common Occupations - Management, business, science, and arts occupations (%)
Most Common Occupations - Management, business, and financial occupations (%)
Most Common Occupations - Management occupations (%)
Most Common Occupations - Business and financial operations occupations (%)
Most Common Occupations - Computer, engineering, and science occupations (%)
Most Common Occupations - Computer and mathematical occupations (%)
Most Common Occupations - Architecture and engineering occupations (%)
Most Common Occupations - Life, physical, and social science occupations (%)
Most Common Occupations - Education, legal, community service, arts, and media occupations (%)
Most Common Occupations - Community and social service occupations (%)
Most Common Occupations - Legal occupations (%)
Most Common Occupations - Education, training, and library occupations (%)
Most Common Occupations - Arts, design, entertainment, sports, and media occupations (%)
Most Common Occupations - Healthcare practitioners and technical occupations (%)
Most Common Occupations - Health diagnosing and treating practitioners and other technical occupations (%)
Most Common Occupations - Health technologists and technicians (%)
Most Common Occupations - Service occupations (%)
Most Common Occupations - Healthcare support occupations (%)
Most Common Occupations - Protective service occupations (%)
Most Common Occupations - Fire fighting and prevention, and other protective service workers including supervisors (%)
Most Common Occupations - Law enforcement workers including supervisors (%)
Most Common Occupations - Food preparation and serving related occupations (%)
Most Common Occupations - Building and grounds cleaning and maintenance occupations (%)
Most Common Occupations - Personal care and service occupations (%)
Most Common Occupations - Sales and office occupations (%)
Most Common Occupations - Sales and related occupations (%)
Most Common Occupations - Office and administrative support occupations (%)
Most Common Occupations - Natural resources, construction, and maintenance occupations (%)
Most Common Occupations - Farming, fishing, and forestry occupations (%)
Most Common Occupations - Construction and extraction occupations (%)
Most Common Occupations - Installation, maintenance, and repair occupations (%)
Most Common Occupations - Production, transportation, and material moving occupations (%)
Most Common Occupations - Production occupations (%)
Most Common Occupations - Transportation occupations (%)
Most Common Occupations - Material moving occupations (%)
Private vehicle occupancy - Drove alone (% change since 2000)
Private vehicle occupancy - Carpooled (%)
Private vehicle occupancy - Carpooled (% change since 2000)
Private vehicle occupancy - In 2-person carpool (%)
Private vehicle occupancy - In 2-person carpool (% change since 2000)
Private vehicle occupancy - In 3-person carpool (%)
Private vehicle occupancy - In 3-person carpool (% change since 2000)
Private vehicle occupancy - In 4-person carpool (%)
Private vehicle occupancy - In 4-person carpool (% change since 2000)
Private vehicle occupancy - In 5- or 6-person carpool (%)
Private vehicle occupancy - In 5- or 6-person carpool (% change since 2000)
Private vehicle occupancy - In 7-or-more-person carpool (%)
Private vehicle occupancy - In 7-or-more-person carpool (% change since 2000)
Time Leaving Home To Go To Work - 12:00 a.m. to 4:59 a.m. (%)
Time Leaving Home To Go To Work - 12:00 a.m. to 4:59 a.m. (% change since 2000)
Time Leaving Home To Go To Work - 5:00 a.m. to 5:59 a.m. (%)
Time Leaving Home To Go To Work - 5:00 a.m. to 5:59 a.m. (% change since 2000)
Time Leaving Home To Go To Work - 6:00 a.m. to 6:59 a.m. (%)
Time Leaving Home To Go To Work - 6:00 a.m. to 6:59 a.m. (% change since 2000)
Time Leaving Home To Go To Work - 7:00 a.m. to 7:59 a.m. (%)
Time Leaving Home To Go To Work - 7:00 a.m. to 7:59 a.m. (% change since 2000)
Time Leaving Home To Go To Work - 8:00 a.m. to 8:59 a.m. (%)
Time Leaving Home To Go To Work - 8:00 a.m. to 8:59 a.m. (% change since 2000)
Time Leaving Home To Go To Work - 9:00 a.m. to 9:59 a.m. (%)
Time Leaving Home To Go To Work - 9:00 a.m. to 9:59 a.m. (% change since 2000)
Time Leaving Home To Go To Work - 10:00 a.m. to 10:59 a.m. (%)
Time Leaving Home To Go To Work - 10:00 a.m. to 10:59 a.m. (% change since 2000)
Time Leaving Home To Go To Work - 11:00 a.m. to 11:59 a.m. (%)
Time Leaving Home To Go To Work - 11:00 a.m. to 11:59 a.m. (% change since 2000)
Time Leaving Home To Go To Work - 12:00 p.m. to 3:59 p.m. (%)
Time Leaving Home To Go To Work - 12:00 p.m. to 3:59 p.m. (% change since 2000)
Time Leaving Home To Go To Work - 4:00 p.m. to 11:59 p.m. (%)
Time Leaving Home To Go To Work - 4:00 p.m. to 11:59 p.m. (% change since 2000)
Class of Workers - Employee of private company (%)
Class of Workers - Employee of private company (% change since 2000)
Class of Workers - Self-employed in own incorporated business (%)
Class of Workers - Self-employed in own incorporated business (% change since 2000)
Class of Workers - Private not-for-profit wage and salary workers (%)
Class of Workers - Private not-for-profit wage and salary workers (% change since 2000)
Class of Workers - Local government workers (%)
Class of Workers - Local government workers (% change since 2000)
Class of Workers - State government workers (%)
Class of Workers - State government workers (% change since 2000)
Class of Workers - Federal government workers (%)
Class of Workers - Federal government workers (% change since 2000)
Class of Workers - Self-employed workers in own not incorporated business and Unpaid family workers (%)
Class of Workers - Self-employed workers in own not incorporated business and Unpaid family workers (% change since 2000)
Means of transportation to work - Drove car alone (%)
Means of transportation to work - Drove car alone (% change since 2000)
Means of transportation to work - Carpooled (%)
Means of transportation to work - Carpooled (% change since 2000)
Means of transportation to work - Public transportation (%)
Means of transportation to work - Public transportation (% change since 2000)
Means of transportation to work - Bus or trolley bus (%)
Means of transportation to work - Bus or trolley bus (% change since 2000)
Means of transportation to work - Streetcar or trolley car (%)
Means of transportation to work - Streetcar or trolley car (% change since 2000)
Means of transportation to work - Subway or elevated (%)
Means of transportation to work - Subway or elevated (% change since 2000)
Means of transportation to work - Railroad (%)
Means of transportation to work - Railroad (% change since 2000)
Means of transportation to work - Ferryboat (%)
Means of transportation to work - Ferryboat (% change since 2000)
Means of transportation to work - Taxicab (%)
Means of transportation to work - Taxicab (% change since 2000)
Means of transportation to work - Motorcycle (%)
Means of transportation to work - Motorcycle (% change since 2000)
Means of transportation to work - Bicycle (%)
Means of transportation to work - Bicycle (% change since 2000)
Means of transportation to work - Walked (%)
Means of transportation to work - Walked (% change since 2000)
Means of transportation to work - Other means (%)
Means of transportation to work - Other means (% change since 2000)
Working at home (%)
Working at home (% change since 2000)
Travel time to work - Less than 5 minutes (%)
Travel time to work - Less than 5 minutes (% change since 2000)
Travel time to work - 5 to 9 minutes (%)
Travel time to work - 5 to 9 minutes (% change since 2000)
Travel time to work - 10 to 19 minutes (%)
Travel time to work - 10 to 19 minutes (% change since 2000)
Travel time to work - 20 to 29 minutes (%)
Travel time to work - 20 to 29 minutes (% change since 2000)
Travel time to work - 30 to 39 minutes (%)
Travel time to work - 30 to 39 minutes (% change since 2000)
Travel time to work - 40 to 59 minutes (%)
Travel time to work - 40 to 59 minutes (% change since 2000)
Travel time to work - 60 to 89 minutes (%)
Travel time to work - 60 to 89 minutes (% change since 2000)
Travel time to work - 90 or more minutes (%)
Travel time to work - 90 or more minutes (% change since 2000)
The most common industries in St. Lawrence are: Health care (19.8% of civilian employees), Agriculture, forestry, fishing & hunting (10.8% of civilian employees), Construction (10.8% of civilian employees). 93.9% of workers work in Hand County and 7.0% of all workers work at home. 58.8% of workers are employees of private companies, which is about the same as the rate of 59.4% across the entire state of South Dakota.
Whole page based on the data from 2000 / 2022 when the population of St. Lawrence, South Dakota was 210 / 177
Most common industries
Most common industries Industry All Males Females
Health care 19.8% 3.4% 37.7% Agriculture, forestry, fishing and hunting 10.8% 19.0% 1.9% Construction 10.8% 20.7% 0.0% Building material and garden equipment and supplies dealers 10.8% 10.3% 11.3% Accommodation and food services 9.0% 10.3% 7.5% Real estate and rental and leasing 4.5% 8.6% 0.0% Motor vehicle and parts dealers 3.6% 3.4% 3.8% Administrative and support and waste management services 3.6% 0.0% 7.5% Finance and insurance 2.7% 0.0% 5.7% Educational services 2.7% 5.2% 0.0% Machinery, equipment, and supplies merchant wholesalers 1.8% 3.4% 0.0% Food 1.8% 3.4% 0.0% Public administration 1.8% 0.0% 3.8% Health and personal care, except drug, stores 1.8% 0.0% 3.8% Sewing, needlework, and piece goods stores 1.8% 0.0% 3.8% Other direct selling establishments 1.8% 0.0% 3.8% Truck transportation 1.8% 3.4% 0.0% Broadcasting and telecommunications 1.8% 3.4% 0.0% Social assistance 1.8% 0.0% 3.8% Repair and maintenance 1.8% 3.4% 0.0% Religious, grantmaking, civic, professional, and similar organizations 1.8% 0.0% 3.8% Miscellaneous nondurable goods merchant wholesalers 0.9% 1.7% 0.0% Warehousing and storage 0.9% 0.0% 1.9%
Time leaving home to go to work 12:00 a.m. to 4:59 a.m.: St. Lawrence:
1.1% (1)South Dakota:
4.1% (17,147)
5:30 a.m. to 5:59 a.m.: St. Lawrence:
4.9% (5)South Dakota:
4.8% (19,988)
6:00 a.m. to 6:29 a.m.: St. Lawrence:
18.8% (20)South Dakota:
6.9% (28,443)
6:30 a.m. to 6:59 a.m.: St. Lawrence:
5.0% (5)South Dakota:
11.9% (49,378)
7:00 a.m. to 7:29 a.m.: St. Lawrence:
9.0% (10)South Dakota:
17.1% (70,737)
7:30 a.m. to 7:59 a.m.: St. Lawrence:
20.5% (22)South Dakota:
19.8% (81,983)
8:00 a.m. to 8:29 a.m.: St. Lawrence:
6.0% (6)South Dakota:
10.0% (41,264)
8:30 a.m. to 8:59 a.m.: St. Lawrence:
18.9% (20)South Dakota:
3.5% (14,687)
9:00 a.m. to 9:59 a.m.: St. Lawrence:
5.9% (6)South Dakota:
3.6% (14,897)
4:00 p.m. to 11:59 p.m.: St. Lawrence:
7.8% (8)South Dakota:
5.6% (23,036)
<5am: St. Lawrence:
0.9% (1)South Dakota:
2.6% (9,542)
6:30am: St. Lawrence:
6.4% (7)South Dakota:
5.7% (21,058)
7am: St. Lawrence:
12.8% (14)South Dakota:
9.3% (34,473)
7:30am: St. Lawrence:
12.8% (14)South Dakota:
13.7% (50,997)
8am: St. Lawrence:
22.9% (25)South Dakota:
21.7% (80,886)
8:30am: St. Lawrence:
17.4% (19)South Dakota:
10.1% (37,691)
9am: St. Lawrence:
1.8% (2)South Dakota:
3.7% (13,935)
10am: St. Lawrence:
5.5% (6)South Dakota:
3.9% (14,661)
11am: St. Lawrence:
3.7% (4)South Dakota:
1.8% (6,829)
4pm: St. Lawrence:
2.8% (3)South Dakota:
6.6% (24,424)
>4pm: St. Lawrence:
6.4% (7)South Dakota:
7.3% (27,149)
6:00 a.m. to 6:29 a.m. - Males: St. Lawrence:
19.4% (9)South Dakota:
8.4% (18,875)
7:00 a.m. to 7:29 a.m. - Males: St. Lawrence:
9.2% (4)South Dakota:
17.1% (38,288)
7:30 a.m. to 7:59 a.m. - Males: St. Lawrence:
32.8% (16)South Dakota:
18.2% (40,708)
8:00 a.m. to 8:29 a.m. - Males: St. Lawrence:
4.8% (2)South Dakota:
10.2% (22,758)
8:30 a.m. to 8:59 a.m. - Males: St. Lawrence:
22.0% (11)South Dakota:
2.5% (5,556)
9:00 a.m. to 9:59 a.m. - Males: St. Lawrence:
5.4% (3)South Dakota:
2.7% (6,124)
12:00 a.m. to 4:59 a.m. - Females: St. Lawrence:
2.0% (1)South Dakota:
2.9% (5,566)
5:30 a.m. to 5:59 a.m. - Females: St. Lawrence:
10.4% (6)South Dakota:
4.3% (8,121)
6:00 a.m. to 6:29 a.m. - Females: St. Lawrence:
17.9% (11)South Dakota:
5.0% (9,568)
6:30 a.m. to 6:59 a.m. - Females: St. Lawrence:
10.4% (6)South Dakota:
12.2% (23,173)
7:00 a.m. to 7:29 a.m. - Females: St. Lawrence:
8.7% (5)South Dakota:
17.1% (32,449)
7:30 a.m. to 7:59 a.m. - Females: St. Lawrence:
11.0% (6)South Dakota:
21.7% (41,275)
8:00 a.m. to 8:29 a.m. - Females: St. Lawrence:
6.6% (4)South Dakota:
9.7% (18,506)
8:30 a.m. to 8:59 a.m. - Females: St. Lawrence:
14.8% (9)South Dakota:
4.8% (9,131)
9:00 a.m. to 9:59 a.m. - Females: St. Lawrence:
6.3% (4)South Dakota:
4.6% (8,773)
4:00 p.m. to 11:59 p.m. - Females: St. Lawrence:
12.5% (7)South Dakota:
5.3% (10,079)
Travel time to work Percentage of workers working in this county: 93.9%Number of people working at home: 8 (7.0% of all workers )
Less than 5 minutes: St. Lawrence:
15.6% (17)South Dakota:
8.7% (32,545)
5 to 9 minutes: St. Lawrence:
34.9% (38)South Dakota:
21.6% (80,314)
10 to 14 minutes: St. Lawrence:
18.3% (20)South Dakota:
20.5% (76,533)
15 to 19 minutes: St. Lawrence:
1.8% (2)South Dakota:
15.9% (59,230)
20 to 24 minutes: St. Lawrence:
7.3% (8)South Dakota:
10.4% (38,623)
25 to 29 minutes: St. Lawrence:
3.7% (4)South Dakota:
3.0% (11,090)
30 to 34 minutes: St. Lawrence:
7.3% (8)South Dakota:
5.8% (21,530)
40 to 44 minutes: St. Lawrence:
1.8% (2)South Dakota:
1.1% (4,106)
60 to 89 minutes: St. Lawrence:
2.8% (3)South Dakota:
1.8% (6,566)
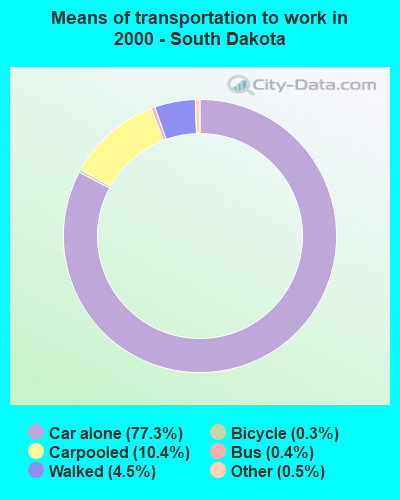
Means of transportation to work Drove car alone: St. Lawrence:
74.3% (81)South Dakota:
77.3% (288,227)
Carpooled: St. Lawrence:
13.8% (15)South Dakota:
10.4% (38,805)
Bus or trolley bus: St. Lawrence:
1.8% (2)South Dakota:
0.4% (1,335)
Walked: St. Lawrence:
3.7% (4)South Dakota:
4.5% (16,786)
Private vehicle occupancy Drove alone: St. Lawrence:
86.5% (93)South Dakota:
91.7% (361,111)
In 2 person carpool: St. Lawrence:
9.1% (10)South Dakota:
5.7% (22,529)
In 3 person carpool: St. Lawrence:
1.0% (1)South Dakota:
1.6% (6,344)
In 4 person carpool: St. Lawrence:
3.1% (3)South Dakota:
0.8% (2,997)
Drove alone: St. Lawrence:
84.4% (81)South Dakota:
88.1% (288,227)
In 2 person carpool: St. Lawrence:
12.5% (12)South Dakota:
9.3% (30,269)
In 3 person carpool: St. Lawrence:
3.1% (3)South Dakota:
1.6% (5,220)
Class of workers
Employee of private company: St. Lawrence:
58.8% (68)South Dakota:
59.4% (273,962)
Self-employed in own incorporated business: St. Lawrence:
0.9% (1)South Dakota:
4.0% (18,550)
Private not-for-profit wage and salary workers: St. Lawrence:
13.2% (15)South Dakota:
13.0% (59,994)
Local government workers: St. Lawrence:
7.9% (9)South Dakota:
7.8% (35,824)
State government workers: St. Lawrence:
2.6% (3)South Dakota:
4.2% (19,563)
Self-employed workers in own not incorporated business: St. Lawrence:
16.7% (19)South Dakota:
7.8% (35,785)
Employee of private company: St. Lawrence:
63.1% (70)South Dakota:
59.7% (223,625)
Self-employed in own incorporated business: St. Lawrence:
0.9% (1)South Dakota:
3.6% (13,641)
Private not-for-profit wage and salary workers: St. Lawrence:
6.3% (7)South Dakota:
9.5% (35,617)
Local government workers: St. Lawrence:
10.8% (12)South Dakota:
6.8% (25,501)
State government workers: St. Lawrence:
2.7% (3)South Dakota:
4.7% (17,748)
Self-employed workers in own not incorporated business: St. Lawrence:
14.4% (16)South Dakota:
11.0% (41,320)
Unpaid family workers: St. Lawrence:
1.8% (2)South Dakota:
0.8% (3,026)
Employee of private company - Males: St. Lawrence:
61.7% (29)South Dakota:
65.4% (159,555)
Private not-for-profit wage and salary workers - Males: St. Lawrence:
2.1% (1)South Dakota:
7.2% (17,479)
Local government workers - Males: St. Lawrence:
10.6% (5)South Dakota:
5.2% (12,624)
Self-employed workers in own not incorporated business - Males: St. Lawrence:
25.5% (12)South Dakota:
9.9% (24,290)
Employee of private company - Females: St. Lawrence:
56.7% (39)South Dakota:
52.8% (114,407)
Self-employed in own incorporated business - Females: St. Lawrence:
1.5% (1)South Dakota:
2.8% (5,977)
Private not-for-profit wage and salary workers - Females: St. Lawrence:
20.9% (14)South Dakota:
19.6% (42,515)
Local government workers - Females: St. Lawrence:
6.0% (4)South Dakota:
10.7% (23,200)
State government workers - Females: St. Lawrence:
4.5% (3)South Dakota:
5.1% (10,991)
Self-employed workers in own not incorporated business - Females: St. Lawrence:
10.4% (7)South Dakota:
5.3% (11,495)