Estimated zip code population in 2022: 503 Zip code population in 2010: 522 Zip code population in 2000: 361
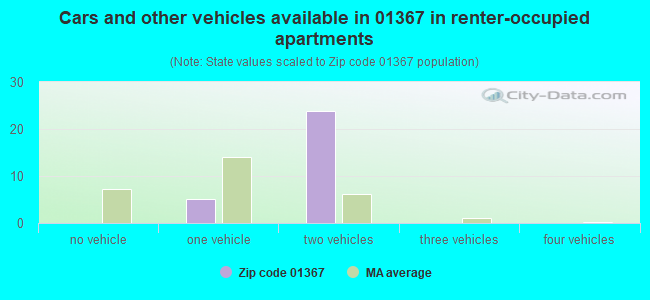
Houses and condos: 277 Renter-occupied apartments: 28
% of renters here:
14%
State:
38%
March 2022 cost of living index in zip code 01367: 85.4 (less than average, U.S. average is 100)
Land area: 26.5 sq. mi. Water area: 0.7 sq. mi.
Population density: 19 people per square mile
(very low).
OSM Map
Google Map
MSN Map
OSM Map
General Map
Google Map
MSN Map
OSM Map
Google Map
MSN Map
OSM Map
Google Map
MSN Map
Please wait while loading the map...
Real estate property taxes paid for housing units in 2022:
This zip code:
0.5% ($1,412)
Massachusetts:
1.0% ($5,536)
Median real estate property taxes paid for housing units with mortgages in 2022: $1,402 (0.5%) Median real estate property taxes paid for housing units with no mortgage in 2022: $1,427 (0.5%)
Business Search- 14 Million verified businesses
Males: 248
(49.2%)
Females: 255
(50.8%)
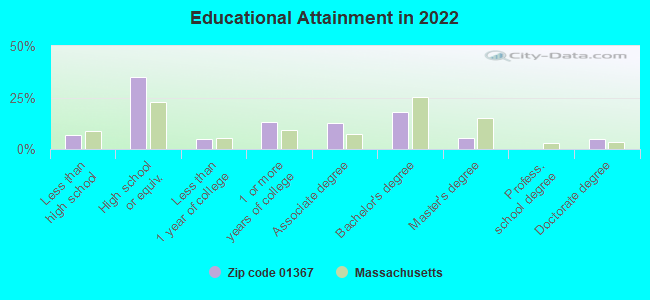
For population 25 years and over in 01367:
High school or higher: 91.8%
Bachelor's degree or higher: 27.5%
Graduate or professional degree: 10.0%
Unemployed: 1.6%
Mean travel time to work (commute): 32.4 minutes
For population 15 years and over in 01367:
Never married: 25.6%
Now married: 60.6%
Separated: 3.0%
Widowed: 2.8%
Divorced: 8.0%
Zip code 01367 compared to state average:
Median house value below state average.
Unemployed percentage below state average.
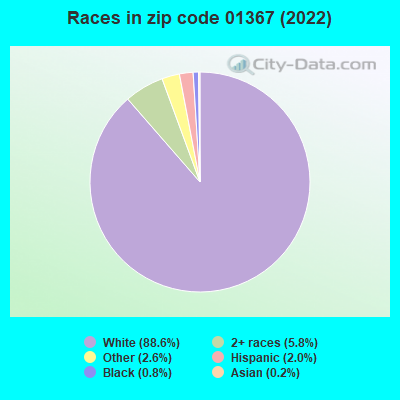
Black race population percentage significantly below state average.
Hispanic race population percentage significantly below state average.
Median age above state average.
Foreign-born population percentage significantly below state average.
Renting percentage significantly below state average.
Number of college students significantly below state average.
Percentage of population with a bachelor's degree or higher below state average.
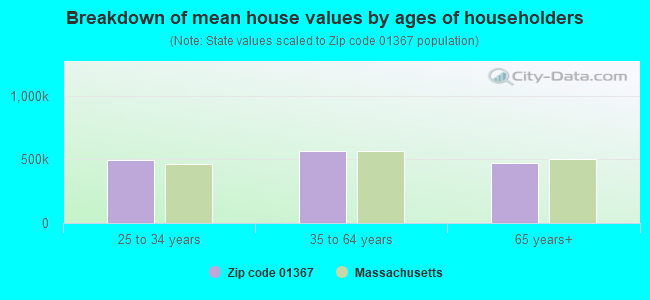
Estimated median house/condo value in 2022: $280,776
01367:
$280,776
Massachusetts:
$534,700
According to our research of Massachusetts and other state lists, there was 1 registered sex offender living in 01367 zip code as of June 16, 2024. The ratio of all residents to sex offenders in zip code 01367 is 695 to 1.
Median resident age:
This zip code:
45.9 years
Massachusetts median age:
40.3 years
Average household size:
This zip code:
2.5 people
Massachusetts:
2.4 people
Averages for the 2020 tax year for zip code 01367, filed in 2021:
Average Adjusted Gross Income (AGI) in 2020: $59,525 (Individual Income Tax Returns)
Here:
$59,525
State:
$105,130
Salary/wage: $48,870 (reported on 71.4% of returns)
Here:
$48,870
State:
$82,951
(% of AGI for various income ranges: 1412.0% for AGIs below $25k, 2957.5% for AGIs $25k-50k, 5216.7% for AGIs $50k-75k, 7700.0% for AGIs $75k-100k, 15933.3% for AGIs $100k-200k)
Taxable interest for individuals: $630 (reported on 35.7% of returns)
This zip code:
$630
Massachusetts:
$2,361
(% of AGI for various income ranges: 26.0% for AGIs below $25k, 30.0% for AGIs $50k-75k, 136.7% for AGIs $100k-200k)
Ordinary dividends: $3,133 (reported on 21.4% of returns)
Here:
$3,133
State:
$10,365
(% of AGI for various income ranges: 142.5% for AGIs $25k-50k, 436.7% for AGIs $100k-200k)
Net capital gain/loss in AGI: +$18,320 (reported on 17.9% of returns)
Here:
+$18,320
State:
+$48,178
(% of AGI for various income ranges: 90.0% for AGIs below $25k, 2903.3% for AGIs $100k-200k)
Taxable individual retirement arrangement distribution: $21,400 (reported on 14.3% of returns)
01367:
$21,400
Massachusetts:
$22,790
(% of AGI for various income ranges: 320.0% for AGIs below $25k, 2320.0% for AGIs $50k-75k)
Earned income credit: $2,133 (reported on 10.7% of returns)
Here:
$2,133
State:
$1,909
(% of AGI for various income ranges: 128.0% for AGIs below $25k)
Percentage of individuals using paid preparers for their 2020 taxes: 89.3%
Here:
89%
State:
92%
(% for various income ranges: 90.0% for AGIs below $25k, 83.3% for AGIs $25k-50k, 75.0% for AGIs $50k-75k, 100.0% for AGIs $75k-100k, 100.0% for AGIs $100k-200k)
Averages for the 2012 tax year for zip code 01367, filed in 2013:
Average Adjusted Gross Income (AGI) in 2012: $45,478 (Individual Income Tax Returns)
Here:
$45,478
State:
$81,425
Salary/wage: $40,819 (reported on 69.6% of returns)
Here:
$40,819
State:
$64,752
(% of AGI for various income ranges: 55.5% for AGIs below $25k, 51.9% for AGIs $25k-50k, 67.3% for AGIs $50k-75k, 153.6% for AGIs $75k-100k)
Taxable interest for individuals: $270 (reported on 43.5% of returns)
This zip code:
$270
Massachusetts:
$2,136
(% of AGI for various income ranges: 0.5% for AGIs below $25k, 0.7% for AGIs $25k-50k, 0.3% for AGIs $75k-100k)
Ordinary dividends: $2,900 (reported on 26.1% of returns)
Here:
$2,900
State:
$9,473
Profit/loss from business: +$8,533 (reported on 13.0% of returns)
Here:
+$8,533
State:
+$20,662
Taxable individual retirement arrangement distribution: $22,175 (reported on 17.4% of returns)
01367:
$22,175
Massachusetts:
$18,892
Total itemized deductions: $16,700 (23% of AGI, reported on 26.1% of returns)
Here:
$16,700
State:
$28,907
Here:
22.9% of AGI
State:
18.2% of AGI
Charity contributions: $1,225 (reported on 17.4% of returns)
Here:
$1,225
State:
$4,208
Taxes paid: $6,617 (reported on 26.1% of returns)
01367:
$6,617
State:
$13,303
Earned income credit: $2,033 (reported on 13.0% of returns)
Here:
$2,033
State:
$1,971
(% of AGI for various income ranges: 6.2% for AGIs below $25k)
Percentage of individuals using paid preparers for their 2012 taxes: 56.5%
Here:
57%
State:
56%
(% for various income ranges: 62.5% for AGIs below $25k, 50.0% for AGIs $25k-50k, 50.0% for AGIs $50k-75k, 100.0% for AGIs $75k-100k)
Averages for the 2004 tax year for zip code 01367, filed in 2005:
Average Adjusted Gross Income (AGI) in 2004: $40,269 (Individual Income Tax Returns)
Here:
$40,269
State:
$62,877
Salary/wage: $36,737 (reported on 81.8% of returns)
Here:
$36,737
State:
$52,969
(% of AGI for various income ranges: 109.4% for AGIs below $10k, 60.0% for AGIs $10k-25k, 68.8% for AGIs $25k-50k, 71.4% for AGIs $50k-75k, 74.9% for AGIs $75k-100k, 87.0% for AGIs over 100k)
Taxable interest for individuals: $647 (reported on 57.4% of returns)
This zip code:
$647
Massachusetts:
$1,945
(% of AGI for various income ranges: 4.4% for AGIs below $10k, 3.7% for AGIs $10k-25k, 1.3% for AGIs $25k-50k, 0.3% for AGIs $50k-75k, 0.3% for AGIs $75k-100k, 0.1% for AGIs over 100k)
Taxable dividends: $2,240 (reported on 31.0% of returns)
Here:
$2,240
State:
$5,323
(% of AGI for various income ranges: 5.5% for AGIs $10k-25k, 3.0% for AGIs $25k-50k, 0.5% for AGIs $50k-75k, 1.9% for AGIs $75k-100k)
Net capital gain/loss: +$171 (reported on 16.9% of returns)
Here:
+$171
State:
+$20,377
Profit/loss from business: +$5,491 (reported on 23.6% of returns)
Here:
+$5,491
State:
+$17,837
(% of AGI for various income ranges: 7.2% for AGIs below $10k, 15.8% for AGIs $10k-25k, 2.9% for AGIs $25k-50k, 3.2% for AGIs $50k-75k)
Total itemized deductions: $15,014 (21% of AGI, reported on 29.8% of returns)
Here:
$15,014
State:
$22,573
Here:
21.4% of AGI
State:
19.5% of AGI
(% of AGI for various income ranges: 16.6% for AGIs $25k-50k, 12.1% for AGIs $50k-75k, 12.7% for AGIs $75k-100k, 10.0% for AGIs over 100k)
Charity contributions deductions: $1,417 (2% of AGI, reported on 24.8% of returns)
Here:
$1,417
State:
$3,295
Here:
1.9% of AGI
State:
2.7% of AGI
(% of AGI for various income ranges: 0.8% for AGIs $25k-50k, 1.0% for AGIs $50k-75k, 0.8% for AGIs $75k-100k, 1.4% for AGIs over 100k)
Total tax: $5,133 (reported on 80.6% of returns)
01367:
$5,133
State:
$11,494
(% of AGI for various income ranges: 2.8% for AGIs below $10k, 5.6% for AGIs $10k-25k, 7.0% for AGIs $25k-50k, 10.2% for AGIs $50k-75k, 10.7% for AGIs $75k-100k, 15.6% for AGIs over 100k)
Earned income credit: $1,577 (reported on 10.7% of returns)
Here:
$1,577
State:
$1,518
Percentage of individuals using paid preparers for their 2004 taxes: 62.8%
Here:
63%
State:
58%
(% for various income ranges: 58.3% for AGIs below $10k, 64.1% for AGIs $10k-25k, 59.3% for AGIs $25k-50k, 64.9% for AGIs $50k-75k, 72.7% for AGIs $75k-100k, 64.7% for AGIs over 100k)
Household received Food Stamps/SNAP in the past 12 months: 31 Household did not receive Food Stamps/SNAP in the past 12 months: 170
Women who had a birth in the past 12 months: 6 (6 now married, 0 unmarried) Women who did not have a birth in the past 12 months: 79 (34 now married, 44 unmarried)
Housing units in zip code 01367 with a mortgage: 93 (16 second mortgage, 16 both second mortgage and home equity loan) Median monthly owner costs for units with a mortgage: $1,573 Median monthly owner costs for units without a mortgage: $449
Residents with income below the poverty level in 2022:
This zip code:
13.4%
Whole state:
10.4%
Residents with income below 50% of the poverty level in 2022:
This zip code:
7.4%
Whole state:
5.1%
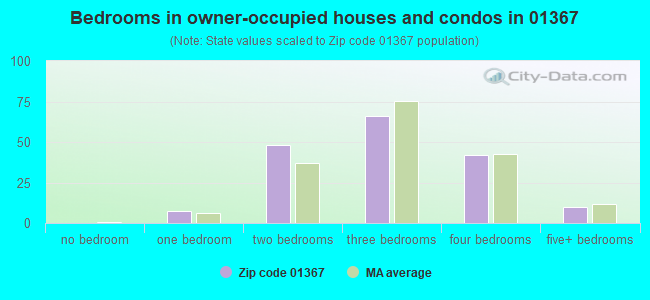
Median number of rooms in houses and condos:
Here:
6.2
State:
6.5
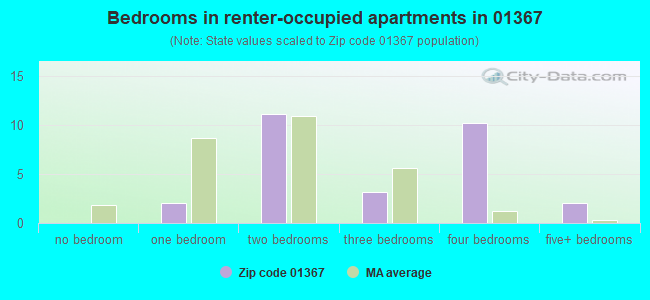
Median number of rooms in apartments:
Here:
6.0
State:
4.0
Notable locations in this zip code not listed on our city pages
Notable locations in zip code 01367: Hoosac Tunnel Station (A), Rowe Camp (B), Yankee Atomic Powerplant (C), Logan Station (D), Rowe Fire Department (E). Display/hide their locations on the map
Size of family households: 68 2-persons, 31 3-persons, 26 4-persons, 7 5-persons, 3 6-persons, 6 7-or-more-persons
Size of nonfamily households: 37 1-person, 18 2-persons, 1 3-persons
91 married couples with children.
15 single-parent households (10 men, 5 women).
98.3% of residents of 01367 zip code speak English at home.
1.3% of residents speak Spanish at home (100% very well).
0.2% of residents speak other Indo-European language at home (100% very well).
Foreign born population: 8 (1.6%) (63.0% of them are naturalized citizens)
This zip code:
1.6%
Whole state:
18.0%
38%Grenada
25%Honduras
25%Bolivia
12%El Salvador
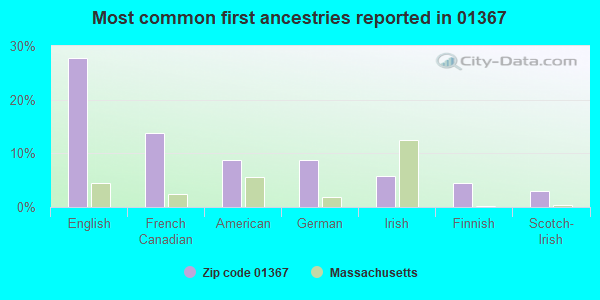
28%English
14%French Canadian
9%American
9%German
6%Irish
4%Finnish
3%Scotch-Irish
Year of entry for the foreign-born population
282010 or later
02000 to 2009
01990 to 1999
6Before 1990
Facilities with environmental interests located in this zip code:
BEAR SWAMP STATION (OFF TUNNEL RD in ROWE, MA)
National Pollutant Discharge Elimination System NON-MAJOR (Tracking pollutant discharge elimination systems) - permit - ICIS-01-2004-9042, FORMAL ENFORCEMENT ACTION, ICIS-, ENFORCEMENT/COMPLIANCE ACTIVITY (Resource Conservation and Recovery Act (tracking hazardous waste)) Business SIC classification: ELECTRIC SERVICES Organizations: BEAR SWAMP POWER CO., LLC (CONTACT/OPERATOR)
, USGEN NEW ENGLAND INC BEAR SWAMP STATION (CONTACT/OPERATOR)
, US GEN NEW ENGLAND INC (CONTACT/OWNER)
Alternative names: NEW ENGLAND POWER CO BEAR SWAMP STATION, TRANSCANADA HYDRO NORTHEAST INC BEAR SWAMP STATION, U S GEN NEW ENGLAND INC, US GEN N.E., INC. BEAR SWAMP, US GEN NEW ENGLAND, INC., US GEN NEW ENGLAND, INC., US GEN NEW ENGLAND INC BEAR SWAMP STATION
YANKEE ATOMIC ELECTRIC CO (49 YANKEE ROAD in ROWE, MA)
AIR SYNTHETIC MINOR (AIRS/AFS) COMPLIANCE ACTIVITY (Tracking inspections of insecticide, fungicide, and rodenticide, and toxic substances) National Pollutant Discharge Elimination System MAJOR (Tracking pollutant discharge elimination systems) - permit HAZARDOUS WASTE BIENNIAL REPORTER (Resource Conservation and Recovery Act (tracking hazardous waste)) Large Quantity Generators, more that 1000 kg of hazardous waste/month (Resource Conservation and Recovery Act (tracking hazardous waste)) - notification Business SIC classification: ELECTRIC SERVICES Organizations: YANKEE ATOMIC ELECTRIC COMPANY (CONTACT/OPERATOR)
, YANKEE ATOMIC ELECTRIC CO. (CONTACT/OPERATOR)
, YANKEE ATOMIC ELECTRIC COMPANY (CONTACT/OWNER)
Alternative names: YANKEE ATOMIC C/O DUKE ENG/SER, YANKEE NUCLEAR POWER STA
Housing units lacking complete plumbing facilities: 5.5% Housing units lacking complete kitchen facilities: 5.3%
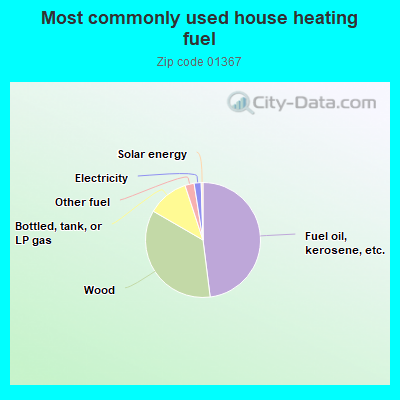
48.5%Fuel oil, kerosene, etc.
35.7%Wood
11.7%Bottled, tank, or LP gas
2.6%Other fuel
2.0%Electricity
0.5%Solar energy
Population in 1990: 630.
Place of birth for U.S.-born residents:
This state: 327
Northeast: 113
Midwest: 13
South: 15
67% of the 01367 zip code residents lived in the same house 5 years ago. Out of people who lived in different houses, 60% lived in this county. Out of people who lived in different counties, 50% lived in Massachusetts.
94% of the 01367 zip code residents lived in the same house 1 year ago. Out of people who lived in different houses, 65% moved from this county. Out of people who lived in different houses, 4% moved from different county within same state. Out of people who lived in different houses, 26% moved from different state.
Private vs. public school enrollment:
Students in private schools in grades 1 to 8 (elementary and middle school): 10
Here:
17.2%
Massachusetts:
10.3%
Students in private schools in grades 9 to 12 (high school): 1
Here:
5.0%
Massachusetts:
12.3%
Students in private undergraduate colleges: 2
Here:
35.6%
Massachusetts:
51.2%
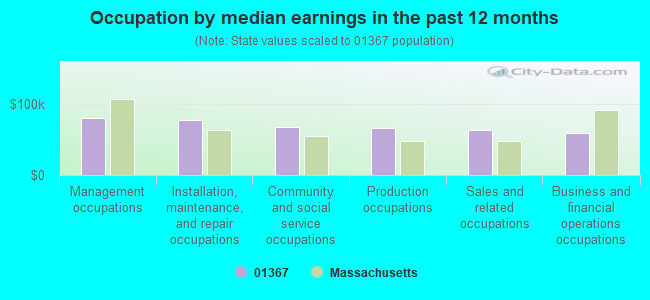
Occupation by median earnings in the past 12 months ($)
80,706Management occupations
76,835Installation, maintenance, and repair occupations
67,245Community and social service occupations
65,456Production occupations
63,241Sales and related occupations
59,041Business and financial operations occupations
Top industries in this zip code by the number of employees in 2005:
Administrative and Support and Waste Management and Remediation Services: Security Systems Services (except Locksmiths) (50-99 employees: 1 establishment)
Accommodation and Food Services: Recreational and Vacation Camps (except Campgrounds) (10-19: 1)
Construction: Residential Remodelers (1-4: 1)
Other Services (except Public Administration): Civic and Social Organizations (1-4: 1)
Arts, Entertainment, and Recreation: Museums (1-4: 1)
Professional, Scientific, and Technical Services: Administrative Management and General Management Consulting Services (1-4: 1)
Construction: Site Preparation Contractors (1-4: 1)
Fatal accident statistics in 2013:
Fatal accident count: 1
Vehicles involved in fatal accidents: 1
Fatal accidents caused by drunken drivers: 0
Fatalities: 1
Persons involved in fatal accidents: 3
Pedestrians involved in fatal accidents: 0
Home Mortgage Disclosure Act Aggregated Statistics For Year 2009 (Based on 2 partial tracts)
A) FHA, FSA/RHS & VA Home Purchase Loans
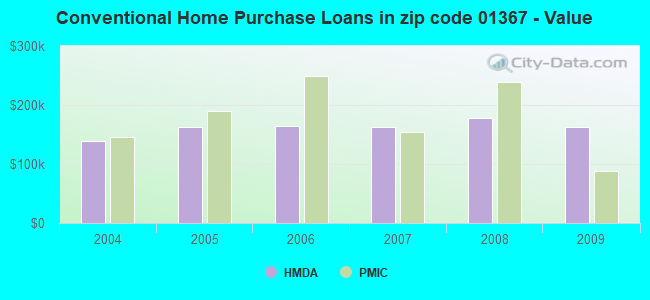
B) Conventional Home Purchase Loans
C) Refinancings
D) Home Improvement Loans
F) Non-occupant Loans on < 5 Family Dwellings (A B C & D)
G) Loans On Manufactured Home Dwelling (A B C & D)
Number
Average Value
Number
Average Value
Number
Average Value
Number
Average Value
Number
Average Value
Number
Average Value
LOANS ORIGINATED
1
$143,940
6
$163,292
31
$159,602
5
$104,698
3
$189,980
0
$0
APPLICATIONS APPROVED, NOT ACCEPTED
0
$0
1
$366,410
2
$197,875
1
$55,010
1
$250,290
0
$0
APPLICATIONS DENIED
0
$0
1
$76,710
9
$187,333
3
$65,193
1
$65,090
1
$51,040
APPLICATIONS WITHDRAWN
0
$0
1
$288,790
8
$168,041
0
$0
1
$277,480
0
$0
FILES CLOSED FOR INCOMPLETENESS
0
$0
0
$0
3
$213,717
0
$0
0
$0
0
$0
Aggregated Statistics For Year 2008 (Based on 2 partial tracts)
A) FHA, FSA/RHS & VA Home Purchase Loans
B) Conventional Home Purchase Loans
C) Refinancings
D) Home Improvement Loans
F) Non-occupant Loans on < 5 Family Dwellings (A B C & D)
G) Loans On Manufactured Home Dwelling (A B C & D)
Number
Average Value
Number
Average Value
Number
Average Value
Number
Average Value
Number
Average Value
Number
Average Value
LOANS ORIGINATED
2
$146,690
9
$177,383
21
$128,614
9
$73,072
4
$148,750
0
$0
APPLICATIONS APPROVED, NOT ACCEPTED
1
$81,290
1
$119,800
2
$98,250
1
$110,020
0
$0
0
$0
APPLICATIONS DENIED
1
$99,320
1
$58,060
11
$175,498
5
$91,252
1
$208,110
1
$28,730
APPLICATIONS WITHDRAWN
0
$0
0
$0
5
$146,382
1
$115,820
0
$0
0
$0
FILES CLOSED FOR INCOMPLETENESS
0
$0
0
$0
1
$108,490
1
$6,110
0
$0
0
$0
Aggregated Statistics For Year 2007 (Based on 2 partial tracts)
A) FHA, FSA/RHS & VA Home Purchase Loans
B) Conventional Home Purchase Loans
C) Refinancings
D) Home Improvement Loans
F) Non-occupant Loans on < 5 Family Dwellings (A B C & D)
G) Loans On Manufactured Home Dwelling (A B C & D)
Number
Average Value
Number
Average Value
Number
Average Value
Number
Average Value
Number
Average Value
Number
Average Value
LOANS ORIGINATED
1
$161,360
12
$162,172
26
$122,969
9
$64,787
4
$162,428
1
$133,550
APPLICATIONS APPROVED, NOT ACCEPTED
0
$0
0
$0
3
$187,740
1
$69,680
0
$0
0
$0
APPLICATIONS DENIED
0
$0
3
$161,357
19
$127,708
4
$64,558
2
$84,345
1
$29,030
APPLICATIONS WITHDRAWN
0
$0
1
$212,390
6
$170,678
0
$0
0
$0
1
$32,700
FILES CLOSED FOR INCOMPLETENESS
0
$0
0
$0
2
$298,420
0
$0
0
$0
0
$0
Aggregated Statistics For Year 2006 (Based on 2 partial tracts)
A) FHA, FSA/RHS & VA Home Purchase Loans
B) Conventional Home Purchase Loans
C) Refinancings
D) Home Improvement Loans
E) Loans on Dwellings For 5+ Families
F) Non-occupant Loans on < 5 Family Dwellings (A B C & D)
G) Loans On Manufactured Home Dwelling (A B C & D)
Number
Average Value
Number
Average Value
Number
Average Value
Number
Average Value
Number
Average Value
Number
Average Value
Number
Average Value
LOANS ORIGINATED
1
$187,640
14
$163,824
29
$122,830
11
$67,844
1
$82,510
5
$160,502
1
$20,480
APPLICATIONS APPROVED, NOT ACCEPTED
0
$0
4
$112,538
9
$132,257
1
$102,070
0
$0
2
$78,845
0
$0
APPLICATIONS DENIED
0
$0
5
$150,294
23
$153,663
9
$90,491
0
$0
1
$109,100
2
$58,980
APPLICATIONS WITHDRAWN
0
$0
2
$118,880
14
$177,161
1
$93,210
0
$0
1
$32,700
0
$0
FILES CLOSED FOR INCOMPLETENESS
0
$0
1
$400,340
5
$184,216
0
$0
0
$0
0
$0
0
$0
Aggregated Statistics For Year 2005 (Based on 2 partial tracts)
A) FHA, FSA/RHS & VA Home Purchase Loans
B) Conventional Home Purchase Loans
C) Refinancings
D) Home Improvement Loans
F) Non-occupant Loans on < 5 Family Dwellings (A B C & D)
G) Loans On Manufactured Home Dwelling (A B C & D)
Number
Average Value
Number
Average Value
Number
Average Value
Number
Average Value
Number
Average Value
Number
Average Value
LOANS ORIGINATED
1
$107,570
13
$162,603
40
$127,130
12
$75,738
3
$218,300
1
$40,340
APPLICATIONS APPROVED, NOT ACCEPTED
0
$0
2
$155,245
6
$117,605
2
$36,670
1
$172,970
0
$0
APPLICATIONS DENIED
0
$0
2
$165,940
26
$115,023
6
$90,508
1
$39,120
1
$39,730
APPLICATIONS WITHDRAWN
0
$0
4
$127,052
21
$147,736
2
$113,225
2
$145,925
1
$82,820
FILES CLOSED FOR INCOMPLETENESS
0
$0
2
$86,485
3
$115,823
0
$0
0
$0
0
$0
Aggregated Statistics For Year 2004 (Based on 2 partial tracts)
A) FHA, FSA/RHS & VA Home Purchase Loans
B) Conventional Home Purchase Loans
C) Refinancings
D) Home Improvement Loans
F) Non-occupant Loans on < 5 Family Dwellings (A B C & D)
G) Loans On Manufactured Home Dwelling (A B C & D)


 Nearest zip codes: 01343, 01350, 01346, 05361, 01339, 05350.