Estimated zip code population in 2022: 18,742 Zip code population in 2010: 14,925 Zip code population in 2000: 13,346
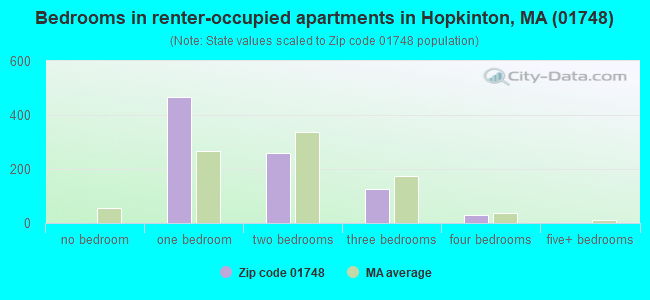
Houses and condos: 7,094 Renter-occupied apartments: 880
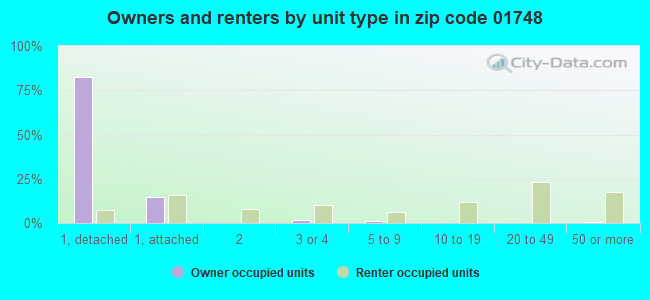
% of renters here:
13%
State:
38%
March 2022 cost of living index in zip code 01748: 133.9 (high, U.S. average is 100)
Land area: 26.3 sq. mi. Water area: 1.6 sq. mi.
Population density: 714 people per square mile
(low).
OSM Map
Google Map
MSN Map
OSM Map
General Map
Google Map
MSN Map
OSM Map
Google Map
MSN Map
OSM Map
Google Map
MSN Map
Please wait while loading the map...
Real estate property taxes paid for housing units in 2022:
This zip code:
1.3% ($9,915)
Massachusetts:
1.0% ($5,536)
Median real estate property taxes paid for housing units with mortgages in 2022: $9,911 (1.3%) Median real estate property taxes paid for housing units with no mortgage in 2022: $9,925 (1.3%)
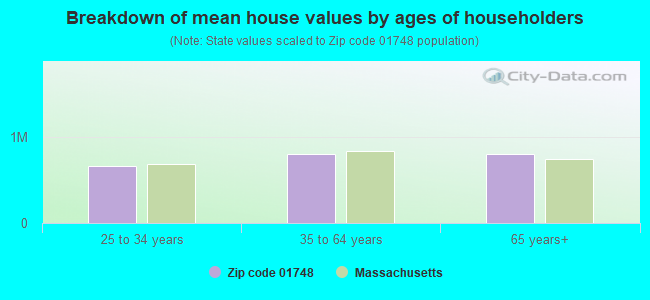
Estimated median house/condo value in 2022: $778,569
01748:
$778,569
Massachusetts:
$534,700
According to our research of Massachusetts and other state lists, there was 1 registered sex offender living in 01748 zip code as of June 15, 2024. The ratio of all residents to sex offenders in zip code 01748 is 16,490 to 1. The ratio of registered sex offenders to all residents in this zip code is much lower than the state average.
Median resident age:
This zip code:
42.4 years
Massachusetts median age:
40.3 years
Average household size:
This zip code:
2.7 people
Massachusetts:
2.4 people
Averages for the 2020 tax year for zip code 01748, filed in 2021:
Average Adjusted Gross Income (AGI) in 2020: $206,334 (Individual Income Tax Returns)
Here:
$206,334
State:
$105,130
Salary/wage: $173,882 (reported on 85.6% of returns)
Here:
$173,882
State:
$82,951
(% of AGI for various income ranges: 1203.6% for AGIs below $25k, 3601.4% for AGIs $25k-50k, 6345.0% for AGIs $50k-75k, 9934.6% for AGIs $75k-100k, 21812.3% for AGIs $100k-200k, 122354.5% for AGIs over 200k)
Taxable interest for individuals: $2,343 (reported on 57.3% of returns)
This zip code:
$2,343
Massachusetts:
$2,361
(% of AGI for various income ranges: 33.8% for AGIs below $25k, 57.4% for AGIs $25k-50k, 113.8% for AGIs $50k-75k, 109.2% for AGIs $75k-100k, 153.9% for AGIs $100k-200k, 1063.4% for AGIs over 200k)
Ordinary dividends: $8,633 (reported on 46.1% of returns)
Here:
$8,633
State:
$10,365
(% of AGI for various income ranges: 60.3% for AGIs below $25k, 157.6% for AGIs $25k-50k, 191.0% for AGIs $50k-75k, 322.7% for AGIs $75k-100k, 505.5% for AGIs $100k-200k, 3244.8% for AGIs over 200k)
Net capital gain/loss in AGI: +$44,411 (reported on 43.4% of returns)
Here:
+$44,411
State:
+$48,178
(% of AGI for various income ranges: 34.9% for AGIs below $25k, 122.4% for AGIs $25k-50k, 186.6% for AGIs $50k-75k, 271.6% for AGIs $75k-100k, 721.9% for AGIs $100k-200k, 19678.4% for AGIs over 200k)
Profit/loss from business: +$35,762 (reported on 16.4% of returns)
Here:
+$35,762
State:
+$20,792
(% of AGI for various income ranges: 95.0% for AGIs below $25k, 240.3% for AGIs $25k-50k, 329.6% for AGIs $50k-75k, 405.9% for AGIs $75k-100k, 837.1% for AGIs $100k-200k, 4644.9% for AGIs over 200k)
Taxable individual retirement arrangement distribution: $24,508 (reported on 10.1% of returns)
01748:
$24,508
Massachusetts:
$22,790
(% of AGI for various income ranges: 74.4% for AGIs below $25k, 160.3% for AGIs $25k-50k, 380.0% for AGIs $50k-75k, 727.3% for AGIs $75k-100k, 771.3% for AGIs $100k-200k, 976.6% for AGIs over 200k)
Self-employed (Keogh) retirement plans: $33,233 (reported on 2.8% of returns)
01748:
$33,233
Massachusetts:
$26,868
(% of AGI for various income ranges: 75.3% for AGIs $100k-200k, 905.7% for AGIs over 200k)
Total itemized deductions: $33,907 (reported on 25.5% of returns)
Here:
$33,907
State:
$36,722
(% of AGI for various income ranges: 131.4% for AGIs below $25k, 307.4% for AGIs $25k-50k, 670.4% for AGIs $50k-75k, 847.6% for AGIs $75k-100k, 1475.5% for AGIs $100k-200k, 6378.1% for AGIs over 200k)
Charity contributions: $7,582 (reported on 20.5% of returns)
Here:
$7,582
State:
$12,529
(% of AGI for various income ranges: 6.0% for AGIs below $25k, 19.5% for AGIs $25k-50k, 57.6% for AGIs $50k-75k, 87.0% for AGIs $75k-100k, 162.6% for AGIs $100k-200k, 1391.9% for AGIs over 200k)
Taxes paid: $9,693 (reported on 25.3% of returns)
01748:
$9,693
State:
$8,782
(% of AGI for various income ranges: 32.4% for AGIs below $25k, 81.4% for AGIs $25k-50k, 201.2% for AGIs $50k-75k, 306.2% for AGIs $75k-100k, 508.4% for AGIs $100k-200k, 1681.9% for AGIs over 200k)
Earned income credit: $1,819 (reported on 3.1% of returns)
Here:
$1,819
State:
$1,909
(% of AGI for various income ranges: 31.0% for AGIs below $25k, 30.7% for AGIs $25k-50k)
Percentage of individuals using paid preparers for their 2020 taxes: 93.2%
Here:
93%
State:
92%
(% for various income ranges: 90.8% for AGIs below $25k, 89.7% for AGIs $25k-50k, 92.1% for AGIs $50k-75k, 93.4% for AGIs $75k-100k, 93.4% for AGIs $100k-200k, 96.0% for AGIs over 200k)
Averages for the 2012 tax year for zip code 01748, filed in 2013:
Average Adjusted Gross Income (AGI) in 2012: $168,412 (Individual Income Tax Returns)
Here:
$168,412
State:
$81,425
Salary/wage: $139,443 (reported on 87.4% of returns)
Here:
$139,443
State:
$64,752
(% of AGI for various income ranges: 71.2% for AGIs below $25k, 73.6% for AGIs $25k-50k, 73.1% for AGIs $50k-75k, 75.8% for AGIs $75k-100k, 83.4% for AGIs $100k-200k, 69.0% for AGIs over 200k)
Taxable interest for individuals: $2,560 (reported on 58.4% of returns)
This zip code:
$2,560
Massachusetts:
$2,136
(% of AGI for various income ranges: 1.6% for AGIs below $25k, 1.0% for AGIs $25k-50k, 0.8% for AGIs $50k-75k, 0.8% for AGIs $75k-100k, 0.6% for AGIs $100k-200k, 0.9% for AGIs over 200k)
Ordinary dividends: $11,527 (reported on 43.0% of returns)
Here:
$11,527
State:
$9,473
(% of AGI for various income ranges: 3.7% for AGIs below $25k, 2.5% for AGIs $25k-50k, 2.7% for AGIs $50k-75k, 1.6% for AGIs $75k-100k, 1.5% for AGIs $100k-200k, 3.4% for AGIs over 200k)
Net capital gain/loss in AGI: +$24,730 (reported on 38.9% of returns)
Here:
+$24,730
State:
+$31,437
(% of AGI for various income ranges: 0.5% for AGIs below $25k, 0.9% for AGIs $25k-50k, 0.6% for AGIs $50k-75k, 0.4% for AGIs $75k-100k, 1.1% for AGIs $100k-200k, 7.8% for AGIs over 200k)
Profit/loss from business: +$35,340 (reported on 18.5% of returns)
Here:
+$35,340
State:
+$20,662
(% of AGI for various income ranges: 9.0% for AGIs below $25k, 6.2% for AGIs $25k-50k, 3.9% for AGIs $50k-75k, 4.8% for AGIs $75k-100k, 4.4% for AGIs $100k-200k, 3.5% for AGIs over 200k)
Taxable individual retirement arrangement distribution: $21,403 (reported on 10.5% of returns)
01748:
$21,403
Massachusetts:
$18,892
(% of AGI for various income ranges: 5.1% for AGIs below $25k, 3.3% for AGIs $25k-50k, 3.2% for AGIs $50k-75k, 3.3% for AGIs $75k-100k, 1.9% for AGIs $100k-200k, 0.8% for AGIs over 200k)
Self-employment retirement plans: $22,641 (reported on 3.1% of returns)
01748:
$22,641
Massachusetts:
$20,669
(% of AGI for various income ranges: 0.5% for AGIs $100k-200k, 0.5% for AGIs over 200k)
Total itemized deductions: $41,258 (16% of AGI, reported on 61.6% of returns)
Here:
$41,258
State:
$28,907
Here:
16.2% of AGI
State:
18.2% of AGI
(% of AGI for various income ranges: 21.5% for AGIs below $25k, 17.4% for AGIs $25k-50k, 19.7% for AGIs $50k-75k, 21.1% for AGIs $75k-100k, 18.7% for AGIs $100k-200k, 13.3% for AGIs over 200k)
Charity contributions: $5,993 (reported on 54.0% of returns)
Here:
$5,993
State:
$4,208
(% of AGI for various income ranges: 0.6% for AGIs below $25k, 1.0% for AGIs $25k-50k, 1.1% for AGIs $50k-75k, 1.5% for AGIs $75k-100k, 1.2% for AGIs $100k-200k, 2.2% for AGIs over 200k)
Taxes paid: $21,640 (reported on 61.6% of returns)
01748:
$21,640
State:
$13,303
(% of AGI for various income ranges: 6.9% for AGIs below $25k, 6.6% for AGIs $25k-50k, 8.5% for AGIs $50k-75k, 9.3% for AGIs $75k-100k, 9.6% for AGIs $100k-200k, 7.4% for AGIs over 200k)
Earned income credit: $1,482 (reported on 4.0% of returns)
Here:
$1,482
State:
$1,971
(% of AGI for various income ranges: 1.8% for AGIs below $25k, 0.4% for AGIs $25k-50k)
Percentage of individuals using paid preparers for their 2012 taxes: 56.5%
Here:
57%
State:
56%
(% for various income ranges: 49.5% for AGIs below $25k, 51.9% for AGIs $25k-50k, 55.2% for AGIs $50k-75k, 56.6% for AGIs $75k-100k, 56.7% for AGIs $100k-200k, 67.5% for AGIs over 200k)
Averages for the 2004 tax year for zip code 01748, filed in 2005:
Average Adjusted Gross Income (AGI) in 2004: $145,374 (Individual Income Tax Returns)
Here:
$145,374
State:
$62,877
Salary/wage: $116,357 (reported on 86.5% of returns)
Here:
$116,357
State:
$52,969
(% of AGI for various income ranges: 164.7% for AGIs below $10k, 65.5% for AGIs $10k-25k, 73.6% for AGIs $25k-50k, 78.6% for AGIs $50k-75k, 82.9% for AGIs $75k-100k, 67.4% for AGIs over 100k)
Taxable interest for individuals: $2,400 (reported on 73.7% of returns)
This zip code:
$2,400
Massachusetts:
$1,945
(% of AGI for various income ranges: 12.9% for AGIs below $10k, 4.1% for AGIs $10k-25k, 1.7% for AGIs $25k-50k, 1.1% for AGIs $50k-75k, 1.1% for AGIs $75k-100k, 1.1% for AGIs over 100k)
Taxable dividends: $5,403 (reported on 49.3% of returns)
Here:
$5,403
State:
$5,323
(% of AGI for various income ranges: 14.8% for AGIs below $10k, 3.6% for AGIs $10k-25k, 2.1% for AGIs $25k-50k, 1.5% for AGIs $50k-75k, 1.0% for AGIs $75k-100k, 1.8% for AGIs over 100k)
Net capital gain/loss: +$14,121 (reported on 45.7% of returns)
Here:
+$14,121
State:
+$20,377
(% of AGI for various income ranges: -11.9% for AGIs below $10k, 2.0% for AGIs $10k-25k, 0.5% for AGIs $25k-50k, 1.4% for AGIs $50k-75k, 1.0% for AGIs $75k-100k, 5.1% for AGIs over 100k)
Profit/loss from business: +$26,373 (reported on 18.7% of returns)
Here:
+$26,373
State:
+$17,837
(% of AGI for various income ranges: 4.8% for AGIs below $10k, 9.5% for AGIs $10k-25k, 7.9% for AGIs $25k-50k, 8.0% for AGIs $50k-75k, 5.5% for AGIs $75k-100k, 2.7% for AGIs over 100k)
IRA payment deduction: $3,338 (reported on 3.9% of returns)
01748:
$3,338
Massachusetts:
$3,100
(% of AGI for various income ranges: 0.4% for AGIs $10k-25k, 0.4% for AGIs $25k-50k, 0.3% for AGIs $50k-75k, 0.3% for AGIs $75k-100k, 0.1% for AGIs over 100k)
Self-employed pension: $15,077 (reported on 3.3% of returns)
Here:
$15,077
Massachusetts:
$14,516
(% of AGI for various income ranges: 0.5% for AGIs $25k-50k, 0.3% for AGIs $50k-75k, 0.2% for AGIs $75k-100k, 0.4% for AGIs over 100k)
Total itemized deductions: $34,737 (16% of AGI, reported on 64.0% of returns)
Here:
$34,737
State:
$22,573
Here:
16.1% of AGI
State:
19.5% of AGI
(% of AGI for various income ranges: 45.6% for AGIs below $10k, 23.0% for AGIs $10k-25k, 20.8% for AGIs $25k-50k, 23.3% for AGIs $50k-75k, 23.4% for AGIs $75k-100k, 13.9% for AGIs over 100k)
Charity contributions deductions: $3,757 (2% of AGI, reported on 59.9% of returns)
Here:
$3,757
State:
$3,295
Here:
1.7% of AGI
State:
2.7% of AGI
(% of AGI for various income ranges: 1.2% for AGIs below $10k, 1.5% for AGIs $10k-25k, 1.6% for AGIs $25k-50k, 1.7% for AGIs $50k-75k, 2.0% for AGIs $75k-100k, 1.5% for AGIs over 100k)
Total tax: $34,161 (reported on 84.1% of returns)
01748:
$34,161
State:
$11,494
(% of AGI for various income ranges: 5.5% for AGIs below $10k, 5.4% for AGIs $10k-25k, 8.5% for AGIs $25k-50k, 9.5% for AGIs $50k-75k, 9.9% for AGIs $75k-100k, 21.7% for AGIs over 100k)
Earned income credit: $1,288 (reported on 3.2% of returns)
Here:
$1,288
State:
$1,518
Percentage of individuals using paid preparers for their 2004 taxes: 57.4%
Here:
57%
State:
58%
(% for various income ranges: 45.6% for AGIs below $10k, 57.0% for AGIs $10k-25k, 58.1% for AGIs $25k-50k, 62.1% for AGIs $50k-75k, 58.4% for AGIs $75k-100k, 61.6% for AGIs over 100k)
Household received Food Stamps/SNAP in the past 12 months: 171 Household did not receive Food Stamps/SNAP in the past 12 months: 6,476
Women who had a birth in the past 12 months: 145 (137 now married, 12 unmarried) Women who did not have a birth in the past 12 months: 4,025 (2,254 now married, 1,722 unmarried)
Housing units in zip code 01748 with a mortgage: 4,394 (502 second mortgage, 8 home equity loan, 428 both second mortgage and home equity loan) Houses without a mortgage: 25
Median monthly owner costs for units with a mortgage: $3,465 Median monthly owner costs for units without a mortgage: $1,499
Residents with income below the poverty level in 2022:
This zip code:
4.5%
Whole state:
10.4%
Residents with income below 50% of the poverty level in 2022:
This zip code:
2.0%
Whole state:
5.1%
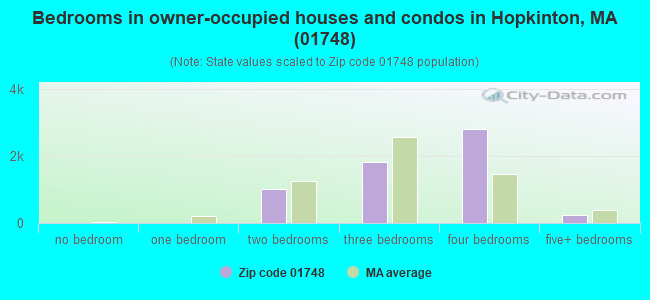
Median number of rooms in houses and condos:
Here:
8.1
State:
6.5
Median number of rooms in apartments:
Here:
3.3
State:
4.0
Notable locations in this zip code not listed on our city pages
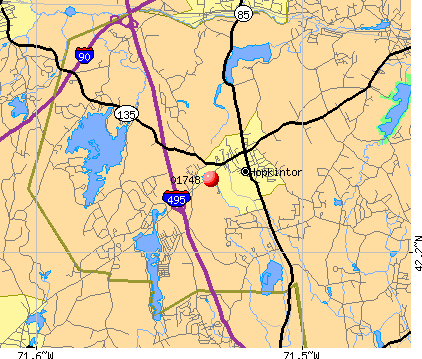
Notable locations in zip code 01748: Hopkinton Fire Department Station 2 (A), Old Stone Tavern (B), Hopkinton Fire Department Headquarters (C), Hopkinton Public Library (D), Hopkinton Town Hall (E). Display/hide their locations on the map
Churches in zip code 01748 include: Woodville Baptist Church (A), Vineyard Church of Hopkinton (B), Saint Pauls Episcopal Church (C), Saint John the Evangelist Church (D), Korean Presbyterian Church (E), First Congregational Church (F), Bahai Faith Church (G). Display/hide their locations on the map
Lakes and reservoirs: Bloods Pond (A), Icehouse Pond (B), Whitehall Reservoir (C), Hayes Pond (D), North Pond (E), Sudbury River Reservoir (F), Echo Lake (G), Duck Pond (H). Display/hide their locations on the map
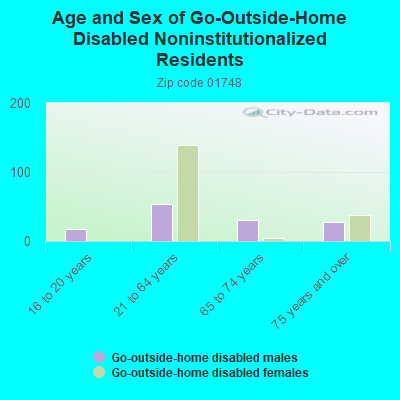
In group quarters: 120 (-1 institutionalized population)
Size of family households: 1,752 2-persons, 1,664 3-persons, 1,485 4-persons, 385 5-persons, 85 6-persons, 54 7-or-more-persons
Size of nonfamily households: 1,142 1-person, 159 2-persons
4,537 married couples with children.
374 single-parent households (188 men, 186 women).
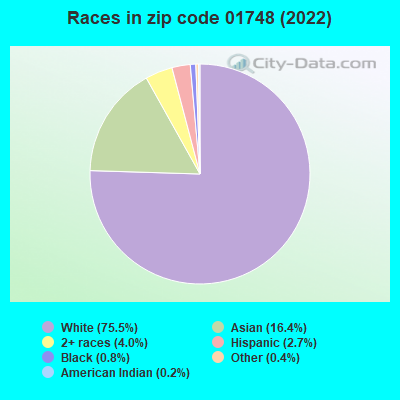
78.9% of residents of 01748 zip code speak English at home.
1.8% of residents speak Spanish at home (70% very well, 14% well, 16% not well).
10.9% of residents speak other Indo-European language at home (91% very well, 7% well, 1% not well).
6.7% of residents speak Asian or Pacific Island language at home (79% very well, 13% well, 4% not well, 4% not at all).
1.0% of residents speak other language at home (80% very well, 20% well).
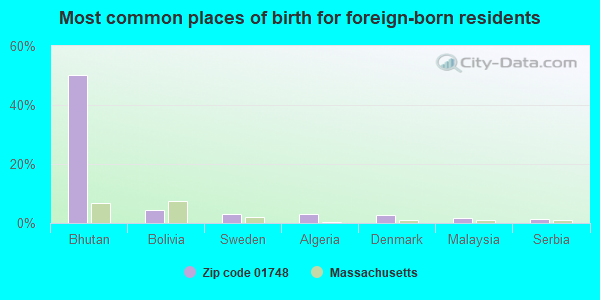
Foreign born population: 3,183 (17.0%) (55.5% of them are naturalized citizens)
This zip code:
17.0%
Whole state:
18.0%
50%Bhutan
4%Bolivia
3%Sweden
3%Algeria
3%Denmark
2%Malaysia
1%Serbia
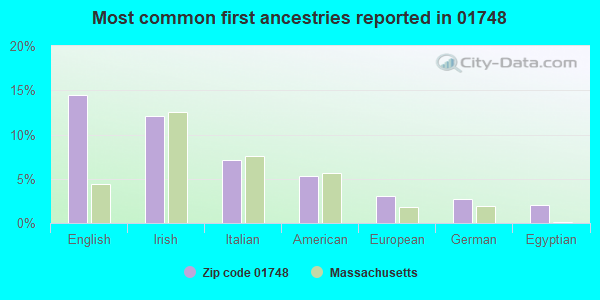
14%English
12%Irish
7%Italian
5%American
3%European
3%German
2%Egyptian
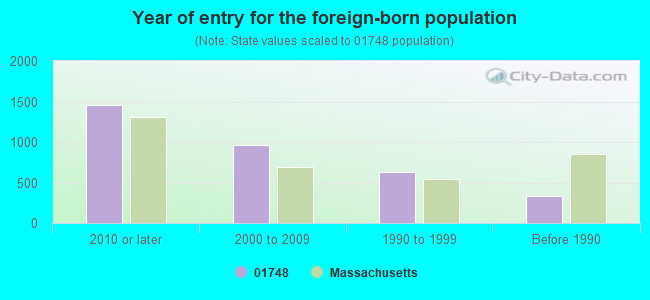
Year of entry for the foreign-born population
1,4542010 or later
9662000 to 2009
6351990 to 1999
337Before 1990
Major facilities with environmental interests located in this zip code:
CAMBREX BIO SCIENCE HOPKINTON INC (97 SOUTH ST in HOPKINTON, MA)
ENFORCEMENT/COMPLIANCE ACTIVITY (Integrated Compliance Information System) - ICIS-01-2004-9117, FORMAL ENFORCEMENT ACTION (Integrated Compliance Information System) - ICIS-01-2004-9117, FORMAL ENFORCEMENT ACTION Small Quantity Generators, between 100 kg and 1000 kg of hazardous waste/month (Resource Conservation and Recovery Act (tracking hazardous waste)) - notification Organizations: CAMBREX CORP (CONTACT/OWNER)
Alternative names: CAMBREX BIO SCIENCE MA, MARATHON, A DIVISION OF COPHARMA, MARATHON BIOPHARMACEUTICALS L L C
ZYMARK CORP (68 ELM STREET in HOPKINTON, MA)
STATE MASTER (MA-EPICS) - RCRAINFO-MAR000012161, HAZARDOUS WASTE PROGRAM Small Quantity Generators, between 100 kg and 1000 kg of hazardous waste/month (Resource Conservation and Recovery Act (tracking hazardous waste)) - notification Business NAICS classification: LABORATORY APPARATUS AND FURNITURE MANUFACTURING. Organizations: MGI PROPERTY MANAGEMENT INC (CONTACT/OWNER)
, BERWIND PHARMACEUTICALS SERVICES INC (CONTACT/OWNER)
EMC CORP (171 SOUTH ST in HOPKINTON, MA)
AIR MINOR (AIRS/AFS) CRITERIA AND HAZARDOUS AIR POLLUTANT INVENTORY (Inventory of air pollution sources) Conditionally Exempt Small Quantity Generators, less than 100 kg/month of hazardous waste (Resource Conservation and Recovery Act (tracking hazardous waste)) - notification Business SIC classification: ELECTRONIC COMPONENTS; PREPACKAGED SOFTWARE Business NAICS classification: OTHER ELECTRONIC COMPONENT MANUFACTURING. Organizations: EMC CORPORATION (CONTACT/OPERATOR)
, E M C CORPORATION (CONTACT/OWNER)
Alternative names: E M C CORP, EMC CORPORATION
ELMWOOD (14 ELM STREET in HOPKINTON, MA)
(National Center for Education Statistics) - STATE ID-139010 Organizations: HOPKINTON (SCHOOL DISTRICT)
ZYMARK CORP (70 ELM ST in HOPKINTON, MA)
(Resource Conservation and Recovery Act (tracking hazardous waste)) Small Quantity Generators, between 100 kg and 1000 kg of hazardous waste/month (Resource Conservation and Recovery Act (tracking hazardous waste)) - notification Business NAICS classification: LABORATORY APPARATUS AND FURNITURE MANUFACTURING. Organizations: M G I PROPERTY MANAGEMENT INC (CONTACT/OWNER)
, BERWIND PHARMACEUTICALS SERVICES INC (CONTACT/OWNER)
Alternative names: CALIPER LIFE SCIENCES WORLDWIDE HEADQUARTERS
NOREMAC MFG CORP (90 EAST MAIN ST in HOPKINTON, MA)
LASERSHARP CORPORATION (86 SOUTH ST in HOPKINTON, MA)
Small Quantity Generators, between 100 kg and 1000 kg of hazardous waste/month (Resource Conservation and Recovery Act (tracking hazardous waste)) - notification Business NAICS classification: SEMICONDUCTOR AND RELATED DEVICE MANUFACTURING. Organizations: JEEBO PROPERTY MGT (CONTACT/OWNER)
BOSE CORP (7 AVENUE E in HOPKINTON, MA)
(Resource Conservation and Recovery Act (tracking hazardous waste)) Organizations: BOSE DR AMAR (CONTACT/OWNER)
Housing units lacking complete kitchen facilities: 0.4%
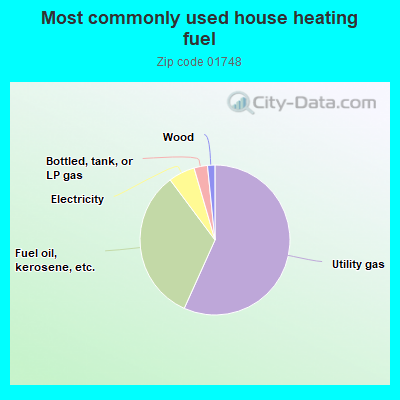
56.8%Utility gas
33.1%Fuel oil, kerosene, etc.
5.7%Electricity
2.9%Bottled, tank, or LP gas
1.6%Wood
Population in 1990: 9,191. Population change in the 1990s: +4,155 (+45.2%).
Place of birth for U.S.-born residents:
This state: 10,289
Northeast: 3,317
Midwest: 503
South: 754
West: 498
61% of the 01748 zip code residents lived in the same house 5 years ago. Out of people who lived in different houses, 51% lived in this county. Out of people who lived in different counties, 50% lived in Massachusetts.
91% of the 01748 zip code residents lived in the same house 1 year ago. Out of people who lived in different houses, 27% moved from this county. Out of people who lived in different houses, 37% moved from different county within same state. Out of people who lived in different houses, 24% moved from different state. Out of people who lived in different houses, 18% moved from abroad.
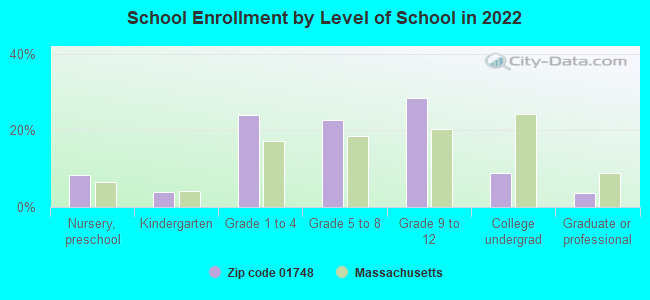
Private vs. public school enrollment:
Students in private schools in grades 1 to 8 (elementary and middle school): 154
Here:
6.3%
Massachusetts:
10.3%
Students in private schools in grades 9 to 12 (high school): 134
Here:
9.0%
Massachusetts:
12.3%
Students in private undergraduate colleges: 390
Here:
81.9%
Massachusetts:
51.2%
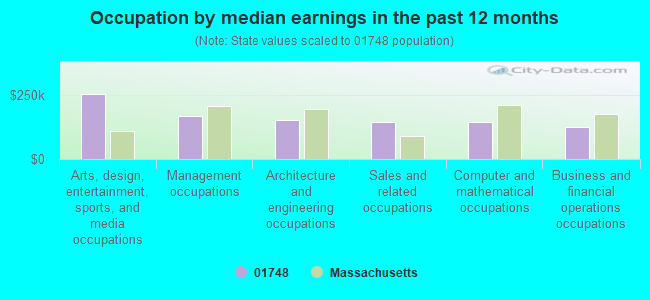
Occupation by median earnings in the past 12 months ($)
256,913Arts, design, entertainment, sports, and media occupations
167,513Management occupations
154,219Architecture and engineering occupations
146,634Sales and related occupations
144,383Computer and mathematical occupations
126,193Business and financial operations occupations
Companies with federal contracts located in this zip code (HOPKINTON, MA):
BARRY WRIGHT CORPORATION (82 SOUTH STREET; small business) 500 employees, $0 revenue. : $2,200,363 in 90 contractsfrom 1999 to 2006
Contracts for Gas Turbines and Jet Engines, Non-Aircraft; and Components, Miscellaneous Electrical and Electronic Components, Hardware, Weapon System, Bearings, Mounted, and moreby Defense Logistics Agency, Navy, National Oceanic and Atmospheric Administration/Under Secretary for Oceans and Atmosphere, Bureau of Prisoners/Federal Prison System, and others Signed by year:2000: $0; 2001: $85,428; 2002: $78,801; 2003: $534,356; 2004: $240,033; 2005: $957,812; 2006: $289,933.
Biggest contracts:
$320,299 with Defense Logistics Agency for Gas Turbines and Jet Engines, Non-Aircraft; and Components. Signed on 2005-12-01. Completion date: 2006-05-30.
$312,086, same as above.Signed on 2003-11-20. Completion date: 2004-06-07.
$156,043, same as above.Signed on 2006-01-01. Completion date: 2006-04-24.
$156,043, same as above.Signed on 2006-02-09. Completion date: 2006-08-30.
TEKCEL, INC (103 SOUTH ST; small business) : $404,830 in 2 contractsfrom 2004 to 2005
$206,200 with Army for Laboratory Equipment and Supplies. Signed on 2004-09-28. Completion date: 2004-09-30.
$198,630, same as above.Signed on 2005-09-26. Completion date: 2005-12-30.
SIERRA NETWORKS, INC SIERRAC (99 SOUTH STREET; small business) : $126,750 in 3 contractsin 2002
$126,750 with Defense Logistics Agency for Antennas, Waveguides, and Related Equipment. Signed on 2002-01-09. Completion date: 2002-06-08.
$82,184 with Army for Maintenance, Repair and Rebuilding of Equipment -- Miscellaneous. Signed on 2002-03-13. Completion date: 2002-06-06.
-$82,184, same as above.Signed on 2002-07-12. Completion date: 2002-06-06.
STRYKER SALES CORPORATION (35 SOUTH ST) : $117,698 in 22 contractsfrom 2002 to 2006
Contracts for Medical and Surgical Instruments, Equipment, and Supplies, Maintenance, Repair and Rebuilding of Equipment -- Medical, Dental, and Veterinary Equipment and Supplies, Hospital Furniture, Equipment, Utensils, and Supplies by Army, Department of Veterans Affairs Signed by year:2000: $0; 2001: $0; 2002: $5,200; 2003: $5,500; 2004: $51,620; 2005: $33,130; 2006: $22,248.
Biggest contracts:
$20,000 with Army for Medical and Surgical Instruments, Equipment, and Supplies. Signed on 2004-04-27. Completion date: 2004-04-15.
$19,133 with Department of Veterans Affairs for Maintenance, Repair and Rebuilding of Equipment -- Medical, Dental, and Veterinary Equipment and Supplies. Taking place in KY. Signed on 2006-01-01. Completion date: 2006-04-01.
$13,800 with Army for Medical and Surgical Instruments, Equipment, and Supplies. Signed on 2004-09-08. Completion date: 2004-09-07.
$12,050, same as above.Signed on 2005-05-20. Completion date: 2005-05-06.
STAAB, JEFFERY (3 PRICE ST; small business) : $39,517 in 4 contractsfrom 2003 to 2004
$24,936 with Army for Technical Assistance. Signed on 2003-08-25. Completion date: 2004-09-07.
$8,019, same as above.Signed on 2004-06-22. Completion date: 2004-12-31.
$6,014, same as above.Signed on 2004-08-27. Completion date: 2004-12-31.
$548, same as above.Signed on 2004-09-28. Completion date: 2004-12-31.
CBL SYSTEMS CORPORATION (25 SOUTH STREET; small business)
$33,211 with Navy for ADP Input/Output and Storage Devices. Signed on 2003-02-28. Completion date: 2003-04-27.
US PLASTIC PALLETS & HANDLING, (110 SOUTH STREET; small business) : $22,237 in 2 contractsin 2004
$17,037 with Army for Miscellaneous Materials Handling Equipment. Signed on 2004-09-27. Completion date: 2004-10-29.
$5,200 with Army for Cabinets, Lockers, Bins, and Shelving. Signed on 2004-09-22. Completion date: 2004-11-05.
CORRTECH INC (25 SOUTH ST) : $17,920 in 10 contractsfrom 2002 to 2005
Contracts for Maintenance, Repair and Rebuilding of Equipment -- Fuels, Lubricants, Oils, and Waxes, Maintenance, Repair or Alteration of Real Property -- Tunnels and Subsurface Structures, Inspection Services (including commercial testing and lab services, except medical/dental) -- Miscellaneous, Inspection Services (including commercial testing and lab services, except medical/dental) -- Plumbing, Heating, and Waste Disposal Equipment by Army Signed by year:2000: $0; 2001: $0; 2002: $2,300; 2003: $5,900; 2004: $7,200; 2005: $2,520; 2006: $0.
Biggest contracts:
$3,900 with Army for Maintenance, Repair and Rebuilding of Equipment -- Fuels, Lubricants, Oils, and Waxes. Taking place in NH. Signed on 2004-09-25. Completion date: 2004-10-29.
$3,000, same as above.Signed on 2004-09-30. Completion date: 2004-10-29.
$2,620 with Army for Maintenance, Repair or Alteration of Real Property -- Tunnels and Subsurface Structures. Signed on 2005-10-24. Completion date: 2006-11-30.
$2,400 with Army for Inspection Services (including commercial testing and lab services, except medical/dental) -- Miscellaneous. Signed on 2003-07-09. Completion date: 2004-07-31.
RYDER SYSTEM, INC (22 SOUTH STREET)
$12,220 with Army for Lease or Rental of Equipment -- Ground Effect Vehicles, Motor Vehicles, Trailers, and Cycles. Signed on 2002-12-16. Completion date: 2003-10-09.
Top industries in this zip code by the number of employees in 2005:
Management of Companies and Enterprises: Corporate, Subsidiary, and Regional Managing Offices (500-999 employees: 1 establishment)
Professional, Scientific, and Technical Services: Research and Development in the Physical, Engineering, and Life Sciences (100-249: 1, 20-49: 1, 5-9: 1, 1-4: 2)
Health Care and Social Assistance: Homes for the Elderly (100-249: 1)
Accommodation and Food Services: Full-Service Restaurants (20-49: 3, 10-19: 1)
Health Care and Social Assistance: Home Health Care Services (50-99: 1, 20-49: 1)
Administrative and Support and Waste Management and Remediation Services: Landscaping Services (50-99: 1, 5-9: 1, 1-4: 10)
Administrative and Support and Waste Management and Remediation Services: Janitorial Services (50-99: 1, 10-19: 1, 1-4: 2)
Health Care and Social Assistance: Child Day Care Services (20-49: 2, 10-19: 1, 5-9: 1)
People in group quarters in 2010:
66 people in nursing facilities/skilled-nursing facilities
28 people in residential treatment centers for adults
17 people in group homes for juveniles (non-correctional)
9 people in residential schools for people with disabilities
7 people in residential treatment centers for juveniles (non-correctional)
People in group quarters in 2000:
99 people in nursing homes
31 people in agriculture workers' dormitories on farms
23 people in homes or halfway houses for drug/alcohol abuse
Fatal accident statistics in 2014:
Fatal accident count: 1
Vehicles involved in fatal accidents: 1
Fatal accidents caused by drunken drivers: 0
Fatalities: 1
Persons involved in fatal accidents: 1
Pedestrians involved in fatal accidents: 0
Fatal accident statistics in 2013:
Fatal accident count: 3
Vehicles involved in fatal accidents: 3
Fatal accidents caused by drunken drivers: 0
Fatalities: 3
Persons involved in fatal accidents: 4
Pedestrians involved in fatal accidents: 1
Home Mortgage Disclosure Act Aggregated Statistics For Year 2009 (Based on 4 full tracts)
A) FHA, FSA/RHS & VA Home Purchase Loans
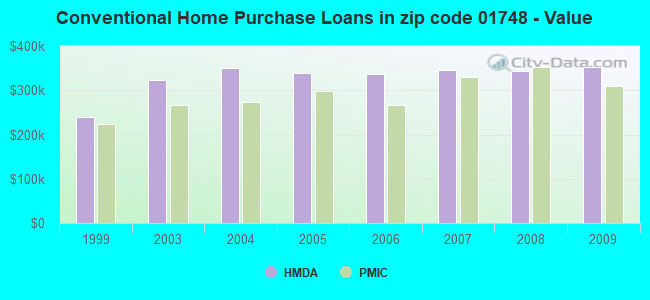
B) Conventional Home Purchase Loans
C) Refinancings
D) Home Improvement Loans
F) Non-occupant Loans on < 5 Family Dwellings (A B C & D)
Number
Average Value
Number
Average Value
Number
Average Value
Number
Average Value
Number
Average Value
LOANS ORIGINATED
76
$309,891
293
$353,510
1,673
$309,381
62
$224,575
16
$223,204
APPLICATIONS APPROVED, NOT ACCEPTED
0
$0
14
$301,437
86
$322,293
0
$0
0
$0
APPLICATIONS DENIED
6
$354,908
36
$337,464
216
$370,532
10
$217,865
6
$252,060
APPLICATIONS WITHDRAWN
4
$387,345
28
$335,606
202
$320,754
8
$176,218
12
$315,831
FILES CLOSED FOR INCOMPLETENESS
0
$0
2
$449,920
66
$341,787
4
$188,580
2
$59,855
Aggregated Statistics For Year 2008 (Based on 4 full tracts)
A) FHA, FSA/RHS & VA Home Purchase Loans
B) Conventional Home Purchase Loans
C) Refinancings
D) Home Improvement Loans
F) Non-occupant Loans on < 5 Family Dwellings (A B C & D)
Number
Average Value
Number
Average Value
Number
Average Value
Number
Average Value
Number
Average Value
LOANS ORIGINATED
18
$291,474
301
$344,082
613
$317,896
64
$127,728
32
$260,294
APPLICATIONS APPROVED, NOT ACCEPTED
2
$541,695
34
$452,192
74
$327,286
10
$70,234
2
$299,280
APPLICATIONS DENIED
4
$302,668
20
$259,995
128
$320,829
16
$60,875
4
$374,392
APPLICATIONS WITHDRAWN
2
$193,785
38
$322,741
108
$364,107
2
$124,700
10
$267,683
FILES CLOSED FOR INCOMPLETENESS
0
$0
12
$334,362
12
$357,707
4
$74,885
0
$0
Aggregated Statistics For Year 2007 (Based on 4 full tracts)
A) FHA, FSA/RHS & VA Home Purchase Loans
B) Conventional Home Purchase Loans
C) Refinancings
D) Home Improvement Loans
E) Loans on Dwellings For 5+ Families
F) Non-occupant Loans on < 5 Family Dwellings (A B C & D)
Number
Average Value
Number
Average Value
Number
Average Value
Number
Average Value
Number
Average Value
Number
Average Value
LOANS ORIGINATED
2
$304,270
543
$346,417
569
$284,854
100
$107,326
0
$0
38
$249,391
APPLICATIONS APPROVED, NOT ACCEPTED
0
$0
60
$395,686
68
$306,637
8
$58,875
2
$561,650
2
$191,790
APPLICATIONS DENIED
0
$0
44
$337,256
222
$424,934
16
$94,074
0
$0
12
$806,523
APPLICATIONS WITHDRAWN
0
$0
72
$330,844
114
$355,134
16
$114,584
0
$0
8
$99,261
FILES CLOSED FOR INCOMPLETENESS
0
$0
20
$428,608
40
$377,306
4
$228,248
0
$0
0
$0
Aggregated Statistics For Year 2006 (Based on 4 full tracts)
A) FHA, FSA/RHS & VA Home Purchase Loans
B) Conventional Home Purchase Loans
C) Refinancings
D) Home Improvement Loans
F) Non-occupant Loans on < 5 Family Dwellings (A B C & D)
Number
Average Value
Number
Average Value
Number
Average Value
Number
Average Value
Number
Average Value
LOANS ORIGINATED
6
$286,880
611
$337,474
651
$254,320
158
$117,421
56
$329,896
APPLICATIONS APPROVED, NOT ACCEPTED
0
$0
72
$332,199
88
$243,190
22
$96,375
6
$117,407
APPLICATIONS DENIED
0
$0
32
$438,701
242
$292,406
46
$98,703
0
$0
APPLICATIONS WITHDRAWN
0
$0
44
$300,358
160
$350,367
22
$140,930
6
$276,605
FILES CLOSED FOR INCOMPLETENESS
0
$0
14
$436,236
42
$288,575
4
$34,962
0
$0
Aggregated Statistics For Year 2005 (Based on 4 full tracts)
A) FHA, FSA/RHS & VA Home Purchase Loans
B) Conventional Home Purchase Loans
C) Refinancings
D) Home Improvement Loans
F) Non-occupant Loans on < 5 Family Dwellings (A B C & D)
Number
Average Value
Number
Average Value
Number
Average Value
Number
Average Value
Number
Average Value
LOANS ORIGINATED
0
$0
699
$338,984
900
$299,867
106
$183,702
78
$308,587
APPLICATIONS APPROVED, NOT ACCEPTED
0
$0
78
$356,590
94
$270,183
26
$184,997
8
$252,759
APPLICATIONS DENIED
2
$324,220
56
$330,608
208
$296,161
40
$198,998
12
$430,908
APPLICATIONS WITHDRAWN
0
$0
76
$346,050
232
$267,989
24
$219,726
6
$381,415
FILES CLOSED FOR INCOMPLETENESS
0
$0
22
$246,656
50
$330,635
0
$0
4
$387,840
Aggregated Statistics For Year 2004 (Based on 4 full tracts)
A) FHA, FSA/RHS & VA Home Purchase Loans
B) Conventional Home Purchase Loans
C) Refinancings
D) Home Improvement Loans
F) Non-occupant Loans on < 5 Family Dwellings (A B C & D)
G) Loans On Manufactured Home Dwelling (A B C & D)
Number
Average Value
Number
Average Value
Number
Average Value
Number
Average Value
Number
Average Value
Number
Average Value
LOANS ORIGINATED
0
$0
693
$350,557
1,140
$286,127
116
$161,989
48
$240,871
2
$92,775
APPLICATIONS APPROVED, NOT ACCEPTED
2
$292,295
46
$400,662
112
$284,232
22
$65,421
0
$0
0
$0
APPLICATIONS DENIED
0
$0
46
$305,516
200
$297,194
22
$77,772
6
$214,858
0
$0
APPLICATIONS WITHDRAWN
2
$285,315
80
$380,859
182
$324,733
6
$106,743
0
$0
2
$125,700
FILES CLOSED FOR INCOMPLETENESS
0
$0
14
$316,875
122
$348,632
8
$269,442
2
$386,070
0
$0
Aggregated Statistics For Year 2003 (Based on 4 full tracts)
A) FHA, FSA/RHS & VA Home Purchase Loans
B) Conventional Home Purchase Loans
C) Refinancings
D) Home Improvement Loans
F) Non-occupant Loans on < 5 Family Dwellings (A B C & D)
Number
Average Value
Number
Average Value
Number
Average Value
Number
Average Value
Number
Average Value
LOANS ORIGINATED
4
$212,635
491
$323,173
3,948
$258,052
40
$183,558
60
$210,247
APPLICATIONS APPROVED, NOT ACCEPTED
2
$275,340
54
$393,468
307
$250,781
24
$36,089
10
$256,982
APPLICATIONS DENIED
0
$0
48
$338,052
359
$260,793
34
$90,628
6
$162,628
APPLICATIONS WITHDRAWN
0
$0
48
$387,460
303
$248,245
12
$194,263
12
$340,505
FILES CLOSED FOR INCOMPLETENESS
0
$0
16
$363,874
48
$278,366
4
$36,910
0
$0
Aggregated Statistics For Year 1999 (Based on 1 full tract)
A) FHA, FSA/RHS & VA Home Purchase Loans
B) Conventional Home Purchase Loans
C) Refinancings
D) Home Improvement Loans
F) Non-occupant Loans on < 5 Family Dwellings (A B C & D)
Detailed PMIC statistics for the following Tracts:3201.01
, 3201.02
2002 - 2018 National Fire Incident Reporting System (NFIRS) incidents
According to the data from the years 2002 - 2018 the average number of fire incidents per year is 65. The highest number of fire incidents - 112 took place in 2005, and the least - 5 in 2003. The data has an increasing trend.
When looking into fire subcategories, the most reports belonged to: Structure Fires (51.5%), and Outside Fires (28.1%).
Fire incident types reported to NFIRS in Zip Code 01748


 Nearest zip codes: 01757, 01721, 01568, 01772, 01745, 01581.


 According to the data from the years 2002 - 2018 the average number of fire incidents per year is 65. The highest number of fire incidents - 112 took place in 2005, and the least - 5 in 2003. The data has an increasing trend.
 When looking into fire subcategories, the most reports belonged to: Structure Fires (51.5%), and Outside Fires (28.1%).