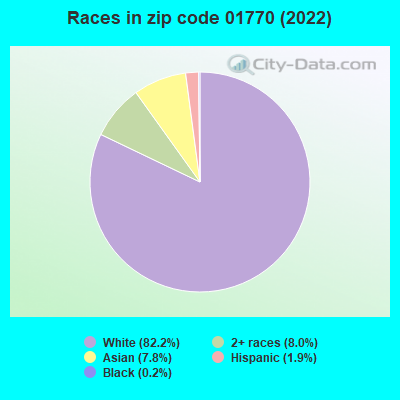
Estimated zip code population in 2022: 4,402 Zip code population in 2010: 4,119 Zip code population in 2000: 4,200
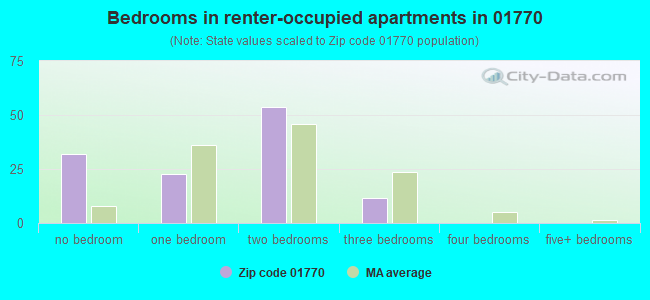
Houses and condos: 1,652 Renter-occupied apartments: 120
% of renters here:
8%
State:
38%
March 2022 cost of living index in zip code 01770: 117.7 (more than average, U.S. average is 100)
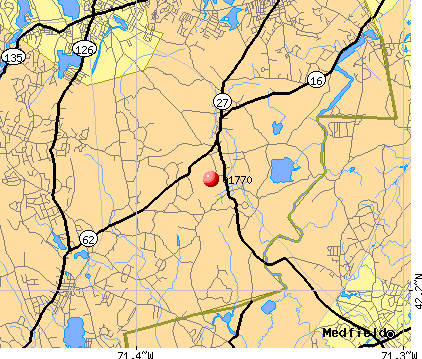
Land area: 15.8 sq. mi. Water area: 0.4 sq. mi.
Population density: 278 people per square mile
(very low).
OSM Map
Google Map
MSN Map
OSM Map
General Map
Google Map
MSN Map
OSM Map
Google Map
MSN Map
OSM Map
Google Map
MSN Map
Please wait while loading the map...
Real estate property taxes paid for housing units in 2022:
This zip code:
1.0% ($9,915)
Massachusetts:
1.0% ($5,536)
Median real estate property taxes paid for housing units with mortgages in 2022: $9,911 (1.0%) Median real estate property taxes paid for housing units with no mortgage in 2022: $9,925 (1.1%)
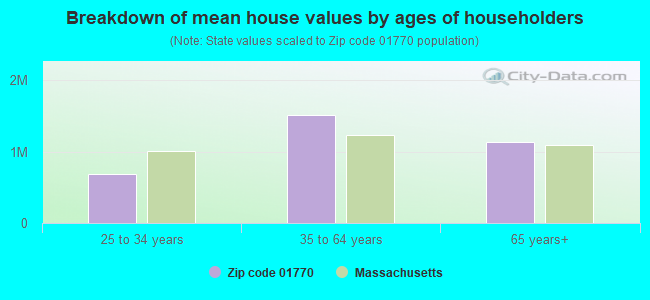
Estimated median house/condo value in 2022: $993,267
01770:
$993,267
Massachusetts:
$534,700
Median resident age:
This zip code:
44.9 years
Massachusetts median age:
40.3 years
Average household size:
This zip code:
2.9 people
Massachusetts:
2.4 people
Averages for the 2020 tax year for zip code 01770, filed in 2021:
Average Adjusted Gross Income (AGI) in 2020: $466,252 (Individual Income Tax Returns)
Here:
$466,252
State:
$105,130
Salary/wage: $237,358 (reported on 76.7% of returns)
Here:
$237,358
State:
$82,951
(% of AGI for various income ranges: 1086.2% for AGIs below $25k, 3590.0% for AGIs $25k-50k, 7972.5% for AGIs $50k-75k, 9430.0% for AGIs $75k-100k, 19654.7% for AGIs $100k-200k, 157536.7% for AGIs over 200k)
Taxable interest for individuals: $5,703 (reported on 66.7% of returns)
This zip code:
$5,703
Massachusetts:
$2,361
(% of AGI for various income ranges: 72.4% for AGIs below $25k, 132.0% for AGIs $25k-50k, 42.5% for AGIs $50k-75k, 223.3% for AGIs $75k-100k, 700.0% for AGIs $100k-200k, 3020.0% for AGIs over 200k)
Ordinary dividends: $26,444 (reported on 59.5% of returns)
Here:
$26,444
State:
$10,365
(% of AGI for various income ranges: 225.2% for AGIs below $25k, 472.0% for AGIs $25k-50k, 686.2% for AGIs $50k-75k, 1230.0% for AGIs $75k-100k, 1788.8% for AGIs $100k-200k, 13229.5% for AGIs over 200k)
Net capital gain/loss in AGI: +$96,643 (reported on 57.1% of returns)
Here:
+$96,643
State:
+$48,178
(% of AGI for various income ranges: 107.1% for AGIs below $25k, 291.0% for AGIs $25k-50k, 472.5% for AGIs $50k-75k, 943.3% for AGIs $75k-100k, 2028.8% for AGIs $100k-200k, 52887.1% for AGIs over 200k)
Profit/loss from business: +$44,192 (reported on 25.2% of returns)
Here:
+$44,192
State:
+$20,792
(% of AGI for various income ranges: 197.6% for AGIs below $25k, 745.0% for AGIs $25k-50k, 576.2% for AGIs $50k-75k, 1361.7% for AGIs $75k-100k, 1307.1% for AGIs $100k-200k, 8934.3% for AGIs over 200k)
Taxable individual retirement arrangement distribution: $36,787 (reported on 14.8% of returns)
01770:
$36,787
Massachusetts:
$22,790
(% of AGI for various income ranges: 87.1% for AGIs below $25k, 294.0% for AGIs $25k-50k, 547.5% for AGIs $50k-75k, 941.7% for AGIs $75k-100k, 1981.8% for AGIs $100k-200k, 3121.4% for AGIs over 200k)
Self-employed (Keogh) retirement plans: $33,318 (reported on 5.2% of returns)
01770:
$33,318
Massachusetts:
$26,868
(% of AGI for various income ranges: 1745.2% for AGIs over 200k)
Total itemized deductions: $99,468 (reported on 35.7% of returns)
Here:
$99,468
State:
$36,722
(% of AGI for various income ranges: 607.6% for AGIs below $25k, 992.5% for AGIs $50k-75k, 1736.7% for AGIs $75k-100k, 2984.7% for AGIs $100k-200k, 31626.2% for AGIs over 200k)
Charity contributions: $80,461 (reported on 30.5% of returns)
Here:
$80,461
State:
$12,529
(% of AGI for various income ranges: 18.1% for AGIs below $25k, 173.8% for AGIs $50k-75k, 319.4% for AGIs $100k-200k, 24178.6% for AGIs over 200k)
Taxes paid: $9,763 (reported on 36.2% of returns)
01770:
$9,763
State:
$8,782
(% of AGI for various income ranges: 173.3% for AGIs below $25k, 372.5% for AGIs $50k-75k, 435.0% for AGIs $75k-100k, 870.0% for AGIs $100k-200k, 2389.5% for AGIs over 200k)
Earned income credit: $720 (reported on 2.4% of returns)
Here:
$720
State:
$1,909
(% of AGI for various income ranges: 17.1% for AGIs below $25k)
Percentage of individuals using paid preparers for their 2020 taxes: 92.4%
Here:
92%
State:
92%
(% for various income ranges: 88.9% for AGIs below $25k, 94.4% for AGIs $25k-50k, 86.7% for AGIs $50k-75k, 92.3% for AGIs $75k-100k, 92.1% for AGIs $100k-200k, 95.1% for AGIs over 200k)
Averages for the 2012 tax year for zip code 01770, filed in 2013:
Average Adjusted Gross Income (AGI) in 2012: $363,504 (Individual Income Tax Returns)
Here:
$363,504
State:
$81,425
Salary/wage: $180,865 (reported on 76.4% of returns)
Here:
$180,865
State:
$64,752
(% of AGI for various income ranges: 65.5% for AGIs below $25k, 65.8% for AGIs $25k-50k, 40.2% for AGIs $50k-75k, 57.5% for AGIs $75k-100k, 62.1% for AGIs $100k-200k, 34.9% for AGIs over 200k)
Taxable interest for individuals: $11,727 (reported on 64.0% of returns)
This zip code:
$11,727
Massachusetts:
$2,136
(% of AGI for various income ranges: 4.2% for AGIs below $25k, 1.5% for AGIs $25k-50k, 2.8% for AGIs $50k-75k, 1.9% for AGIs $75k-100k, 1.6% for AGIs $100k-200k, 2.1% for AGIs over 200k)
Ordinary dividends: $27,026 (reported on 55.2% of returns)
Here:
$27,026
State:
$9,473
(% of AGI for various income ranges: 10.8% for AGIs below $25k, 3.9% for AGIs $25k-50k, 9.0% for AGIs $50k-75k, 6.1% for AGIs $75k-100k, 6.4% for AGIs $100k-200k, 3.7% for AGIs over 200k)
Net capital gain/loss in AGI: +$91,825 (reported on 54.2% of returns)
Here:
+$91,825
State:
+$31,437
(% of AGI for various income ranges: 2.7% for AGIs $25k-50k, 2.4% for AGIs $50k-75k, 2.6% for AGIs $75k-100k, 3.9% for AGIs $100k-200k, 15.2% for AGIs over 200k)
Profit/loss from business: +$49,006 (reported on 24.1% of returns)
Here:
+$49,006
State:
+$20,662
(% of AGI for various income ranges: 11.9% for AGIs below $25k, 10.8% for AGIs $25k-50k, 9.6% for AGIs $50k-75k, 8.8% for AGIs $75k-100k, 9.4% for AGIs $100k-200k, 2.3% for AGIs over 200k)
Taxable individual retirement arrangement distribution: $37,416 (reported on 18.2% of returns)
01770:
$37,416
Massachusetts:
$18,892
(% of AGI for various income ranges: 5.5% for AGIs below $25k, 5.3% for AGIs $25k-50k, 8.2% for AGIs $50k-75k, 6.6% for AGIs $75k-100k, 4.9% for AGIs $100k-200k, 1.4% for AGIs over 200k)
Self-employment retirement plans: $26,346 (reported on 6.4% of returns)
01770:
$26,346
Massachusetts:
$20,669
(% of AGI for various income ranges: 1.3% for AGIs $100k-200k, 0.4% for AGIs over 200k)
Total itemized deductions: $77,142 (15% of AGI, reported on 70.0% of returns)
Here:
$77,142
State:
$28,907
Here:
15.2% of AGI
State:
18.2% of AGI
(% of AGI for various income ranges: 47.6% for AGIs below $25k, 30.6% for AGIs $25k-50k, 30.8% for AGIs $50k-75k, 27.5% for AGIs $75k-100k, 23.8% for AGIs $100k-200k, 13.1% for AGIs over 200k)
Charity contributions: $10,474 (reported on 61.6% of returns)
Here:
$10,474
State:
$4,208
(% of AGI for various income ranges: 1.2% for AGIs below $25k, 2.2% for AGIs $25k-50k, 2.1% for AGIs $50k-75k, 2.1% for AGIs $75k-100k, 1.7% for AGIs $100k-200k, 1.8% for AGIs over 200k)
Taxes paid: $44,676 (reported on 69.0% of returns)
01770:
$44,676
State:
$13,303
(% of AGI for various income ranges: 13.8% for AGIs below $25k, 9.8% for AGIs $25k-50k, 13.8% for AGIs $50k-75k, 13.8% for AGIs $75k-100k, 12.7% for AGIs $100k-200k, 7.9% for AGIs over 200k)
Earned income credit: $1,200 (reported on 2.5% of returns)
Here:
$1,200
State:
$1,971
(% of AGI for various income ranges: 1.4% for AGIs below $25k)
Percentage of individuals using paid preparers for their 2012 taxes: 65.5%
Here:
66%
State:
56%
(% for various income ranges: 58.0% for AGIs below $25k, 68.2% for AGIs $25k-50k, 62.5% for AGIs $50k-75k, 61.5% for AGIs $75k-100k, 62.5% for AGIs $100k-200k, 74.2% for AGIs over 200k)
Averages for the 2004 tax year for zip code 01770, filed in 2005:
Average Adjusted Gross Income (AGI) in 2004: $226,605 (Individual Income Tax Returns)
Here:
$226,605
State:
$62,877
Salary/wage: $160,340 (reported on 74.4% of returns)
Here:
$160,340
State:
$52,969
(% of AGI for various income ranges: 55.6% for AGIs $10k-25k, 57.9% for AGIs $25k-50k, 50.0% for AGIs $50k-75k, 62.7% for AGIs $75k-100k, 51.1% for AGIs over 100k)
Taxable interest for individuals: $5,752 (reported on 78.3% of returns)
This zip code:
$5,752
Massachusetts:
$1,945
(% of AGI for various income ranges: 4.7% for AGIs $10k-25k, 4.0% for AGIs $25k-50k, 5.7% for AGIs $50k-75k, 2.7% for AGIs $75k-100k, 1.7% for AGIs over 100k)
Taxable dividends: $13,813 (reported on 69.5% of returns)
Here:
$13,813
State:
$5,323
(% of AGI for various income ranges: 9.9% for AGIs $10k-25k, 8.8% for AGIs $25k-50k, 7.9% for AGIs $50k-75k, 4.9% for AGIs $75k-100k, 3.9% for AGIs over 100k)
Net capital gain/loss: +$43,997 (reported on 62.3% of returns)
Here:
+$43,997
State:
+$20,377
(% of AGI for various income ranges: 6.1% for AGIs $10k-25k, 3.4% for AGIs $25k-50k, 3.7% for AGIs $50k-75k, 3.2% for AGIs $75k-100k, 12.6% for AGIs over 100k)
Profit/loss from business: +$37,355 (reported on 23.4% of returns)
Here:
+$37,355
State:
+$17,837
(% of AGI for various income ranges: 10.1% for AGIs $10k-25k, 10.4% for AGIs $25k-50k, 7.7% for AGIs $50k-75k, 10.7% for AGIs $75k-100k, 3.4% for AGIs over 100k)
IRA payment deduction: $3,712 (reported on 3.6% of returns)
01770:
$3,712
Massachusetts:
$3,100
Self-employed pension: $20,856 (reported on 6.5% of returns)
Here:
$20,856
Massachusetts:
$14,516
Total itemized deductions: $48,330 (14% of AGI, reported on 65.0% of returns)
Here:
$48,330
State:
$22,573
Here:
14.0% of AGI
State:
19.5% of AGI
(% of AGI for various income ranges: 29.2% for AGIs $10k-25k, 29.0% for AGIs $25k-50k, 30.3% for AGIs $50k-75k, 28.9% for AGIs $75k-100k, 12.4% for AGIs over 100k)
Charity contributions deductions: $9,647 (3% of AGI, reported on 60.4% of returns)
Here:
$9,647
State:
$3,295
Here:
2.6% of AGI
State:
2.7% of AGI
(% of AGI for various income ranges: 1.7% for AGIs $10k-25k, 2.6% for AGIs $25k-50k, 2.6% for AGIs $50k-75k, 2.2% for AGIs $75k-100k, 2.5% for AGIs over 100k)
Total tax: $60,469 (reported on 82.8% of returns)
01770:
$60,469
State:
$11,494
(% of AGI for various income ranges: 5.7% for AGIs $10k-25k, 8.3% for AGIs $25k-50k, 9.1% for AGIs $50k-75k, 10.0% for AGIs $75k-100k, 22.7% for AGIs over 100k)
Earned income credit: $1,091 (reported on 1.6% of returns)
Here:
$1,091
State:
$1,518
Percentage of individuals using paid preparers for their 2004 taxes: 66.6%
Here:
67%
State:
58%
(% for various income ranges: 63.5% for AGIs below $10k, 56.4% for AGIs $10k-25k, 58.5% for AGIs $25k-50k, 70.2% for AGIs $50k-75k, 61.2% for AGIs $75k-100k, 71.8% for AGIs over 100k)
Household received Food Stamps/SNAP in the past 12 months: 30 Household did not receive Food Stamps/SNAP in the past 12 months: 1,473
Women who had a birth in the past 12 months: 67 (70 now married, 0 unmarried) Women who did not have a birth in the past 12 months: 813 (487 now married, 313 unmarried)
Housing units in zip code 01770 with a mortgage: 981 (207 second mortgage, 176 both second mortgage and home equity loan) Houses without a mortgage: 17
Median monthly owner costs for units with a mortgage: $3,900 Median monthly owner costs for units without a mortgage: $1,507
Residents with income below the poverty level in 2022:
This zip code:
2.4%
Whole state:
10.4%
Residents with income below 50% of the poverty level in 2022:
This zip code:
2.4%
Whole state:
5.1%
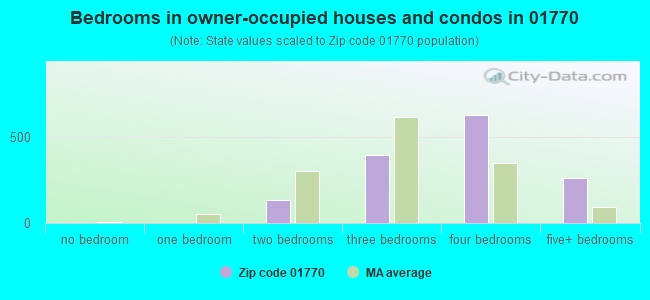
Median number of rooms in houses and condos:
Here:
10.0
State:
6.5
Median number of rooms in apartments:
Here:
3.6
State:
4.0
Notable locations in this zip code not listed on our city pages
Notable locations in zip code 01770: Dowse Orchards (A), Sherborn Fire Department (B), Sherborn Library (C), Sherborn Town Hall (D). Display/hide their locations on the map
Cemeteries: Brush Hill Burying Ground (1), Clara Barton Burying Ground (2), Plain Burying Ground (3), Central Burying Ground (4), Old South Burying Ground (5), Sherborn Reformatory for Women-Annex Cemetery (6), West Burying Ground (7). Display/hide their locations on the map
Parks in zip code 01770 include: Sherborn Center Historic District (1), Rocky Narrows Reservation (2), Edwards Plain-Dowses Corner Historic District (3). Display/hide their locations on the map
Size of family households: 512 2-persons, 132 3-persons, 475 4-persons, 100 5-persons, 25 6-persons
Size of nonfamily households: 241 1-person, 33 2-persons
1,227 married couples with children.
9 single-parent households (9 women).
84.2% of residents of 01770 zip code speak English at home.
1.4% of residents speak Spanish at home (100% very well).
8.8% of residents speak other Indo-European language at home (100% very well).
4.5% of residents speak Asian or Pacific Island language at home (78% very well, 22% well).
Foreign born population: 478 (10.9%) (49.3% of them are naturalized citizens)
This zip code:
10.9%
Whole state:
18.0%
19%Sweden
15%Bolivia
11%Bhutan
6%Syria
5%Germany
4%China, excluding Hong Kong and Taiwan
3%Kuwait
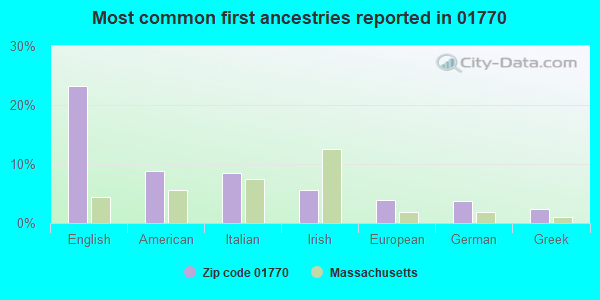
23%English
9%American
9%Italian
6%Irish
4%European
4%German
2%Greek
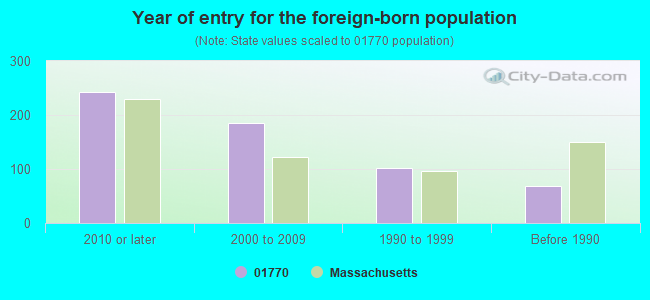
Year of entry for the foreign-born population
2422010 or later
1862000 to 2009
1011990 to 1999
69Before 1990
Facilities with environmental interests located in this zip code:
ALGONQUIN GAS TRANSMISSION CO (MASON HILL RD in SHERBORN, MA)
Small Quantity Generators, between 100 kg and 1000 kg of hazardous waste/month (Resource Conservation and Recovery Act (tracking hazardous waste)) - notification Organizations: ALGONQUIN GAS TRANSMISSION CO VALVE 42 (CONTACT/OPERATOR)
, ALGONQUIN GAS TRANSMISSION COMPANY (CONTACT/OWNER)
Alternative names: ALGONQUIN GAS TRANSMISSION CO VALVE 42
LIFE EXPERIENCE SCHOOL (2 NORTH MAIN STREET in SHERBORN, MA)
COMPLIANCE ACTIVITY (Tracking inspections of insecticide, fungicide, and rodenticide, and toxic substances)
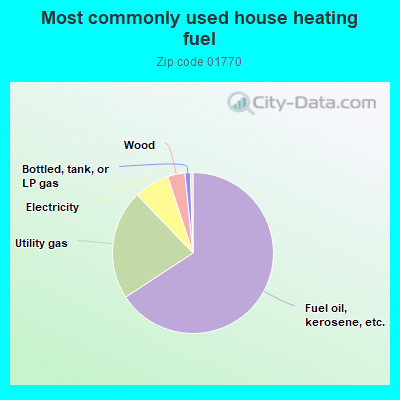
65.9%Fuel oil, kerosene, etc.
22.1%Utility gas
7.1%Electricity
3.5%Wood
1.1%Bottled, tank, or LP gas
Population in 1990: 3,998. Population change in the 1990s: +202 (+5.1%).
Place of birth for U.S.-born residents:
This state: 2,035
Northeast: 976
Midwest: 234
South: 325
West: 254
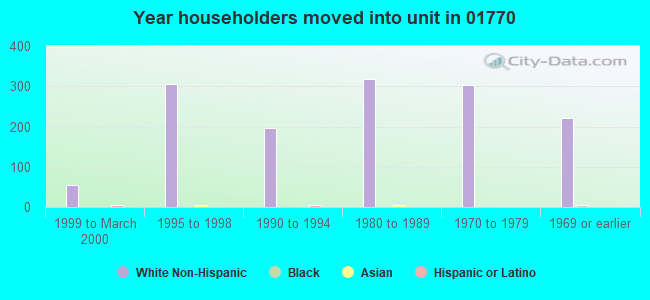
70% of the 01770 zip code residents lived in the same house 5 years ago. Out of people who lived in different houses, 49% lived in this county. Out of people who lived in different counties, 50% lived in Massachusetts.
95% of the 01770 zip code residents lived in the same house 1 year ago. Out of people who lived in different houses, 34% moved from this county. Out of people who lived in different houses, 44% moved from different county within same state. Out of people who lived in different houses, 25% moved from different state.
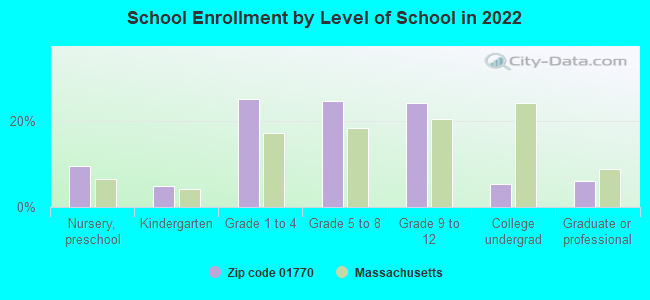
Private vs. public school enrollment:
Students in private schools in grades 1 to 8 (elementary and middle school): 70
Here:
11.6%
Massachusetts:
10.3%
Students in private schools in grades 9 to 12 (high school): 9
Here:
3.1%
Massachusetts:
12.3%
Students in private undergraduate colleges: 41
Here:
64.8%
Massachusetts:
51.2%
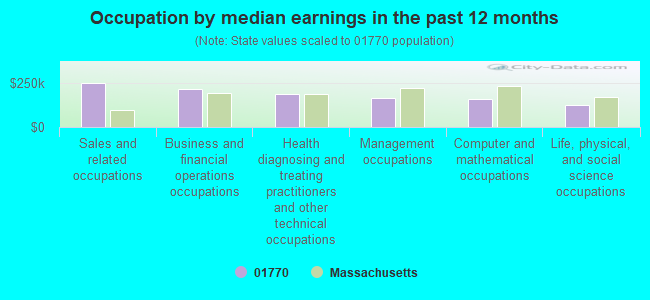
Occupation by median earnings in the past 12 months ($)
248,008Sales and related occupations
213,094Business and financial operations occupations
186,620Health diagnosing and treating practitioners and other technical occupations
161,001Management occupations
159,148Computer and mathematical occupations
122,002Life, physical, and social science occupations
Companies with federal contracts located in this zip code:
PURINS MD, ERIK P (9 PLEASANT ST in SHERBORN, MA; small business)
$21,065 with Army for Other Professional Services. Signed on 2006-06-26. Completion date: 2007-07-09.
KELSEY PICKARD (17 CIDER HILL LN in SHERBORN, MA; small business) : $15,876 in 5 contractsfrom 2003 to 2005
Contracts for Personal Services Contracts by Army Signed by year:2000: $0; 2001: $0; 2002: $0; 2003: $7,245; 2004: $4,916; 2005: $3,715; 2006: $0.
Biggest contracts:
$7,245 with Army for Personal Services Contracts. Signed on 2003-04-04. Completion date: 2003-12-31.
$4,916, same as above.Signed on 2004-05-14. Completion date: 2005-05-16.
$4,900, same as above.Signed on 2005-12-07. Completion date: 2006-09-30.
$0, same as above.Signed on 2005-11-01. Completion date: 2005-05-16.
Top industries in this zip code by the number of employees in 2005:
Professional, Scientific, and Technical Services: Human Resources and Executive Search Consulting Services (50-99 employees: 1 establishment, 1-4 employees: 3 establishments)
Finance and Insurance: Direct Health and Medical Insurance Carriers (50-99: 1)
Accommodation and Food Services: Full-Service Restaurants (50-99: 1)
Arts, Entertainment, and Recreation: Fitness and Recreational Sports Centers (20-49: 1)
Health Care and Social Assistance: Child Day Care Services (10-19: 1, 5-9: 2)
Accommodation and Food Services: Limited-Service Restaurants (10-19: 1, 5-9: 2)
Other Services (except Public Administration): Religious Organizations (5-9: 3)
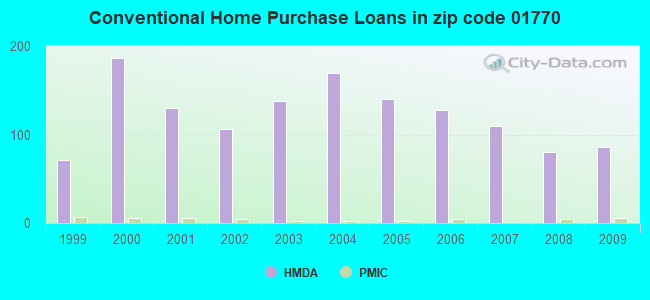
Detailed PMIC statistics for the following Tracts:3861.00
2002 - 2018 National Fire Incident Reporting System (NFIRS) incidents
According to the data from the years 2002 - 2018 the average number of fire incidents per year is 23. The highest number of fire incidents - 41 took place in 2012, and the least - 9 in 2016. The data has a decreasing trend.
When looking into fire subcategories, the most reports belonged to: Outside Fires (56.7%), and Structure Fires (32.5%).
Fire incident types reported to NFIRS in Zip Code 01770


 Nearest zip codes: 01760, 02054, 01702, 02052, 02030, 01746.


 According to the data from the years 2002 - 2018 the average number of fire incidents per year is 23. The highest number of fire incidents - 41 took place in 2012, and the least - 9 in 2016. The data has a decreasing trend.
 When looking into fire subcategories, the most reports belonged to: Outside Fires (56.7%), and Structure Fires (32.5%).