Estimated zip code population in 2022: 2,326 Zip code population in 2010: 2,401 Zip code population in 2000: 2,376
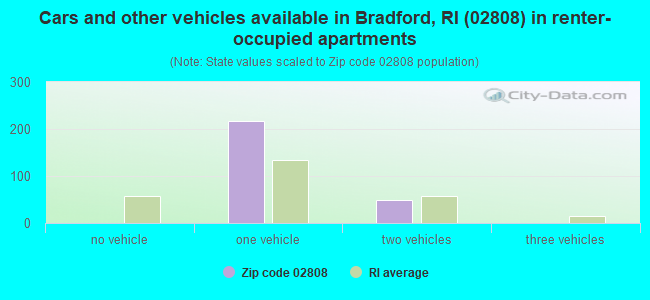
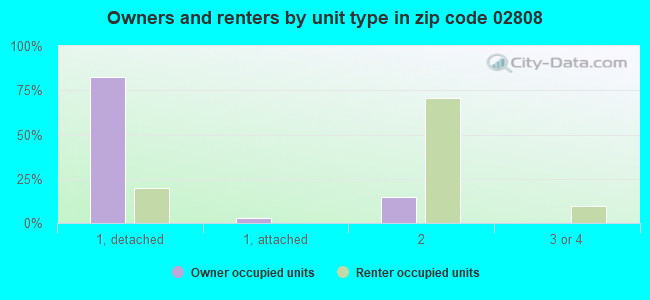
Houses and condos: 999 Renter-occupied apartments: 270
% of renters here:
30%
State:
37%
March 2022 cost of living index in zip code 02808: 87.5 (less than average, U.S. average is 100)
Land area: 8.0 sq. mi. Water area: 0.0 sq. mi.
Population density: 292 people per square mile
(very low).
OSM Map
Google Map
MSN Map
OSM Map
General Map
Google Map
MSN Map
OSM Map
Google Map
MSN Map
OSM Map
Google Map
MSN Map
Please wait while loading the map...
Real estate property taxes paid for housing units in 2022:
This zip code:
1.0% ($3,123)
Rhode Island:
1.2% ($4,726)
Median real estate property taxes paid for housing units with mortgages in 2022: $3,229 (1.0%) Median real estate property taxes paid for housing units with no mortgage in 2022: $2,847 (0.8%)
Business Search- 14 Million verified businesses
Males: 1,200
(51.6%)
Females: 1,125
(48.4%)
For population 25 years and over in 02808:
High school or higher: 93.2%
Bachelor's degree or higher: 32.9%
Graduate or professional degree: 12.1%
Unemployed: 12.4%
Mean travel time to work (commute): 25.2 minutes
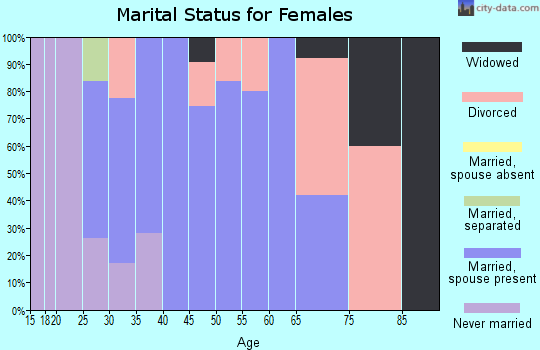
For population 15 years and over in 02808:
Never married: 38.5%
Now married: 45.3%
Separated: 2.0%
Widowed: 0.6%
Divorced: 13.6%
Zip code 02808 compared to state average:
Unemployed percentage above state average.
Black race population percentage significantly below state average.
Hispanic race population percentage significantly below state average.
Foreign-born population percentage significantly below state average.
Length of stay since moving in significantly above state average.
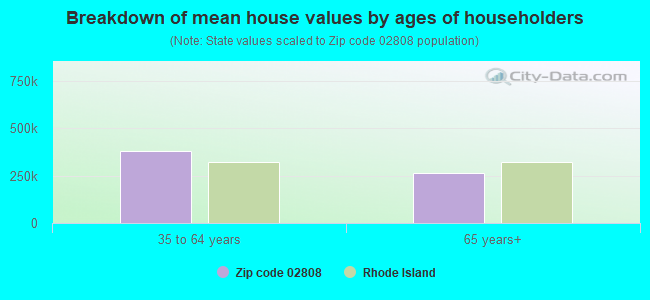
Estimated median house/condo value in 2022: $312,961
02808:
$312,961
Rhode Island:
$383,900
Median resident age:
This zip code:
42.0 years
Rhode Island median age:
40.7 years
Average household size:
This zip code:
2.5 people
Rhode Island:
2.4 people
Averages for the 2020 tax year for zip code 02808, filed in 2021:
Average Adjusted Gross Income (AGI) in 2020: $57,465 (Individual Income Tax Returns)
Here:
$57,465
State:
$74,300
Salary/wage: $52,706 (reported on 83.9% of returns)
Here:
$52,706
State:
$60,330
(% of AGI for various income ranges: 1070.7% for AGIs below $25k, 3201.3% for AGIs $25k-50k, 6334.4% for AGIs $50k-75k, 11050.0% for AGIs $75k-100k, 17106.4% for AGIs $100k-200k)
Taxable interest for individuals: $652 (reported on 23.4% of returns)
This zip code:
$652
Rhode Island:
$1,971
(% of AGI for various income ranges: 18.1% for AGIs below $25k, 5.4% for AGIs $25k-50k, 30.6% for AGIs $50k-75k, 20.0% for AGIs $75k-100k, 54.5% for AGIs $100k-200k)
Ordinary dividends: $1,629 (reported on 13.7% of returns)
Here:
$1,629
State:
$7,621
(% of AGI for various income ranges: 31.9% for AGIs below $25k, 28.7% for AGIs $50k-75k, 15.6% for AGIs $75k-100k, 119.1% for AGIs $100k-200k)
Net capital gain/loss in AGI: +$7,621 (reported on 11.3% of returns)
Here:
+$7,621
State:
+$26,041
(% of AGI for various income ranges: 4.1% for AGIs below $25k, 72.5% for AGIs $50k-75k, 854.5% for AGIs $100k-200k)
Profit/loss from business: +$13,184 (reported on 15.3% of returns)
Here:
+$13,184
State:
+$15,775
(% of AGI for various income ranges: 104.1% for AGIs below $25k, 260.4% for AGIs $25k-50k, 331.2% for AGIs $50k-75k, 477.8% for AGIs $75k-100k, 580.9% for AGIs $100k-200k)
Taxable individual retirement arrangement distribution: $9,178 (reported on 7.3% of returns)
02808:
$9,178
Rhode Island:
$18,801
(% of AGI for various income ranges: 54.4% for AGIs below $25k, 142.9% for AGIs $25k-50k, 373.3% for AGIs $75k-100k)
Total itemized deductions: $20,940 (reported on 8.1% of returns)
Here:
$20,940
State:
$29,550
(% of AGI for various income ranges: 499.4% for AGIs $50k-75k, 467.8% for AGIs $75k-100k, 794.5% for AGIs $100k-200k)
Charity contributions: $2,071 (reported on 5.6% of returns)
Here:
$2,071
State:
$7,826
(% of AGI for various income ranges: 32.5% for AGIs $50k-75k, 84.5% for AGIs $100k-200k)
Taxes paid: $7,670 (reported on 8.1% of returns)
02808:
$7,670
State:
$8,398
(% of AGI for various income ranges: 161.9% for AGIs $50k-75k, 177.8% for AGIs $75k-100k, 316.4% for AGIs $100k-200k)
Earned income credit: $1,894 (reported on 13.7% of returns)
Here:
$1,894
State:
$2,059
(% of AGI for various income ranges: 68.5% for AGIs below $25k, 57.1% for AGIs $25k-50k)
Percentage of individuals using paid preparers for their 2020 taxes: 95.2%
Here:
95%
State:
94%
(% for various income ranges: 94.9% for AGIs below $25k, 96.6% for AGIs $25k-50k, 95.5% for AGIs $50k-75k, 92.9% for AGIs $75k-100k, 100.0% for AGIs $100k-200k, 66.7% for AGIs over 200k)
Averages for the 2012 tax year for zip code 02808, filed in 2013:
Average Adjusted Gross Income (AGI) in 2012: $46,977 (Individual Income Tax Returns)
Here:
$46,977
State:
$60,628
Salary/wage: $42,698 (reported on 89.2% of returns)
Here:
$42,698
State:
$50,029
(% of AGI for various income ranges: 75.1% for AGIs below $25k, 80.7% for AGIs $25k-50k, 78.4% for AGIs $50k-75k, 85.7% for AGIs $75k-100k, 82.4% for AGIs $100k-200k)
Taxable interest for individuals: $442 (reported on 32.4% of returns)
This zip code:
$442
Rhode Island:
$1,640
(% of AGI for various income ranges: 0.8% for AGIs below $25k, 0.5% for AGIs $25k-50k, 0.3% for AGIs $50k-75k, 0.1% for AGIs $75k-100k, 0.2% for AGIs $100k-200k)
Ordinary dividends: $1,106 (reported on 16.2% of returns)
Here:
$1,106
State:
$6,396
(% of AGI for various income ranges: 0.4% for AGIs below $25k, 0.4% for AGIs $25k-50k, 0.3% for AGIs $50k-75k, 0.3% for AGIs $75k-100k, 0.5% for AGIs $100k-200k)
Net capital gain/loss in AGI: +$282 (reported on 9.9% of returns)
Here:
+$282
State:
+$15,680
(% of AGI for various income ranges: 0.2% for AGIs $50k-75k, 0.2% for AGIs $100k-200k)
Profit/loss from business: +$10,494 (reported on 14.4% of returns)
Here:
+$10,494
State:
+$15,678
(% of AGI for various income ranges: 6.8% for AGIs below $25k, 4.0% for AGIs $25k-50k, 3.1% for AGIs $50k-75k, 6.8% for AGIs $75k-100k)
Taxable individual retirement arrangement distribution: $11,378 (reported on 8.1% of returns)
02808:
$11,378
Rhode Island:
$14,081
(% of AGI for various income ranges: 2.9% for AGIs below $25k, 3.4% for AGIs $25k-50k, 6.0% for AGIs $75k-100k)
Total itemized deductions: $18,470 (24% of AGI, reported on 36.0% of returns)
Here:
$18,470
State:
$24,445
Here:
23.8% of AGI
State:
20.5% of AGI
(% of AGI for various income ranges: 8.8% for AGIs below $25k, 11.4% for AGIs $25k-50k, 15.3% for AGIs $50k-75k, 16.9% for AGIs $75k-100k, 15.4% for AGIs $100k-200k)
Charity contributions: $1,365 (reported on 27.9% of returns)
Here:
$1,365
State:
$2,961
(% of AGI for various income ranges: 0.6% for AGIs $25k-50k, 1.1% for AGIs $50k-75k, 1.3% for AGIs $75k-100k, 0.8% for AGIs $100k-200k)
Taxes paid: $7,450 (reported on 36.0% of returns)
02808:
$7,450
State:
$11,235
(% of AGI for various income ranges: 2.2% for AGIs below $25k, 3.5% for AGIs $25k-50k, 5.6% for AGIs $50k-75k, 7.2% for AGIs $75k-100k, 7.4% for AGIs $100k-200k)
Earned income credit: $2,170 (reported on 18.0% of returns)
Here:
$2,170
State:
$2,170
(% of AGI for various income ranges: 5.9% for AGIs below $25k, 1.1% for AGIs $25k-50k)
Percentage of individuals using paid preparers for their 2012 taxes: 47.7%
Here:
48%
State:
60%
(% for various income ranges: 39.5% for AGIs below $25k, 44.8% for AGIs $25k-50k, 56.2% for AGIs $50k-75k, 60.0% for AGIs $75k-100k, 61.5% for AGIs $100k-200k)
Averages for the 2004 tax year for zip code 02808, filed in 2005:
Average Adjusted Gross Income (AGI) in 2004: $39,310 (Individual Income Tax Returns)
Here:
$39,310
State:
$51,090
Salary/wage: $36,459 (reported on 88.6% of returns)
Here:
$36,459
State:
$43,690
(% of AGI for various income ranges: 83.1% for AGIs below $10k, 79.9% for AGIs $10k-25k, 87.9% for AGIs $25k-50k, 86.4% for AGIs $50k-75k, 82.1% for AGIs $75k-100k, 68.4% for AGIs over 100k)
Taxable interest for individuals: $545 (reported on 45.6% of returns)
This zip code:
$545
Rhode Island:
$1,567
(% of AGI for various income ranges: 2.6% for AGIs below $10k, 1.6% for AGIs $10k-25k, 0.6% for AGIs $25k-50k, 0.4% for AGIs $50k-75k, 0.5% for AGIs $75k-100k, 0.3% for AGIs over 100k)
Taxable dividends: $1,019 (reported on 19.3% of returns)
Here:
$1,019
State:
$3,896
(% of AGI for various income ranges: 1.6% for AGIs below $10k, 0.6% for AGIs $10k-25k, 0.1% for AGIs $25k-50k, 0.3% for AGIs $50k-75k, 0.6% for AGIs $75k-100k, 1.0% for AGIs over 100k)
Net capital gain/loss: +$4,760 (reported on 11.5% of returns)
Here:
+$4,760
State:
+$15,829
(% of AGI for various income ranges: -2.0% for AGIs below $10k, -0.2% for AGIs $10k-25k, 0.2% for AGIs $25k-50k, -0.2% for AGIs $50k-75k, 1.9% for AGIs $75k-100k, 6.7% for AGIs over 100k)
Profit/loss from business: +$14,757 (reported on 12.2% of returns)
Here:
+$14,757
State:
+$15,557
(% of AGI for various income ranges: 7.1% for AGIs below $10k, 5.3% for AGIs $10k-25k, 4.2% for AGIs $25k-50k, 4.1% for AGIs $50k-75k, 3.1% for AGIs $75k-100k, 6.9% for AGIs over 100k)
IRA payment deduction: $2,652 (reported on 2.1% of returns)
02808:
$2,652
Rhode Island:
$3,092
Total itemized deductions: $15,721 (24% of AGI, reported on 33.4% of returns)
Here:
$15,721
State:
$20,228
Here:
24.3% of AGI
State:
21.1% of AGI
(% of AGI for various income ranges: 13.9% for AGIs below $10k, 8.4% for AGIs $10k-25k, 10.6% for AGIs $25k-50k, 15.0% for AGIs $50k-75k, 15.2% for AGIs $75k-100k, 15.5% for AGIs over 100k)
Charity contributions deductions: $1,478 (2% of AGI, reported on 27.9% of returns)
Here:
$1,478
State:
$2,620
Here:
2.2% of AGI
State:
2.6% of AGI
(% of AGI for various income ranges: 0.6% for AGIs $10k-25k, 0.6% for AGIs $25k-50k, 1.4% for AGIs $50k-75k, 1.3% for AGIs $75k-100k, 1.4% for AGIs over 100k)
Total tax: $4,565 (reported on 76.1% of returns)
02808:
$4,565
State:
$8,437
(% of AGI for various income ranges: 2.0% for AGIs below $10k, 4.8% for AGIs $10k-25k, 6.9% for AGIs $25k-50k, 8.3% for AGIs $50k-75k, 10.3% for AGIs $75k-100k, 14.3% for AGIs over 100k)
Earned income credit: $1,564 (reported on 14.0% of returns)
Here:
$1,564
State:
$1,659
Percentage of individuals using paid preparers for their 2004 taxes: 51.3%
Here:
51%
State:
63%
(% for various income ranges: 42.4% for AGIs below $10k, 52.1% for AGIs $10k-25k, 51.8% for AGIs $25k-50k, 51.6% for AGIs $50k-75k, 65.8% for AGIs $75k-100k, 47.1% for AGIs over 100k)
Household received Food Stamps/SNAP in the past 12 months: 157 Household did not receive Food Stamps/SNAP in the past 12 months: 754
Women who did not have a birth in the past 12 months: 616 (223 now married, 392 unmarried)
Housing units in zip code 02808 with a mortgage: 458 (126 second mortgage, 131 both second mortgage and home equity loan) Median monthly owner costs for units with a mortgage: $1,821 Median monthly owner costs for units without a mortgage: $532
Residents with income below the poverty level in 2022:
This zip code:
8.6%
Whole state:
10.8%
Residents with income below 50% of the poverty level in 2022:
This zip code:
2.5%
Whole state:
5.6%
Median number of rooms in houses and condos:
Here:
5.6
State:
6.2
Median number of rooms in apartments:
Here:
4.5
State:
4.1
Notable locations in this zip code not listed on our city pages
Cemeteries: Gardiner-Green Lot (1), George Babcock Lot (2), Hall-Geer Lot (3), Joseph Burdick Lot (4), Noyes-Wells Lot (5), Nathaniel Cook Lot (6), Babcock Family Lot (7). Display/hide their locations on the map
Size of family households: 221 2-persons, 144 3-persons, 163 4-persons, 39 5-persons
Size of nonfamily households: 210 1-person, 56 2-persons, 63 4-persons
135 married couples with children.
167 single-parent households (110 men, 57 women).
99.8% of residents of 02808 zip code speak English at home.
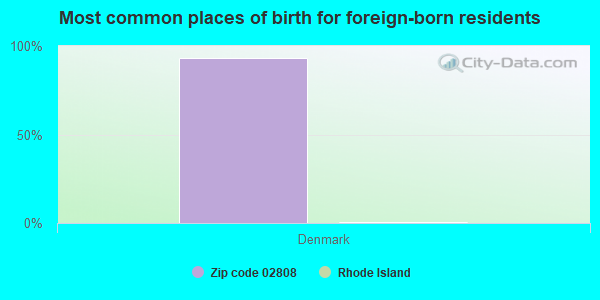
Foreign born population: 16 (0.7%) (0.0% of them are naturalized citizens)
:
0.7%
Whole state:
14.4%
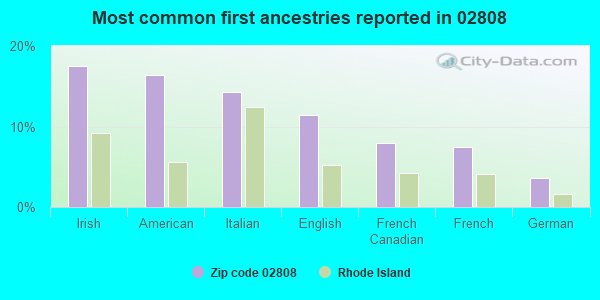
93%Denmark
18%Irish
16%American
14%Italian
11%English
8%French Canadian
7%French
4%German
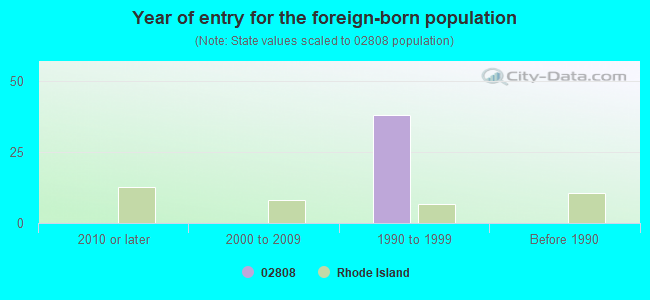
Year of entry for the foreign-born population
02010 or later
02000 to 2009
381990 to 1999
0Before 1990
Facilities with environmental interests located in this zip code:
BRADFORD DYEING ASSOCIATION (460 BRADFORD ROAD in WESTERLY, RI)
AIR MAJOR (AIRS/AFS) (Integrated Compliance Information System) - ICIS-01-1977-0005, FORMAL ENFORCEMENT ACTION CRITERIA AND HAZARDOUS AIR POLLUTANT INVENTORY (Inventory of air pollution sources) National Pollutant Discharge Elimination System MAJOR (Tracking pollutant discharge elimination systems) - permit - ICIS-, ENFORCEMENT/COMPLIANCE ACTIVITY Small Quantity Generators, between 100 kg and 1000 kg of hazardous waste/month (Resource Conservation and Recovery Act (tracking hazardous waste)) - notification TRI REPORTER (Tracking of toxic chemicals releasing facilities) Business SIC classification: FINISHERS OF BROADWOVEN FABRICS OF COTTON; FINISHERS OF BROADWOVEN FABRICS OF MANMADE FIBER AND SILK; FINISHERS OF TEXTILES; TEXTILE GOODS; AUTOMOTIVE TRIMMINGS, APPAREL FINDINGS, AND RELATED PRODUCTS; INDUSTRIAL ORGANIC CHEMICALS Business NAICS classification: BROADWOVEN FABRIC FINISHING MILLS.; BROADWOVEN FABRIC FINISHING MILLS. Organizations: BRADFORD DYEING ASSOC. INC. (CONTACT/OPERATOR)
, BRADFORD DYEING ASSOCIATION INC (CONTACT/OPERATOR)
BRADFORD SCHOOL (CHURCH STREET in BRADFORD, RI)
(Geographic Names Information System) (National Center for Education Statistics) - STATE ID-36101 Organizations: WESTERLY SCH DIST (SCHOOL DISTRICT)
BRADFORD MOTORS (1 RIVERSIDE DR in WESTERLY, RI)
(Resource Conservation and Recovery Act (tracking hazardous waste)) Organizations: RICK SHAWN (CONTACT/OWNER)
BRIANS SERVICE CTR (135 WESTERLY BRADFORD RD in WESTERLY, RI)
(Resource Conservation and Recovery Act (tracking hazardous waste)) Organizations: BRIAN DEVOE (CONTACT/OWNER)
BURDICK & SON GARY F (144-B ASHAWAY RD in WESTERLY, RI)
Small Quantity Generators, between 100 kg and 1000 kg of hazardous waste/month (Resource Conservation and Recovery Act (tracking hazardous waste)) - notification Organizations: GARY F BURDICK (CONTACT/OWNER)
EURO CAR SERVICE (442 MAIN ST in WESTERLY, RI)
Small Quantity Generators, between 100 kg and 1000 kg of hazardous waste/month (Resource Conservation and Recovery Act (tracking hazardous waste)) - notification Business NAICS classification: GENERAL AUTOMOTIVE REPAIR. Organizations: GIORGIO CELICO (CONTACT/OWNER)
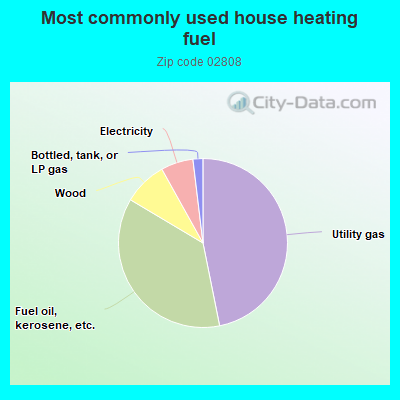
47.0%Utility gas
36.8%Fuel oil, kerosene, etc.
8.4%Wood
6.2%Electricity
1.9%Bottled, tank, or LP gas
Population in 1990: 2,184. Population change in the 1990s: +192 (+8.8%).
Place of birth for U.S.-born residents:
This state: 1,537
Northeast: 620
South: 72
West: 34
56% of the 02808 zip code residents lived in the same house 5 years ago. Out of people who lived in different houses, 77% lived in this county. Out of people who lived in different counties, 50% lived in Rhode Island.
97% of the 02808 zip code residents lived in the same house 1 year ago. Out of people who lived in different houses, 53% moved from this county. Out of people who lived in different houses, 63% moved from different state.
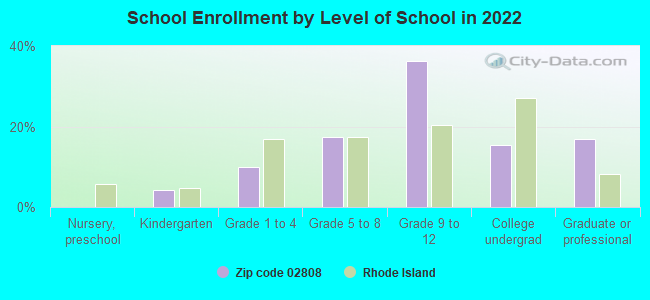
Private vs. public school enrollment:
Students in private schools in grades 1 to 8 (elementary and middle school):
Here:
0.0%
Rhode Island:
12.2%
Students in private schools in grades 9 to 12 (high school): 49
Here:
20.8%
Rhode Island:
11.6%
Students in private undergraduate colleges: 15
Here:
14.5%
Rhode Island:
41.1%
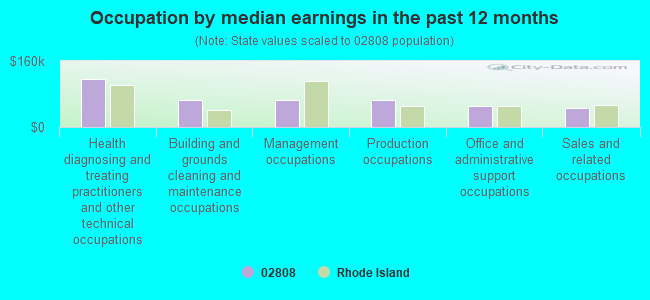
Occupation by median earnings in the past 12 months ($)
116,285Health diagnosing and treating practitioners and other technical occupations
65,693Building and grounds cleaning and maintenance occupations
65,074Management occupations
64,318Production occupations
50,315Office and administrative support occupations
45,618Sales and related occupations
Companies with federal contracts located in this zip code:
BRADFORD DYEING ASSN INC (460 BRADFORD RD in BRADFORD, RI; small business) : $728,633 in 29 contractsfrom 2001 to 2006
Contracts for Textile Fabrics, Other Research and Development -- Advanced Development (R&D) by Army, Department of Defense Signed by year:2000: $0; 2001: $36,750; 2002: $6,797; 2003: $12,150; 2004: $529,950; 2005: $81,739; 2006: $61,247.
Biggest contracts:
$221,738 with Army for Textile Fabrics. Signed on 2004-07-20. Completion date: 2004-09-02.
$105,400, same as above.Signed on 2004-09-15. Completion date: 2004-08-02.
$75,875, same as above.Signed on 2004-08-10. Completion date: 2004-08-17.
$70,286, same as above.Signed on 2005-02-10. Completion date: 2005-02-10.
Top industries in this zip code by the number of employees in 2005:
Accommodation and Food Services: Snack and Nonalcoholic Beverage Bars (20-49 employees: 1 establishment)
Professional, Scientific, and Technical Services: Other Accounting Services (10-19: 1)
Other Services (except Public Administration): Civic and Social Organizations (5-9: 1, 1-4: 1)
Construction: Plumbing, Heating, and Air-Conditioning Contractors (5-9: 1)
Construction: Residential Remodelers (5-9: 1)
Other Services (except Public Administration): Religious Organizations (1-4: 2)
Other Services (except Public Administration): General Automotive Repair (1-4: 1)
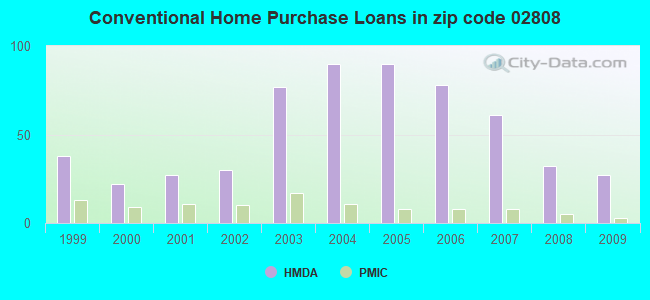
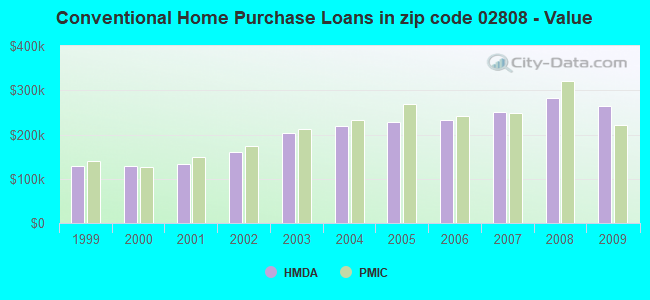
Home Mortgage Disclosure Act Aggregated Statistics For Year 2009 (Based on 4 partial tracts)
A) FHA, FSA/RHS & VA Home Purchase Loans
B) Conventional Home Purchase Loans
C) Refinancings
D) Home Improvement Loans
F) Non-occupant Loans on < 5 Family Dwellings (A B C & D)
G) Loans On Manufactured Home Dwelling (A B C & D)
Number
Average Value
Number
Average Value
Number
Average Value
Number
Average Value
Number
Average Value
Number
Average Value
LOANS ORIGINATED
14
$245,623
27
$264,563
192
$212,478
12
$84,902
27
$234,537
1
$43,120
APPLICATIONS APPROVED, NOT ACCEPTED
0
$0
1
$476,580
11
$236,714
1
$59,730
2
$319,640
0
$0
APPLICATIONS DENIED
3
$155,233
4
$129,530
54
$256,300
5
$154,160
7
$225,310
1
$56,800
APPLICATIONS WITHDRAWN
2
$258,830
1
$137,710
35
$277,183
2
$146,010
4
$240,552
0
$0
FILES CLOSED FOR INCOMPLETENESS
0
$0
1
$174,760
3
$208,733
1
$18,900
0
$0
0
$0
Aggregated Statistics For Year 2008 (Based on 4 partial tracts)
A) FHA, FSA/RHS & VA Home Purchase Loans
B) Conventional Home Purchase Loans
C) Refinancings
D) Home Improvement Loans
F) Non-occupant Loans on < 5 Family Dwellings (A B C & D)
G) Loans On Manufactured Home Dwelling (A B C & D)
Number
Average Value
Number
Average Value
Number
Average Value
Number
Average Value
Number
Average Value
Number
Average Value
LOANS ORIGINATED
7
$251,629
32
$281,716
93
$213,186
19
$53,207
17
$289,416
0
$0
APPLICATIONS APPROVED, NOT ACCEPTED
1
$203,600
1
$149,970
9
$217,751
4
$46,498
0
$0
0
$0
APPLICATIONS DENIED
3
$243,460
5
$244,424
44
$244,414
7
$37,104
3
$564,403
1
$137,610
APPLICATIONS WITHDRAWN
2
$188,445
4
$198,492
19
$232,124
1
$21,000
2
$241,915
0
$0
FILES CLOSED FOR INCOMPLETENESS
1
$237,560
0
$0
7
$296,637
1
$64,830
1
$458,530
0
$0
Aggregated Statistics For Year 2007 (Based on 4 partial tracts)
A) FHA, FSA/RHS & VA Home Purchase Loans
B) Conventional Home Purchase Loans
C) Refinancings
D) Home Improvement Loans
F) Non-occupant Loans on < 5 Family Dwellings (A B C & D)
G) Loans On Manufactured Home Dwelling (A B C & D)
Number
Average Value
Number
Average Value
Number
Average Value
Number
Average Value
Number
Average Value
Number
Average Value
LOANS ORIGINATED
2
$271,920
61
$250,442
131
$206,869
39
$69,573
23
$245,978
1
$55,180
APPLICATIONS APPROVED, NOT ACCEPTED
0
$0
7
$245,699
18
$223,216
3
$98,317
3
$367,517
0
$0
APPLICATIONS DENIED
0
$0
9
$340,594
75
$250,390
19
$119,836
5
$242,550
1
$137,170
APPLICATIONS WITHDRAWN
0
$0
6
$210,365
45
$200,998
3
$85,013
3
$276,940
0
$0
FILES CLOSED FOR INCOMPLETENESS
0
$0
2
$263,660
9
$250,139
1
$70,280
0
$0
0
$0
Aggregated Statistics For Year 2006 (Based on 4 partial tracts)
A) FHA, FSA/RHS & VA Home Purchase Loans
B) Conventional Home Purchase Loans
C) Refinancings
D) Home Improvement Loans
F) Non-occupant Loans on < 5 Family Dwellings (A B C & D)
G) Loans On Manufactured Home Dwelling (A B C & D)
Number
Average Value
Number
Average Value
Number
Average Value
Number
Average Value
Number
Average Value
Number
Average Value
LOANS ORIGINATED
1
$175,150
78
$231,718
176
$204,091
54
$63,403
23
$227,465
2
$40,125
APPLICATIONS APPROVED, NOT ACCEPTED
0
$0
12
$369,152
28
$199,914
4
$53,938
2
$609,210
0
$0
APPLICATIONS DENIED
0
$0
22
$173,005
87
$227,367
19
$68,486
7
$121,164
2
$147,000
APPLICATIONS WITHDRAWN
0
$0
12
$204,866
64
$191,752
3
$153,703
2
$164,265
0
$0
FILES CLOSED FOR INCOMPLETENESS
0
$0
0
$0
17
$257,798
1
$206,490
0
$0
0
$0
Aggregated Statistics For Year 2005 (Based on 4 partial tracts)
A) FHA, FSA/RHS & VA Home Purchase Loans
B) Conventional Home Purchase Loans
C) Refinancings
D) Home Improvement Loans
F) Non-occupant Loans on < 5 Family Dwellings (A B C & D)
G) Loans On Manufactured Home Dwelling (A B C & D)
Number
Average Value
Number
Average Value
Number
Average Value
Number
Average Value
Number
Average Value
Number
Average Value
LOANS ORIGINATED
3
$280,047
90
$227,765
206
$189,205
51
$72,586
28
$232,552
0
$0
APPLICATIONS APPROVED, NOT ACCEPTED
0
$0
5
$230,562
26
$183,858
3
$107,873
1
$383,650
0
$0
APPLICATIONS DENIED
0
$0
20
$189,237
71
$190,112
21
$94,608
3
$169,693
0
$0
APPLICATIONS WITHDRAWN
0
$0
11
$170,878
101
$204,644
10
$160,470
4
$174,062
1
$52,500
FILES CLOSED FOR INCOMPLETENESS
0
$0
5
$162,426
26
$273,973
1
$206,240
0
$0
0
$0
Aggregated Statistics For Year 2004 (Based on 4 partial tracts)
A) FHA, FSA/RHS & VA Home Purchase Loans
B) Conventional Home Purchase Loans
C) Refinancings
D) Home Improvement Loans
F) Non-occupant Loans on < 5 Family Dwellings (A B C & D)
G) Loans On Manufactured Home Dwelling (A B C & D)
Number
Average Value
Number
Average Value
Number
Average Value
Number
Average Value
Number
Average Value
Number
Average Value
LOANS ORIGINATED
2
$226,920
90
$218,355
234
$173,568
42
$67,159
26
$208,890
1
$63,310
APPLICATIONS APPROVED, NOT ACCEPTED
0
$0
7
$211,540
30
$170,570
6
$76,812
3
$252,403
0
$0
APPLICATIONS DENIED
1
$136,050
17
$185,429
79
$175,606
19
$88,376
6
$147,955
0
$0
APPLICATIONS WITHDRAWN
0
$0
15
$172,972
109
$167,357
6
$88,427
4
$170,958
0
$0
FILES CLOSED FOR INCOMPLETENESS
0
$0
2
$148,785
31
$199,587
4
$82,485
1
$242,180
0
$0
Aggregated Statistics For Year 2003 (Based on 4 partial tracts)
A) FHA, FSA/RHS & VA Home Purchase Loans
B) Conventional Home Purchase Loans
C) Refinancings
D) Home Improvement Loans
F) Non-occupant Loans on < 5 Family Dwellings (A B C & D)
Number
Average Value
Number
Average Value
Number
Average Value
Number
Average Value
Number
Average Value
LOANS ORIGINATED
4
$192,815
77
$202,500
438
$152,592
41
$90,033
28
$180,811
APPLICATIONS APPROVED, NOT ACCEPTED
0
$0
7
$202,720
56
$139,733
6
$60,357
4
$135,955
APPLICATIONS DENIED
1
$86,460
12
$186,622
106
$145,904
14
$56,684
3
$176,317
APPLICATIONS WITHDRAWN
0
$0
10
$154,813
118
$143,737
5
$117,738
4
$173,938
FILES CLOSED FOR INCOMPLETENESS
0
$0
1
$286,790
11
$133,406
1
$85,600
1
$227,140
Aggregated Statistics For Year 2002 (Based on 2 partial tracts)
A) FHA, FSA/RHS & VA Home Purchase Loans
B) Conventional Home Purchase Loans
C) Refinancings
D) Home Improvement Loans
F) Non-occupant Loans on < 5 Family Dwellings (A B C & D)
Number
Average Value
Number
Average Value
Number
Average Value
Number
Average Value
Number
Average Value
LOANS ORIGINATED
3
$153,327
30
$160,662
96
$124,871
10
$47,942
5
$102,094
APPLICATIONS APPROVED, NOT ACCEPTED
0
$0
3
$146,177
15
$111,075
3
$27,850
0
$0
APPLICATIONS DENIED
0
$0
4
$146,270
21
$119,806
4
$34,850
1
$38,420
APPLICATIONS WITHDRAWN
0
$0
2
$155,040
20
$124,501
3
$24,947
1
$97,630
FILES CLOSED FOR INCOMPLETENESS
0
$0
0
$0
4
$152,248
0
$0
0
$0
Aggregated Statistics For Year 2001 (Based on 2 partial tracts)
A) FHA, FSA/RHS & VA Home Purchase Loans
B) Conventional Home Purchase Loans
C) Refinancings
D) Home Improvement Loans
F) Non-occupant Loans on < 5 Family Dwellings (A B C & D)
Number
Average Value
Number
Average Value
Number
Average Value
Number
Average Value
Number
Average Value
LOANS ORIGINATED
3
$158,240
27
$132,484
72
$114,570
11
$28,615
4
$90,532
APPLICATIONS APPROVED, NOT ACCEPTED
0
$0
4
$101,590
8
$102,150
3
$21,893
1
$60,320
APPLICATIONS DENIED
0
$0
3
$109,317
27
$89,815
7
$30,861
1
$38,650
APPLICATIONS WITHDRAWN
1
$82,880
2
$130,240
18
$113,872
4
$20,888
0
$0
FILES CLOSED FOR INCOMPLETENESS
0
$0
0
$0
2
$80,090
0
$0
0
$0
Aggregated Statistics For Year 2000 (Based on 2 partial tracts)
A) FHA, FSA/RHS & VA Home Purchase Loans
B) Conventional Home Purchase Loans
C) Refinancings
D) Home Improvement Loans
F) Non-occupant Loans on < 5 Family Dwellings (A B C & D)
Number
Average Value
Number
Average Value
Number
Average Value
Number
Average Value
Number
Average Value
LOANS ORIGINATED
4
$118,402
22
$129,308
18
$89,186
14
$29,808
3
$68,957
APPLICATIONS APPROVED, NOT ACCEPTED
0
$0
2
$149,230
4
$73,778
2
$32,280
1
$97,630
APPLICATIONS DENIED
0
$0
5
$123,406
20
$62,284
8
$31,025
2
$82,660
APPLICATIONS WITHDRAWN
2
$78,750
2
$135,490
14
$82,466
2
$22,005
1
$65,900
FILES CLOSED FOR INCOMPLETENESS
0
$0
1
$143,420
2
$79,975
0
$0
0
$0
Aggregated Statistics For Year 1999 (Based on 2 partial tracts)
A) FHA, FSA/RHS & VA Home Purchase Loans
B) Conventional Home Purchase Loans
C) Refinancings
D) Home Improvement Loans
F) Non-occupant Loans on < 5 Family Dwellings (A B C & D)


 Nearest zip codes: 02804, 02894, 02891, 02833, 02813, 02832.