Estimated zip code population in 2022: 5,176 Zip code population in 2010: 4,731 Zip code population in 2000: 3,585
Houses and condos: 2,198 Renter-occupied apartments: 201
% of renters here:
10%
State:
28%
March 2022 cost of living index in zip code 03290: 112.6 (more than average, U.S. average is 100)
Land area: 45.8 sq. mi. Water area: 1.8 sq. mi.
Population density: 113 people per square mile
(very low).
OSM Map
Google Map
MSN Map
OSM Map
General Map
Google Map
MSN Map
OSM Map
Google Map
MSN Map
OSM Map
Google Map
MSN Map
Please wait while loading the map...
Real estate property taxes paid for housing units in 2022:
This zip code:
1.5% ($6,414)
New Hampshire:
1.6% ($6,209)
Median real estate property taxes paid for housing units with mortgages in 2022: $6,364 (1.4%) Median real estate property taxes paid for housing units with no mortgage in 2022: $6,544 (1.6%)
Estimated median house/condo value in 2022: $429,892
03290:
$429,892
New Hampshire:
$384,700
According to our research of New Hampshire and other state lists, there were 8 registered sex offenders living in 03290 zip code as of June 16, 2024. The ratio of all residents to sex offenders in zip code 03290 is 612 to 1. The ratio of registered sex offenders to all residents in this zip code is near the state average.
Median resident age:
This zip code:
42.4 years
New Hampshire median age:
43.3 years
Average household size:
This zip code:
2.5 people
New Hampshire:
2.4 people
Averages for the 2020 tax year for zip code 03290, filed in 2021:
Average Adjusted Gross Income (AGI) in 2020: $100,016 (Individual Income Tax Returns)
Here:
$100,016
State:
$88,845
Salary/wage: $81,604 (reported on 83.8% of returns)
Here:
$81,604
State:
$71,693
(% of AGI for various income ranges: 1026.2% for AGIs below $25k, 3656.2% for AGIs $25k-50k, 6503.6% for AGIs $50k-75k, 8591.6% for AGIs $75k-100k, 18704.5% for AGIs $100k-200k, 70957.1% for AGIs over 200k)
Taxable interest for individuals: $1,001 (reported on 42.1% of returns)
This zip code:
$1,001
New Hampshire:
$1,640
(% of AGI for various income ranges: 18.8% for AGIs below $25k, 50.9% for AGIs $25k-50k, 33.6% for AGIs $50k-75k, 50.8% for AGIs $75k-100k, 98.3% for AGIs $100k-200k, 364.3% for AGIs over 200k)
Ordinary dividends: $5,642 (reported on 26.7% of returns)
Here:
$5,642
State:
$8,258
(% of AGI for various income ranges: 42.4% for AGIs below $25k, 46.2% for AGIs $25k-50k, 70.4% for AGIs $50k-75k, 182.0% for AGIs $75k-100k, 254.3% for AGIs $100k-200k, 2830.0% for AGIs over 200k)
Net capital gain/loss in AGI: +$21,824 (reported on 23.3% of returns)
Here:
+$21,824
State:
+$28,952
(% of AGI for various income ranges: 21.2% for AGIs below $25k, 61.6% for AGIs $25k-50k, 149.2% for AGIs $50k-75k, 123.2% for AGIs $75k-100k, 576.9% for AGIs $100k-200k, 14487.1% for AGIs over 200k)
Profit/loss from business: +$26,860 (reported on 16.9% of returns)
Here:
+$26,860
State:
+$24,424
(% of AGI for various income ranges: 114.8% for AGIs below $25k, 165.3% for AGIs $25k-50k, 563.6% for AGIs $50k-75k, 526.8% for AGIs $75k-100k, 896.4% for AGIs $100k-200k, 6550.0% for AGIs over 200k)
Taxable individual retirement arrangement distribution: $18,421 (reported on 10.5% of returns)
03290:
$18,421
New Hampshire:
$21,952
(% of AGI for various income ranges: 109.0% for AGIs below $25k, 168.1% for AGIs $25k-50k, 241.2% for AGIs $50k-75k, 368.4% for AGIs $75k-100k, 412.4% for AGIs $100k-200k, 1294.3% for AGIs over 200k)
Self-employed (Keogh) retirement plans: $19,533 (reported on 1.1% of returns)
03290:
$19,533
New Hampshire:
$24,779
(% of AGI for various income ranges: 139.5% for AGIs $100k-200k)
Total itemized deductions: $26,724 (reported on 9.4% of returns)
Here:
$26,724
State:
$32,702
(% of AGI for various income ranges: 169.0% for AGIs below $25k, 396.0% for AGIs $50k-75k, 423.2% for AGIs $75k-100k, 555.0% for AGIs $100k-200k, 2274.3% for AGIs over 200k)
Charity contributions: $4,488 (reported on 6.0% of returns)
Here:
$4,488
State:
$9,866
(% of AGI for various income ranges: 18.8% for AGIs $25k-50k, 20.4% for AGIs $75k-100k, 84.8% for AGIs $100k-200k, 358.6% for AGIs over 200k)
Taxes paid: $8,264 (reported on 9.4% of returns)
03290:
$8,264
State:
$8,247
(% of AGI for various income ranges: 42.6% for AGIs below $25k, 115.6% for AGIs $50k-75k, 154.4% for AGIs $75k-100k, 169.0% for AGIs $100k-200k, 717.1% for AGIs over 200k)
Earned income credit: $1,644 (reported on 6.0% of returns)
Here:
$1,644
State:
$1,831
(% of AGI for various income ranges: 43.8% for AGIs below $25k, 24.7% for AGIs $25k-50k)
Percentage of individuals using paid preparers for their 2020 taxes: 91.4%
Here:
91%
State:
92%
(% for various income ranges: 88.1% for AGIs below $25k, 91.1% for AGIs $25k-50k, 88.9% for AGIs $50k-75k, 91.2% for AGIs $75k-100k, 94.4% for AGIs $100k-200k, 95.2% for AGIs over 200k)
Averages for the 2012 tax year for zip code 03290, filed in 2013:
Average Adjusted Gross Income (AGI) in 2012: $76,658 (Individual Income Tax Returns)
Here:
$76,658
State:
$66,185
Salary/wage: $61,702 (reported on 87.9% of returns)
Here:
$61,702
State:
$55,674
(% of AGI for various income ranges: 71.4% for AGIs below $25k, 78.8% for AGIs $25k-50k, 81.3% for AGIs $50k-75k, 79.4% for AGIs $75k-100k, 87.2% for AGIs $100k-200k, 31.8% for AGIs over 200k)
Taxable interest for individuals: $1,067 (reported on 37.7% of returns)
This zip code:
$1,067
New Hampshire:
$1,674
(% of AGI for various income ranges: 1.3% for AGIs below $25k, 0.7% for AGIs $25k-50k, 0.2% for AGIs $50k-75k, 0.6% for AGIs $75k-100k, 0.5% for AGIs $100k-200k, 0.4% for AGIs over 200k)
Ordinary dividends: $2,924 (reported on 23.8% of returns)
Here:
$2,924
State:
$6,774
(% of AGI for various income ranges: 1.2% for AGIs below $25k, 1.2% for AGIs $25k-50k, 0.7% for AGIs $50k-75k, 1.2% for AGIs $75k-100k, 0.7% for AGIs $100k-200k, 0.9% for AGIs over 200k)
Net capital gain/loss in AGI: +$5,308 (reported on 17.3% of returns)
Here:
+$5,308
State:
+$13,759
(% of AGI for various income ranges: 0.3% for AGIs $75k-100k, 0.5% for AGIs $100k-200k, 4.2% for AGIs over 200k)
Profit/loss from business: +$20,874 (reported on 16.9% of returns)
Here:
+$20,874
State:
+$19,298
(% of AGI for various income ranges: 13.3% for AGIs below $25k, 6.5% for AGIs $25k-50k, 5.6% for AGIs $50k-75k, 3.9% for AGIs $75k-100k, 6.1% for AGIs $100k-200k)
Taxable individual retirement arrangement distribution: $13,933 (reported on 9.1% of returns)
03290:
$13,933
New Hampshire:
$16,908
(% of AGI for various income ranges: 2.9% for AGIs below $25k, 2.2% for AGIs $25k-50k, 2.2% for AGIs $50k-75k, 2.0% for AGIs $75k-100k, 2.1% for AGIs $100k-200k)
Total itemized deductions: $20,471 (17% of AGI, reported on 44.6% of returns)
Here:
$20,471
State:
$22,617
Here:
16.8% of AGI
State:
18.1% of AGI
(% of AGI for various income ranges: 14.3% for AGIs below $25k, 11.8% for AGIs $25k-50k, 14.1% for AGIs $50k-75k, 14.3% for AGIs $75k-100k, 13.4% for AGIs $100k-200k, 6.5% for AGIs over 200k)
Charity contributions: $1,818 (reported on 32.9% of returns)
Here:
$1,818
State:
$2,860
(% of AGI for various income ranges: 0.4% for AGIs below $25k, 0.6% for AGIs $25k-50k, 0.7% for AGIs $50k-75k, 0.8% for AGIs $75k-100k, 1.0% for AGIs $100k-200k, 0.6% for AGIs over 200k)
Taxes paid: $7,305 (reported on 44.6% of returns)
03290:
$7,305
State:
$8,830
(% of AGI for various income ranges: 4.4% for AGIs below $25k, 4.3% for AGIs $25k-50k, 5.2% for AGIs $50k-75k, 5.2% for AGIs $75k-100k, 4.9% for AGIs $100k-200k, 2.0% for AGIs over 200k)
Earned income credit: $1,543 (reported on 9.1% of returns)
Here:
$1,543
State:
$1,863
(% of AGI for various income ranges: 3.0% for AGIs below $25k, 0.6% for AGIs $25k-50k)
Percentage of individuals using paid preparers for their 2012 taxes: 42.0%
Here:
42%
State:
45%
(% for various income ranges: 35.8% for AGIs below $25k, 41.5% for AGIs $25k-50k, 45.9% for AGIs $50k-75k, 41.2% for AGIs $75k-100k, 43.5% for AGIs $100k-200k, 83.3% for AGIs over 200k)
Averages for the 2004 tax year for zip code 03290, filed in 2005:
Average Adjusted Gross Income (AGI) in 2004: $56,010 (Individual Income Tax Returns)
Here:
$56,010
State:
$54,348
Salary/wage: $50,800 (reported on 90.4% of returns)
Here:
$50,800
State:
$46,966
(% of AGI for various income ranges: 117.8% for AGIs below $10k, 73.4% for AGIs $10k-25k, 82.2% for AGIs $25k-50k, 85.7% for AGIs $50k-75k, 89.2% for AGIs $75k-100k, 75.0% for AGIs over 100k)
Taxable interest for individuals: $1,041 (reported on 53.0% of returns)
This zip code:
$1,041
New Hampshire:
$1,634
(% of AGI for various income ranges: 5.1% for AGIs below $10k, 2.3% for AGIs $10k-25k, 1.0% for AGIs $25k-50k, 0.8% for AGIs $50k-75k, 0.7% for AGIs $75k-100k, 1.0% for AGIs over 100k)
Taxable dividends: $1,757 (reported on 29.1% of returns)
Here:
$1,757
State:
$3,855
(% of AGI for various income ranges: 2.5% for AGIs below $10k, 2.1% for AGIs $10k-25k, 0.9% for AGIs $25k-50k, 1.1% for AGIs $50k-75k, 0.6% for AGIs $75k-100k, 0.8% for AGIs over 100k)
Net capital gain/loss: +$5,262 (reported on 22.1% of returns)
Here:
+$5,262
State:
+$13,739
(% of AGI for various income ranges: 3.1% for AGIs below $10k, -0.5% for AGIs $10k-25k, 1.5% for AGIs $25k-50k, 0.8% for AGIs $50k-75k, 1.2% for AGIs $75k-100k, 4.0% for AGIs over 100k)
Profit/loss from business: +$15,713 (reported on 17.6% of returns)
Here:
+$15,713
State:
+$16,641
(% of AGI for various income ranges: -2.9% for AGIs below $10k, 7.2% for AGIs $10k-25k, 6.8% for AGIs $25k-50k, 4.5% for AGIs $50k-75k, 2.7% for AGIs $75k-100k, 5.8% for AGIs over 100k)
IRA payment deduction: $2,893 (reported on 3.8% of returns)
03290:
$2,893
New Hampshire:
$3,013
Self-employed pension: $9,773 (reported on 1.1% of returns)
Here:
$9,773
New Hampshire:
$13,003
Total itemized deductions: $17,144 (21% of AGI, reported on 48.4% of returns)
Here:
$17,144
State:
$18,832
Here:
21.5% of AGI
State:
19.6% of AGI
(% of AGI for various income ranges: 16.9% for AGIs below $10k, 16.8% for AGIs $10k-25k, 16.3% for AGIs $25k-50k, 16.8% for AGIs $50k-75k, 16.0% for AGIs $75k-100k, 11.8% for AGIs over 100k)
Charity contributions deductions: $1,515 (2% of AGI, reported on 40.1% of returns)
Here:
$1,515
State:
$2,473
Here:
1.9% of AGI
State:
2.4% of AGI
(% of AGI for various income ranges: 1.2% for AGIs $10k-25k, 1.0% for AGIs $25k-50k, 1.2% for AGIs $50k-75k, 1.1% for AGIs $75k-100k, 1.0% for AGIs over 100k)
Total tax: $7,628 (reported on 83.6% of returns)
03290:
$7,628
State:
$8,835
(% of AGI for various income ranges: 3.0% for AGIs below $10k, 4.7% for AGIs $10k-25k, 7.4% for AGIs $25k-50k, 9.1% for AGIs $50k-75k, 10.1% for AGIs $75k-100k, 16.5% for AGIs over 100k)
Earned income credit: $1,219 (reported on 7.0% of returns)
Here:
$1,219
State:
$1,447
Percentage of individuals using paid preparers for their 2004 taxes: 47.2%
Here:
47%
State:
51%
(% for various income ranges: 30.9% for AGIs below $10k, 44.3% for AGIs $10k-25k, 49.8% for AGIs $25k-50k, 53.1% for AGIs $50k-75k, 48.6% for AGIs $75k-100k, 55.0% for AGIs over 100k)
Household received Food Stamps/SNAP in the past 12 months: 64 Household did not receive Food Stamps/SNAP in the past 12 months: 1,962
Women who had a birth in the past 12 months: 15 (13 now married, 0 unmarried) Women who did not have a birth in the past 12 months: 909 (549 now married, 364 unmarried)
Housing units in zip code 03290 with a mortgage: 1,215 (189 second mortgage, 172 both second mortgage and home equity loan) Houses without a mortgage: 52
Median monthly owner costs for units with a mortgage: $2,320 Median monthly owner costs for units without a mortgage: $964
Residents with income below the poverty level in 2022:
This zip code:
3.5%
Whole state:
7.2%
Residents with income below 50% of the poverty level in 2022:
This zip code:
2.6%
Whole state:
3.7%
Median number of rooms in houses and condos:
Here:
6.3
State:
6.4
Median number of rooms in apartments:
Here:
5.3
State:
4.0
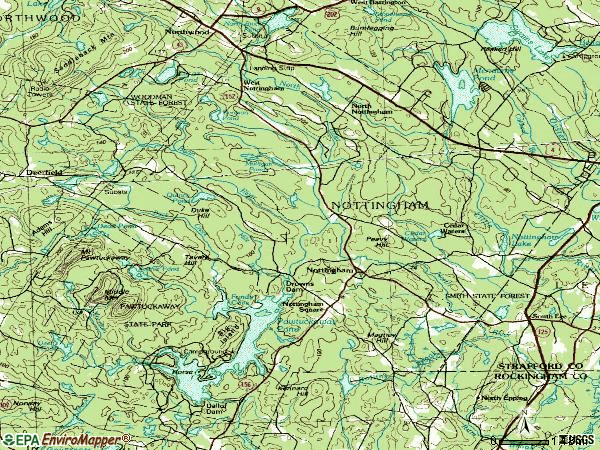
Notable locations in this zip code not listed on our city pages
Lakes, reservoirs, and swamps: Cedar Waters (A), Cyrus Pond (B), Davis Pond (C), Demeritt Pond (D), Kenison Pond (E), Langley Pond (F), Mountain Pond (G), Mulligan Ponds (H). Display/hide their locations on the map
896 married couples with children.
163 single-parent households (100 men, 63 women).
95.1% of residents of 03290 zip code speak English at home.
1.0% of residents speak Spanish at home (72% very well, 28% well).
3.0% of residents speak other Indo-European language at home (98% very well, 2% not well).
0.8% of residents speak Asian or Pacific Island language at home (54% very well, 46% well).
Foreign born population: 207 (4.0%) (49.5% of them are naturalized citizens)
This zip code:
4.0%
Whole state:
6.2%
29%India
22%Germany
21%Kazakhstan
5%Belgium
4%Malaysia
3%Serbia
3%France
23%English
10%American
9%Scottish
7%French Canadian
6%Irish
4%German
3%Dutch
Year of entry for the foreign-born population
1632010 or later
282000 to 2009
371990 to 1999
78Before 1990
Major facilities with environmental interests located in this zip code:
NOTTINGHAM HIGHWAY DEPARTMENT GARAGE (3 FLUTTER ST in NOTTINGHAM, NH)
ENFORCEMENT/COMPLIANCE ACTIVITY (Integrated Compliance Information System) - ICIS-01-2004-9023, FORMAL ENFORCEMENT ACTION (Integrated Compliance Information System) - ICIS-01-2004-9023, FORMAL ENFORCEMENT ACTION Conditionally Exempt Small Quantity Generators, less than 100 kg/month of hazardous waste (Resource Conservation and Recovery Act (tracking hazardous waste)) Organizations: TOWN OF NOTTINGHAM (CONTACT/OPERATOR)
Alternative names: NOTTINGHAM PUBLIC WORKS GARAGE, NOTTINGHAM TOWN OF, NOTTINGHAM TOWN OF HIGHWAY GARAGE
NOTTINGHAM RECYCLING CENTER (11 FREEMAN HALL RD in NOTTINGHAM, NH)
STATE MASTER (New Hampshire water, air, and waste tracking) - LEAKING STORAGE TANK, REFUSE DISPOSAL, STATE CLEANUP SITE, HAZARDOUS WASTE PROGRAM, REFUSE DISPOSAL (Resource Conservation and Recovery Act (tracking hazardous waste)) Business NAICS classification: SOLID WASTE LANDFILL. Organizations: NOTTINGHAM MUNICIPAL UNLINED LANDFILL (CONTACT/GENERAL)
, NOTTINGHAM MUNICIPAL ASH LANDFILL (CONTACT/GENERAL)
, TOWN OF NOTTINGHAM (CONTACT/OPERATOR)
NOTTINGHAM ELEMENTARY SCHOOL (245 STAGE RD in NOTTINGHAM, NH)
(National Center for Education Statistics) - STATE ID-74441341322095 Organizations: NOTTINGHAM SCHOOL DISTRICT (SCHOOL DISTRICT)
CUSTOM WELDING & FABRICATION (127 OLD TURNPIKE RD in NOTTINGHAM, NH)
Conditionally Exempt Small Quantity Generators, less than 100 kg/month of hazardous waste (Resource Conservation and Recovery Act (tracking hazardous waste)) - notification HAZARDOUS WASTE BIENNIAL REPORTER (Resource Conservation and Recovery Act (tracking hazardous waste)) USED OIL PROGRAM (Resource Conservation and Recovery Act (tracking hazardous waste)) Business NAICS classification: CONCRETE PIPE MANUFACTURING.; FOOD PRODUCT MACHINERY MANUFACTURING.; ALL OTHER TRANSPORTATION EQUIPMENT MANUFACTURING. Organizations: DEBRA & PATRICKPARENTEAU (CONTACT/OPERATOR)
BIGELOW TOOL CORP (397 STAGE ROAD in NOTTINGHAM, NH)
Conditionally Exempt Small Quantity Generators, less than 100 kg/month of hazardous waste (Resource Conservation and Recovery Act (tracking hazardous waste)) - notification HAZARDOUS WASTE BIENNIAL REPORTER (Resource Conservation and Recovery Act (tracking hazardous waste)) Organizations: ROBERT GARNEAU, PHILIP MARSTON, WILLIAM (CONTACT/OPERATOR)
Alternative names: BIGELOW TOOL CO INC, STAGE MACHINE INC
STATE OF NH SIS (229 MILL POND RD in NOTTINGHAM, NH)
HAZARDOUS WASTE BIENNIAL REPORTER (Resource Conservation and Recovery Act (tracking hazardous waste)) (Resource Conservation and Recovery Act (tracking hazardous waste)) Alternative names: NOTTINGHAM TOWN OF
CENTRAL HYDRAULIC SVC INC (RTE 4 in NOTTINGHAM, NH)
(Resource Conservation and Recovery Act (tracking hazardous waste))
COATING SYSTEMS INC (NOTTINGHAM WASTE DAY in NOTTINGHAM, NH)
(Resource Conservation and Recovery Act (tracking hazardous waste))
COMCAST (110 RTE 4 in NOTTINGHAM, NH)
(Resource Conservation and Recovery Act (tracking hazardous waste))
EAGLE INDUSTRIES INC (155 OLD TURNPIKE RD in NOTTINGHAM, NH)
(Resource Conservation and Recovery Act (tracking hazardous waste))
ELLIS AUTO BODY (RTE 152 in NOTTINGHAM, NH)
(Resource Conservation and Recovery Act (tracking hazardous waste))
ENVIRONMENTAL CLEANUP (226 OLD TURNPIKE RD in NOTTINGHAM, NH)
USED OIL PROGRAM (Resource Conservation and Recovery Act (tracking hazardous waste)) Organizations: PAULSWEET (CONTACT/OPERATOR)
TOMS GARAGE (12 STAGE RD in NOTTINGHAM, NH)
(Resource Conservation and Recovery Act (tracking hazardous waste))
55.4%Fuel oil, kerosene, etc.
26.0%Bottled, tank, or LP gas
13.3%Wood
2.9%Other fuel
2.3%Electricity
Population in 1990: 598. Population change in the 1990s: +2,987 (+499.5%).
Place of birth for U.S.-born residents:
This state: 2,165
Northeast: 1,904
Midwest: 470
South: 156
West: 183
59% of the 03290 zip code residents lived in the same house 5 years ago. Out of people who lived in different houses, 54% lived in this county. Out of people who lived in different counties, 50% lived in New Hampshire.
92% of the 03290 zip code residents lived in the same house 1 year ago. Out of people who lived in different houses, 52% moved from this county. Out of people who lived in different houses, 26% moved from different county within same state. Out of people who lived in different houses, 20% moved from different state.
Private vs. public school enrollment:
Students in private schools in grades 1 to 8 (elementary and middle school): 42
Here:
8.6%
New Hampshire:
11.4%
Students in private schools in grades 9 to 12 (high school): 30
Here:
16.5%
New Hampshire:
14.0%
Students in private undergraduate colleges: 82
Here:
44.3%
New Hampshire:
38.0%
Occupation by median earnings in the past 12 months ($)
96,291Computer and mathematical occupations
95,587Health diagnosing and treating practitioners and other technical occupations
95,222Management occupations
80,681Life, physical, and social science occupations
80,184Business and financial operations occupations
67,811Transportation occupations
Companies with federal contracts located in this zip code:
CLEWES, WILLIAM TECHNICAL SERV (105 LAKEVIEW DR in NOTTINGHAM, NH) : $392,216 in 14 contractsfrom 1999 to 2006
Contracts for Non-nuclear Ship Repair (East) Ship repair (including overhauls and conversions) performed on non-nuclear propelled and nonpropelled ships east of the 108th meridian, Maintenance, Repair and Rebuilding of Equipment -- Electrical and Electronic Equipment Components, Maintenance, Repair and Rebuilding of Equipment -- Ships, Small Craft, Pontoons, and Floating Docks, Electrical Hardware and Supplies by Navy, Army, U.S. Army Corps of Engineers - civil program financing only, National Oceanic and Atmospheric Administration/Under Secretary for Oceans and Atmosphere, and others Signed by year:2000: $0; 2001: $14,010; 2002: $32,500; 2003: $50,485; 2004: $34,601; 2005: $163,450; 2006: $4,200.
Biggest contracts:
$92,970 with Navy for Non-nuclear Ship Repair (East) Ship repair (including overhauls and conversions) performed on non-nuclear propelled and nonpropelled ships east of the 108th meridian. Taking place in VA. Signed on 1999-12-20. Completion date: 1999-02-25.
$61,440 with Army for Maintenance, Repair and Rebuilding of Equipment -- Electrical and Electronic Equipment Components. Signed on 2005-03-03. Completion date: 2005-04-29.
$61,440 with U.S. Army Corps of Engineers - civil program financing only for Maintenance, Repair and Rebuilding of Equipment -- Electrical and Electronic Equipment Components. Signed on 2005-03-03. Completion date: 2005-04-29.
$50,485 with Navy for Non-nuclear Ship Repair (East) Ship repair (including overhauls and conversions) performed on non-nuclear propelled and nonpropelled ships east of the 108th meridian. Taking place in MD. Signed on 2003-01-15. Completion date: 2002-12-23.
ROBERT M FISHER (17 LAVOIR DRIVE in NOTTINGHAM, NH; small business) : -$400 in 7 contractsfrom 2002 to 2004
Contracts for Other Professional Services by U.S. Army Corps of Engineers - civil program financing only, Army Signed by year:2000: $0; 2001: $0; 2002: -$3,000; 2003: $2,700; 2004: -$100; 2005: $0; 2006: $0.
Biggest contracts:
$5,000 with U.S. Army Corps of Engineers - civil program financing only for Other Professional Services. Taking place in MA. Signed on 2002-01-08. Completion date: 2002-07-18.
$2,700, same as above.Signed on 2003-06-26. Completion date: 2002-07-18.
$2,000, same as above.Signed on 2002-11-08. Completion date: 2002-07-18.
$0, same as above.Signed on 2002-01-08. Completion date: 2002-07-18.
Top industries in this zip code by the number of employees in 2005:
Construction: Other Building Equipment Contractors (20-49 employees: 1 establishment)
Construction: New Single-Family Housing Construction (except Operative Builders) (10-19: 1, 1-4: 3)
Construction: Site Preparation Contractors (10-19: 1, 1-4: 1)
Administrative and Support and Waste Management and Remediation Services: Janitorial Services (5-9: 1)
Administrative and Support and Waste Management and Remediation Services: Exterminating and Pest Control Services (5-9: 1)
Construction: Electrical Contractors (5-9: 1)
Construction: Plumbing, Heating, and Air-Conditioning Contractors (1-4: 3)
Health Care and Social Assistance: Offices of All Other Miscellaneous Health Practitioners (1-4: 2)
Educational Services: Professional and Management Development Training (1-4: 2)
People in group quarters in 2010:
8 people in group homes intended for adults
Fatal accident statistics in 2013:
Fatal accident count: 1
Vehicles involved in fatal accidents: 1
Fatal accidents caused by drunken drivers: 0
Fatalities: 1
Persons involved in fatal accidents: 1
Pedestrians involved in fatal accidents: 0
Home Mortgage Disclosure Act Aggregated Statistics For Year 2009 (Based on 2 full tracts)
A) FHA, FSA/RHS & VA Home Purchase Loans
B) Conventional Home Purchase Loans
C) Refinancings
D) Home Improvement Loans
F) Non-occupant Loans on < 5 Family Dwellings (A B C & D)
G) Loans On Manufactured Home Dwelling (A B C & D)
Number
Average Value
Number
Average Value
Number
Average Value
Number
Average Value
Number
Average Value
Number
Average Value
LOANS ORIGINATED
54
$235,167
54
$203,539
355
$225,901
22
$93,500
18
$282,002
2
$72,400
APPLICATIONS APPROVED, NOT ACCEPTED
4
$186,458
0
$0
44
$222,118
0
$0
2
$78,350
0
$0
APPLICATIONS DENIED
2
$116,040
12
$218,527
159
$230,260
12
$151,249
10
$222,957
2
$151,745
APPLICATIONS WITHDRAWN
0
$0
12
$248,446
73
$230,940
2
$17,850
8
$223,899
0
$0
FILES CLOSED FOR INCOMPLETENESS
0
$0
0
$0
14
$248,942
2
$213,235
0
$0
0
$0
Aggregated Statistics For Year 2008 (Based on 2 full tracts)
A) FHA, FSA/RHS & VA Home Purchase Loans
B) Conventional Home Purchase Loans
C) Refinancings
D) Home Improvement Loans
F) Non-occupant Loans on < 5 Family Dwellings (A B C & D)
G) Loans On Manufactured Home Dwelling (A B C & D)
Number
Average Value
Number
Average Value
Number
Average Value
Number
Average Value
Number
Average Value
Number
Average Value
LOANS ORIGINATED
36
$242,164
71
$254,683
192
$210,768
34
$69,076
12
$217,369
2
$14,875
APPLICATIONS APPROVED, NOT ACCEPTED
12
$227,948
12
$321,343
42
$231,562
8
$86,039
14
$250,359
0
$0
APPLICATIONS DENIED
6
$230,098
30
$217,932
119
$211,895
24
$31,738
10
$101,957
2
$17,850
APPLICATIONS WITHDRAWN
2
$172,575
18
$244,974
75
$241,867
2
$228,115
2
$242,000
2
$122,985
FILES CLOSED FOR INCOMPLETENESS
0
$0
2
$240,015
8
$225,386
0
$0
0
$0
0
$0
Aggregated Statistics For Year 2007 (Based on 2 full tracts)
A) FHA, FSA/RHS & VA Home Purchase Loans
B) Conventional Home Purchase Loans
C) Refinancings
D) Home Improvement Loans
F) Non-occupant Loans on < 5 Family Dwellings (A B C & D)
G) Loans On Manufactured Home Dwelling (A B C & D)
Number
Average Value
Number
Average Value
Number
Average Value
Number
Average Value
Number
Average Value
Number
Average Value
LOANS ORIGINATED
2
$324,320
133
$226,115
226
$174,250
75
$64,110
24
$223,072
8
$82,568
APPLICATIONS APPROVED, NOT ACCEPTED
2
$161,665
12
$249,438
67
$212,008
10
$25,787
0
$0
0
$0
APPLICATIONS DENIED
0
$0
20
$310,235
157
$189,427
36
$125,187
6
$108,107
8
$95,956
APPLICATIONS WITHDRAWN
2
$158,690
14
$186,741
123
$191,667
12
$101,659
10
$250,727
2
$110,090
FILES CLOSED FOR INCOMPLETENESS
0
$0
0
$0
22
$228,295
6
$268,778
0
$0
0
$0
Aggregated Statistics For Year 2006 (Based on 2 full tracts)
A) FHA, FSA/RHS & VA Home Purchase Loans
B) Conventional Home Purchase Loans
C) Refinancings
D) Home Improvement Loans
F) Non-occupant Loans on < 5 Family Dwellings (A B C & D)
G) Loans On Manufactured Home Dwelling (A B C & D)
Number
Average Value
Number
Average Value
Number
Average Value
Number
Average Value
Number
Average Value
Number
Average Value
LOANS ORIGINATED
2
$318,370
208
$190,740
313
$178,505
131
$67,700
24
$192,492
4
$130,917
APPLICATIONS APPROVED, NOT ACCEPTED
0
$0
20
$195,682
48
$142,489
10
$35,903
0
$0
2
$166,620
APPLICATIONS DENIED
2
$364,980
14
$167,898
147
$175,866
50
$95,411
6
$262,827
2
$9,920
APPLICATIONS WITHDRAWN
0
$0
26
$162,121
111
$175,486
18
$166,182
14
$192,268
2
$24,795
FILES CLOSED FOR INCOMPLETENESS
0
$0
10
$134,091
61
$252,795
6
$42,978
2
$182,490
0
$0
Aggregated Statistics For Year 2005 (Based on 2 full tracts)
A) FHA, FSA/RHS & VA Home Purchase Loans
B) Conventional Home Purchase Loans
C) Refinancings
D) Home Improvement Loans
F) Non-occupant Loans on < 5 Family Dwellings (A B C & D)
G) Loans On Manufactured Home Dwelling (A B C & D)
Number
Average Value
Number
Average Value
Number
Average Value
Number
Average Value
Number
Average Value
Number
Average Value
LOANS ORIGINATED
2
$200,345
319
$191,539
423
$178,552
81
$114,118
22
$252,548
8
$122,239
APPLICATIONS APPROVED, NOT ACCEPTED
0
$0
56
$185,360
83
$180,651
20
$55,838
4
$219,682
4
$82,320
APPLICATIONS DENIED
2
$165,630
60
$168,573
151
$194,550
46
$68,175
10
$160,870
0
$0
APPLICATIONS WITHDRAWN
0
$0
48
$160,341
216
$174,529
16
$85,914
4
$233,072
4
$111,578
FILES CLOSED FOR INCOMPLETENESS
0
$0
4
$166,622
81
$195,911
0
$0
0
$0
2
$89,260
Aggregated Statistics For Year 2004 (Based on 2 full tracts)
A) FHA, FSA/RHS & VA Home Purchase Loans
B) Conventional Home Purchase Loans
C) Refinancings
D) Home Improvement Loans
F) Non-occupant Loans on < 5 Family Dwellings (A B C & D)
G) Loans On Manufactured Home Dwelling (A B C & D)
Detailed PMIC statistics for the following Tracts:0580.00
2002 - 2018 National Fire Incident Reporting System (NFIRS) incidents
Based on the data from the years 2002 - 2018 the average number of fires per year is 19. The highest number of fires - 37 took place in 2016, and the least - 8 in 2003. The data has an increasing trend.
When looking into fire subcategories, the most reports belonged to: Structure Fires (58.4%), and Outside Fires (24.3%).
Fire incident types reported to NFIRS in Zip Code 03290


 Nearest zip codes: 03291, 03042, 03037, 03077, 03261, 03861.


 Based on the data from the years 2002 - 2018 the average number of fires per year is 19. The highest number of fires - 37 took place in 2016, and the least - 8 in 2003. The data has an increasing trend.
 When looking into fire subcategories, the most reports belonged to: Structure Fires (58.4%), and Outside Fires (24.3%).