Estimated zip code population in 2022: 4,309 Zip code population in 2010: 3,964 Zip code population in 2000: 1,951
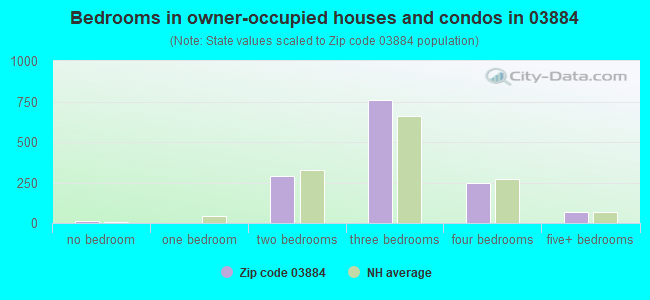
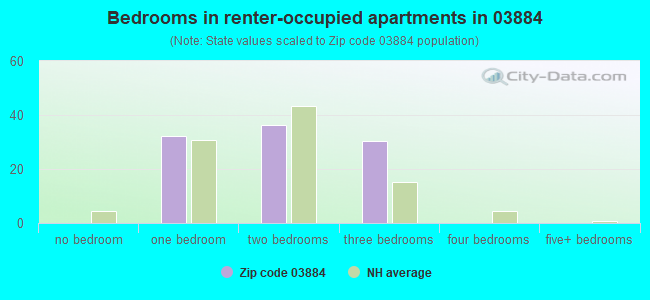
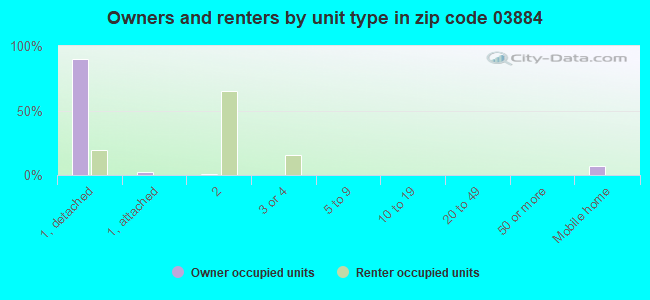
Houses and condos: 1,895 Renter-occupied apartments: 99
% of renters here:
7%
State:
28%
March 2022 cost of living index in zip code 03884: 112.0 (more than average, U.S. average is 100)
Land area: 48.4 sq. mi. Water area: 2.2 sq. mi.
Population density: 89 people per square mile
(very low).
OSM Map
Google Map
MSN Map
OSM Map
General Map
Google Map
MSN Map
OSM Map
Google Map
MSN Map
OSM Map
Google Map
MSN Map
Please wait while loading the map...
Real estate property taxes paid for housing units in 2022:
This zip code:
1.5% ($6,224)
New Hampshire:
1.6% ($6,209)
Median real estate property taxes paid for housing units with mortgages in 2022: $6,195 (1.5%) Median real estate property taxes paid for housing units with no mortgage in 2022: $6,351 (1.7%)
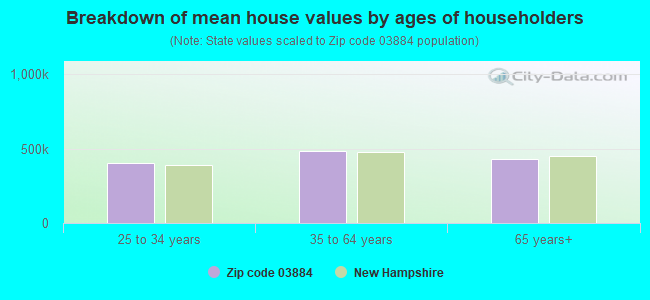
Estimated median house/condo value in 2022: $415,056
03884:
$415,056
New Hampshire:
$384,700
According to our research of New Hampshire and other state lists, there were 6 registered sex offenders living in 03884 zip code as of June 16, 2024. The ratio of all residents to sex offenders in zip code 03884 is 665 to 1. The ratio of registered sex offenders to all residents in this zip code is lower than the state average.
Median resident age:
This zip code:
51.3 years
New Hampshire median age:
43.3 years
Average household size:
This zip code:
2.9 people
New Hampshire:
2.4 people
Averages for the 2020 tax year for zip code 03884, filed in 2021:
Average Adjusted Gross Income (AGI) in 2020: $86,587 (Individual Income Tax Returns)
Here:
$86,587
State:
$88,845
Salary/wage: $74,070 (reported on 83.1% of returns)
Here:
$74,070
State:
$71,693
(% of AGI for various income ranges: 1097.6% for AGIs below $25k, 3440.0% for AGIs $25k-50k, 6526.4% for AGIs $50k-75k, 8936.3% for AGIs $75k-100k, 18249.1% for AGIs $100k-200k, 57440.0% for AGIs over 200k)
Taxable interest for individuals: $1,182 (reported on 40.6% of returns)
This zip code:
$1,182
New Hampshire:
$1,640
(% of AGI for various income ranges: 25.6% for AGIs below $25k, 30.0% for AGIs $25k-50k, 48.0% for AGIs $50k-75k, 77.9% for AGIs $75k-100k, 107.2% for AGIs $100k-200k, 522.0% for AGIs over 200k)
Ordinary dividends: $7,811 (reported on 25.1% of returns)
Here:
$7,811
State:
$8,258
(% of AGI for various income ranges: 28.5% for AGIs below $25k, 85.8% for AGIs $25k-50k, 137.6% for AGIs $50k-75k, 124.7% for AGIs $75k-100k, 454.4% for AGIs $100k-200k, 3796.0% for AGIs over 200k)
Net capital gain/loss in AGI: +$14,861 (reported on 21.0% of returns)
Here:
+$14,861
State:
+$28,952
(% of AGI for various income ranges: 56.5% for AGIs $25k-50k, 76.4% for AGIs $50k-75k, 235.8% for AGIs $75k-100k, 561.9% for AGIs $100k-200k, 8464.0% for AGIs over 200k)
Profit/loss from business: +$21,094 (reported on 16.4% of returns)
Here:
+$21,094
State:
+$24,424
(% of AGI for various income ranges: 111.5% for AGIs below $25k, 221.0% for AGIs $25k-50k, 327.2% for AGIs $50k-75k, 504.2% for AGIs $75k-100k, 1047.8% for AGIs $100k-200k, 2802.0% for AGIs over 200k)
Taxable individual retirement arrangement distribution: $15,033 (reported on 11.0% of returns)
03884:
$15,033
New Hampshire:
$21,952
(% of AGI for various income ranges: 80.9% for AGIs below $25k, 144.2% for AGIs $25k-50k, 263.6% for AGIs $50k-75k, 256.3% for AGIs $75k-100k, 543.8% for AGIs $100k-200k)
Self-employed (Keogh) retirement plans: $16,900 (reported on 0.9% of returns)
03884:
$16,900
New Hampshire:
$24,779
(% of AGI for various income ranges: 109.0% for AGIs $25k-50k)
Total itemized deductions: $30,829 (reported on 7.8% of returns)
Here:
$30,829
State:
$32,702
(% of AGI for various income ranges: 521.2% for AGIs $50k-75k, 334.2% for AGIs $75k-100k, 533.4% for AGIs $100k-200k, 3192.0% for AGIs over 200k)
Charity contributions: $7,085 (reported on 5.9% of returns)
Here:
$7,085
State:
$9,866
(% of AGI for various income ranges: 46.0% for AGIs $50k-75k, 136.2% for AGIs $100k-200k, 740.0% for AGIs over 200k)
Taxes paid: $8,053 (reported on 7.8% of returns)
03884:
$8,053
State:
$8,247
(% of AGI for various income ranges: 138.8% for AGIs $50k-75k, 117.9% for AGIs $75k-100k, 150.9% for AGIs $100k-200k, 630.0% for AGIs over 200k)
Earned income credit: $1,667 (reported on 6.8% of returns)
Here:
$1,667
State:
$1,831
(% of AGI for various income ranges: 46.5% for AGIs below $25k, 29.7% for AGIs $25k-50k)
Percentage of individuals using paid preparers for their 2020 taxes: 92.2%
Here:
92%
State:
92%
(% for various income ranges: 91.7% for AGIs below $25k, 92.7% for AGIs $25k-50k, 91.4% for AGIs $50k-75k, 89.3% for AGIs $75k-100k, 92.7% for AGIs $100k-200k, 100.0% for AGIs over 200k)
Averages for the 2012 tax year for zip code 03884, filed in 2013:
Average Adjusted Gross Income (AGI) in 2012: $63,710 (Individual Income Tax Returns)
Here:
$63,710
State:
$66,185
Salary/wage: $55,625 (reported on 85.6% of returns)
Here:
$55,625
State:
$55,674
(% of AGI for various income ranges: 73.2% for AGIs below $25k, 75.3% for AGIs $25k-50k, 78.0% for AGIs $50k-75k, 77.6% for AGIs $75k-100k, 80.9% for AGIs $100k-200k, 54.1% for AGIs over 200k)
Taxable interest for individuals: $1,075 (reported on 38.3% of returns)
This zip code:
$1,075
New Hampshire:
$1,674
(% of AGI for various income ranges: 1.0% for AGIs below $25k, 0.8% for AGIs $25k-50k, 0.8% for AGIs $50k-75k, 0.6% for AGIs $75k-100k, 0.6% for AGIs $100k-200k, 0.6% for AGIs over 200k)
Ordinary dividends: $4,856 (reported on 25.8% of returns)
Here:
$4,856
State:
$6,774
(% of AGI for various income ranges: 2.2% for AGIs below $25k, 1.8% for AGIs $25k-50k, 1.3% for AGIs $50k-75k, 1.4% for AGIs $75k-100k, 1.7% for AGIs $100k-200k, 4.1% for AGIs over 200k)
Net capital gain/loss in AGI: +$5,340 (reported on 19.1% of returns)
Here:
+$5,340
State:
+$13,759
(% of AGI for various income ranges: 0.5% for AGIs $25k-50k, 0.3% for AGIs $50k-75k, 1.0% for AGIs $75k-100k, 1.7% for AGIs $100k-200k, 5.1% for AGIs over 200k)
Profit/loss from business: +$12,977 (reported on 18.7% of returns)
Here:
+$12,977
State:
+$19,298
(% of AGI for various income ranges: 6.2% for AGIs below $25k, 7.2% for AGIs $25k-50k, 3.8% for AGIs $50k-75k, 3.9% for AGIs $75k-100k, 3.8% for AGIs $100k-200k)
Taxable individual retirement arrangement distribution: $15,784 (reported on 9.1% of returns)
03884:
$15,784
New Hampshire:
$16,908
(% of AGI for various income ranges: 4.1% for AGIs below $25k, 2.8% for AGIs $25k-50k, 1.3% for AGIs $50k-75k, 2.4% for AGIs $75k-100k, 3.1% for AGIs $100k-200k)
Total itemized deductions: $19,471 (19% of AGI, reported on 39.7% of returns)
Here:
$19,471
State:
$22,617
Here:
19.2% of AGI
State:
18.1% of AGI
(% of AGI for various income ranges: 12.5% for AGIs below $25k, 12.0% for AGIs $25k-50k, 13.6% for AGIs $50k-75k, 12.8% for AGIs $75k-100k, 12.3% for AGIs $100k-200k, 9.5% for AGIs over 200k)
Charity contributions: $2,239 (reported on 29.7% of returns)
Here:
$2,239
State:
$2,860
(% of AGI for various income ranges: 0.4% for AGIs below $25k, 0.6% for AGIs $25k-50k, 0.9% for AGIs $50k-75k, 0.8% for AGIs $75k-100k, 1.3% for AGIs $100k-200k, 1.6% for AGIs over 200k)
Taxes paid: $7,891 (reported on 38.8% of returns)
03884:
$7,891
State:
$8,830
(% of AGI for various income ranges: 3.4% for AGIs below $25k, 4.2% for AGIs $25k-50k, 5.4% for AGIs $50k-75k, 4.8% for AGIs $75k-100k, 5.0% for AGIs $100k-200k, 4.7% for AGIs over 200k)
Earned income credit: $1,610 (reported on 9.6% of returns)
Here:
$1,610
State:
$1,863
(% of AGI for various income ranges: 2.8% for AGIs below $25k, 0.7% for AGIs $25k-50k)
Percentage of individuals using paid preparers for their 2012 taxes: 44.0%
Here:
44%
State:
45%
(% for various income ranges: 34.4% for AGIs below $25k, 45.7% for AGIs $25k-50k, 51.5% for AGIs $50k-75k, 48.1% for AGIs $75k-100k, 47.1% for AGIs $100k-200k, 60.0% for AGIs over 200k)
Averages for the 2004 tax year for zip code 03884, filed in 2005:
Average Adjusted Gross Income (AGI) in 2004: $49,800 (Individual Income Tax Returns)
Here:
$49,800
State:
$54,348
Salary/wage: $45,092 (reported on 88.2% of returns)
Here:
$45,092
State:
$46,966
(% of AGI for various income ranges: 104.7% for AGIs below $10k, 77.9% for AGIs $10k-25k, 79.9% for AGIs $25k-50k, 85.0% for AGIs $50k-75k, 84.6% for AGIs $75k-100k, 71.6% for AGIs over 100k)
Taxable interest for individuals: $1,036 (reported on 52.9% of returns)
This zip code:
$1,036
New Hampshire:
$1,634
(% of AGI for various income ranges: 2.1% for AGIs below $10k, 1.6% for AGIs $10k-25k, 0.7% for AGIs $25k-50k, 0.9% for AGIs $50k-75k, 0.6% for AGIs $75k-100k, 1.7% for AGIs over 100k)
Taxable dividends: $1,738 (reported on 28.3% of returns)
Here:
$1,738
State:
$3,855
(% of AGI for various income ranges: 2.7% for AGIs below $10k, 2.0% for AGIs $10k-25k, 0.7% for AGIs $25k-50k, 1.0% for AGIs $50k-75k, 1.3% for AGIs $75k-100k, 0.6% for AGIs over 100k)
Net capital gain/loss: +$6,024 (reported on 22.7% of returns)
Here:
+$6,024
State:
+$13,739
(% of AGI for various income ranges: -2.4% for AGIs below $10k, -0.4% for AGIs $10k-25k, 0.3% for AGIs $25k-50k, 0.5% for AGIs $50k-75k, 1.6% for AGIs $75k-100k, 7.5% for AGIs over 100k)
Profit/loss from business: +$12,648 (reported on 20.1% of returns)
Here:
+$12,648
State:
+$16,641
(% of AGI for various income ranges: 1.8% for AGIs below $10k, 7.1% for AGIs $10k-25k, 7.1% for AGIs $25k-50k, 3.3% for AGIs $50k-75k, 4.4% for AGIs $75k-100k, 5.6% for AGIs over 100k)
IRA payment deduction: $2,521 (reported on 4.0% of returns)
03884:
$2,521
New Hampshire:
$3,013
Self-employed pension: $11,107 (reported on 1.5% of returns)
Here:
$11,107
New Hampshire:
$13,003
Total itemized deductions: $16,012 (21% of AGI, reported on 41.0% of returns)
Here:
$16,012
State:
$18,832
Here:
21.2% of AGI
State:
19.6% of AGI
(% of AGI for various income ranges: 10.4% for AGIs below $10k, 12.5% for AGIs $10k-25k, 14.9% for AGIs $25k-50k, 13.8% for AGIs $50k-75k, 15.0% for AGIs $75k-100k, 10.7% for AGIs over 100k)
Charity contributions deductions: $1,607 (2% of AGI, reported on 35.7% of returns)
Here:
$1,607
State:
$2,473
Here:
2.1% of AGI
State:
2.4% of AGI
(% of AGI for various income ranges: 0.7% for AGIs $10k-25k, 0.8% for AGIs $25k-50k, 1.2% for AGIs $50k-75k, 1.2% for AGIs $75k-100k, 1.4% for AGIs over 100k)
Total tax: $6,574 (reported on 82.4% of returns)
03884:
$6,574
State:
$8,835
(% of AGI for various income ranges: 2.6% for AGIs below $10k, 5.3% for AGIs $10k-25k, 7.7% for AGIs $25k-50k, 8.6% for AGIs $50k-75k, 10.3% for AGIs $75k-100k, 16.4% for AGIs over 100k)
Earned income credit: $1,463 (reported on 6.7% of returns)
Here:
$1,463
State:
$1,447
Percentage of individuals using paid preparers for their 2004 taxes: 46.5%
Here:
46%
State:
51%
(% for various income ranges: 32.6% for AGIs below $10k, 46.9% for AGIs $10k-25k, 48.2% for AGIs $25k-50k, 53.0% for AGIs $50k-75k, 47.1% for AGIs $75k-100k, 53.1% for AGIs over 100k)
Household received Food Stamps/SNAP in the past 12 months: 25 Household did not receive Food Stamps/SNAP in the past 12 months: 1,441
Women who had a birth in the past 12 months: 11 (10 now married, 0 unmarried) Women who did not have a birth in the past 12 months: 740 (463 now married, 279 unmarried)
Housing units in zip code 03884 with a mortgage: 923 (103 second mortgage, 83 both second mortgage and home equity loan) Houses without a mortgage: 16
Median monthly owner costs for units with a mortgage: $2,287 Median monthly owner costs for units without a mortgage: $879
Residents with income below the poverty level in 2022:
This zip code:
8.5%
Whole state:
7.2%
Residents with income below 50% of the poverty level in 2022:
This zip code:
2.4%
Whole state:
3.7%
Median number of rooms in houses and condos:
Here:
6.9
State:
6.4
Median number of rooms in apartments:
Here:
4.0
State:
4.0
Notable locations in this zip code not listed on our city pages
Notable locations in zip code 03884: Parker Mountain Camp (A), Trinity Camp (B), Camp Foss (C), Strafford Fire and Rescue Bow Lake Station (D), Strafford Fire and Rescue Center Station (E), Strafford Fire and Rescue Crown Point Station (F). Display/hide their locations on the map
In group quarters: 9 (-1 institutionalized population)
Size of family households: 696 2-persons, 198 3-persons, 197 4-persons, 127 5-persons, 11 6-persons, 27 7-or-more-persons
Size of nonfamily households: 124 1-person, 76 2-persons
584 married couples with children.
60 single-parent households (50 men, 10 women).
100.0% of residents of 03884 zip code speak English at home.
0.2% of residents speak Spanish at home (100% very well).
0.1% of residents speak Asian or Pacific Island language at home (100% not well).
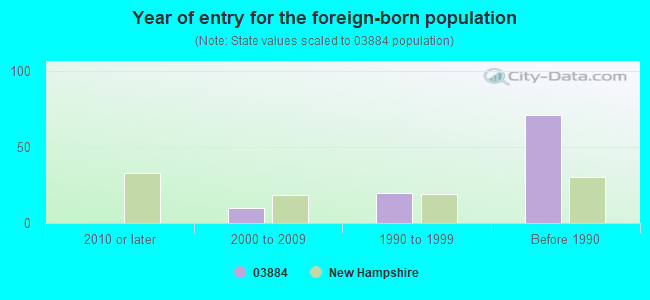
Foreign born population: 47 (1.1%) (59.7% of them are naturalized citizens)
This zip code:
1.1%
Whole state:
6.2%
24%Hong Kong
24%Eritrea
15%Sweden
15%United Kingdom, excluding England and Scotland
13%Italy
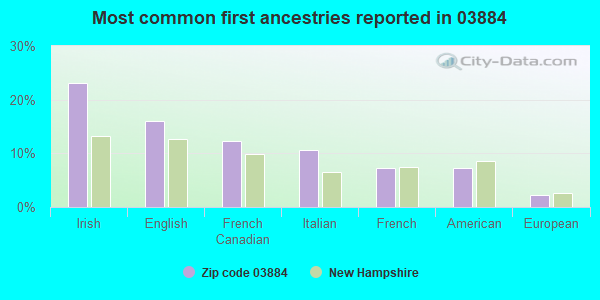
23%Irish
16%English
12%French Canadian
11%Italian
7%French
7%American
2%European
Year of entry for the foreign-born population
02010 or later
102000 to 2009
201990 to 1999
71Before 1990
Major facilities with environmental interests located in this zip code:
AMI GRAPHICS (223 DRAKE HILL RD in STRAFFORD, NH)
Conditionally Exempt Small Quantity Generators, less than 100 kg/month of hazardous waste (Resource Conservation and Recovery Act (tracking hazardous waste)) Organizations: STRAFFORD DISPLAY GRAPHICS LLC (CONTACT/OWNER)
AYER PUBLISHING CO (1 LOWER MILL RD in STRAFFORD, NH)
(Resource Conservation and Recovery Act (tracking hazardous waste))
SACRED HEART PARISH (MAIN ST in STRAFFORD, NH)
(Resource Conservation and Recovery Act (tracking hazardous waste))
STRAFFORD TOWN OF (HYDRANT RD in STRAFFORD, NH)
(Resource Conservation and Recovery Act (tracking hazardous waste))
STRAFFORD TOWN OF (RICKY NELSON RD in STRAFFORD, NH)
(Resource Conservation and Recovery Act (tracking hazardous waste))
THORNES MARKET (PROVIDENCE RD in STRAFFORD, NH)
(Resource Conservation and Recovery Act (tracking hazardous waste))
UPRIGHT FENCE COMPANY (666 BARNDOOR GAP in STRAFFORD, NH)
AIR MINOR (AIRS/AFS) Business SIC classification: NONCLASSIFIABLE ESTABLISHMENTS
WEBBER FUELS (HUCKINS RD in STRAFFORD, NH)
(Resource Conservation and Recovery Act (tracking hazardous waste))
NORTHEAST FEDERAL CREDIT UNION (INTERSECT RTES 202A & 126 in STRAFFORD, NH)
(Resource Conservation and Recovery Act (tracking hazardous waste))
NYNEX (JODY RD in STRAFFORD, NH)
(Resource Conservation and Recovery Act (tracking hazardous waste))
PETER BERUBE (645 FIRST CROWN POINT RD in STRAFFORD, NH)
(Resource Conservation and Recovery Act (tracking hazardous waste))
RT 126 SERVICE CENTER (RTE 126 in STRAFFORD, NH)
(Resource Conservation and Recovery Act (tracking hazardous waste))
S & L MACHINE CO (723 PROVINCE RD in STRAFFORD, NH)
(Resource Conservation and Recovery Act (tracking hazardous waste))
Housing units lacking complete plumbing facilities: 2.9% Housing units lacking complete kitchen facilities: 2.9%
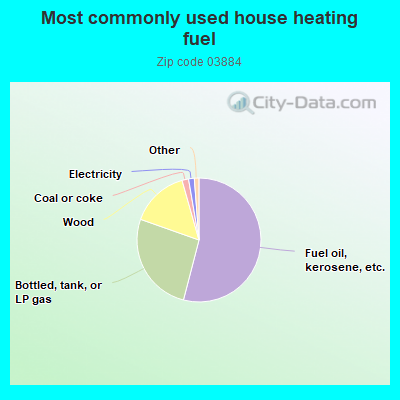
54.1%Fuel oil, kerosene, etc.
26.4%Bottled, tank, or LP gas
15.2%Wood
1.7%Coal or coke
1.5%Electricity
0.6%Utility gas
0.6%Other fuel
Population in 1990: 1,618. Population change in the 1990s: +333 (+20.6%).
Place of birth for U.S.-born residents:
This state: 2,024
Northeast: 1,686
Midwest: 146
South: 145
West: 194
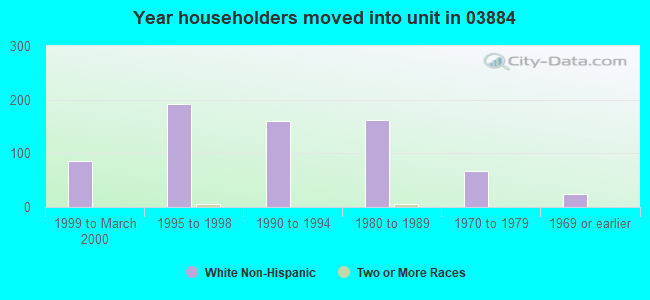
62% of the 03884 zip code residents lived in the same house 5 years ago. Out of people who lived in different houses, 46% lived in this county. Out of people who lived in different counties, 50% lived in New Hampshire.
95% of the 03884 zip code residents lived in the same house 1 year ago. Out of people who lived in different houses, 33% moved from this county. Out of people who lived in different houses, 58% moved from different county within same state. Out of people who lived in different houses, 17% moved from different state.
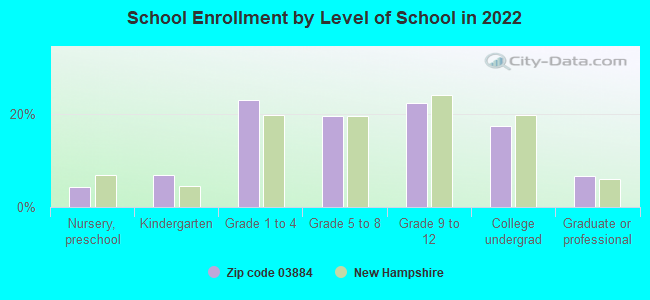
Private vs. public school enrollment:
Students in private schools in grades 1 to 8 (elementary and middle school): 3
Here:
0.9%
New Hampshire:
11.4%
Students in private schools in grades 9 to 12 (high school):
Here:
0.0%
New Hampshire:
14.0%
Students in private undergraduate colleges: 12
Here:
8.8%
New Hampshire:
38.0%
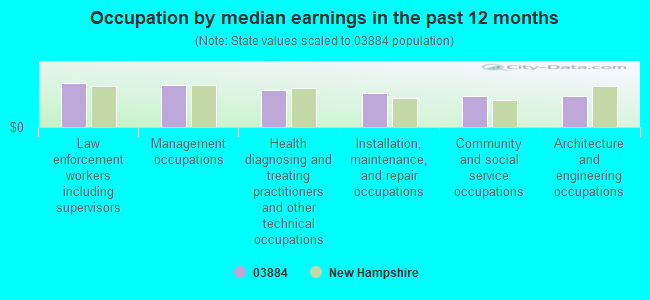
Occupation by median earnings in the past 12 months ($)
108,629Law enforcement workers including supervisors
103,785Management occupations
90,606Health diagnosing and treating practitioners and other technical occupations
82,910Installation, maintenance, and repair occupations
77,418Community and social service occupations
77,300Architecture and engineering occupations
Companies with federal contracts located in this zip code:
DAVID R WHITCHER BUILDER, INC (254 DRAKE HILL ROAD in STRAFFORD, NH; small business) : $5,189,562 in 14 contractsfrom 2000 to 2006
Contracts for Construction of Structures and Facilities -- Other Industrial Buildings, Construction of Structures and Facilities -- Maintenance Buildings, Maintenance, Repair or Alteration of Real Property -- Office Buildings, Construction of Structures and Facilities -- Other Airfield Structures, and moreby Army, Public Buildings Service Signed by year:2000: $216,438; 2001: $922,000; 2002: $0; 2003: $0; 2004: $0; 2005: $2,554,681; 2006: $1,496,443.
Biggest contracts:
$2,063,011 with Army for Construction of Structures and Facilities -- Other Industrial Buildings. Signed on 2005-06-08. Completion date: 2006-06-07.
$1,420,876 with Army for Construction of Structures and Facilities -- Maintenance Buildings. Signed on 2006-04-28. Completion date: 2007-04-27.
$888,000 with Public Buildings Service for Maintenance, Repair or Alteration of Real Property -- Office Buildings. Signed on 2001-04-15. Completion date: 2001-11-15.
$502,493 with Army for Construction of Structures and Facilities -- Other Airfield Structures. Signed on 2005-06-08. Completion date: 2006-06-08.
NORTHEAST BUSINESS SYSTEMS (1716 PROVINCE ROAD in STRAFFORD, NH; small business)
$4,100 with Navy for Maintenance, Repair and Rebuilding of Equipment -- Office Machines, Text Processing Systems and Visible Record Equipment. Taking place in ME. Signed on 2004-10-01. Completion date: 2005-09-30.
Top industries in this zip code by the number of employees in 2005:
Construction: Commercial and Institutional Building Construction (20-49 employees: 1 establishment)
Accommodation and Food Services: Full-Service Restaurants (5-9: 1, 1-4: 2)
Construction: Electrical Contractors (5-9: 1)
Professional, Scientific, and Technical Services: Graphic Design Services (5-9: 1)
Professional, Scientific, and Technical Services: Display Advertising (5-9: 1)
Professional, Scientific, and Technical Services: Engineering Services (5-9: 1)
Construction: Site Preparation Contractors (5-9: 1)
Construction: Plumbing, Heating, and Air-Conditioning Contractors (1-4: 3)
Construction: New Single-Family Housing Construction (except Operative Builders) (1-4: 3)
People in group quarters in 2010:
6 people in group homes intended for adults
Fatal accident statistics in 2013:
Fatal accident count: 1
Vehicles involved in fatal accidents: 1
Fatal accidents caused by drunken drivers: 0
Fatalities: 1
Persons involved in fatal accidents: 1
Pedestrians involved in fatal accidents: 0
Home Mortgage Disclosure Act Aggregated Statistics For Year 2009 (Based on 2 partial tracts)
A) FHA, FSA/RHS & VA Home Purchase Loans
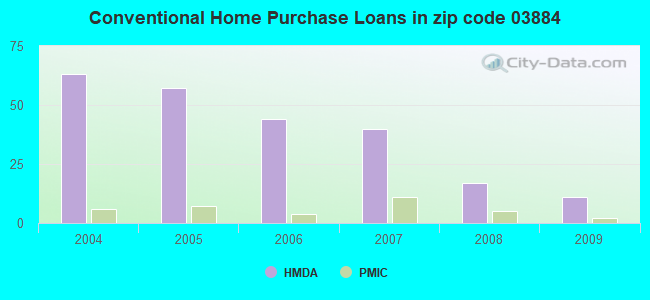
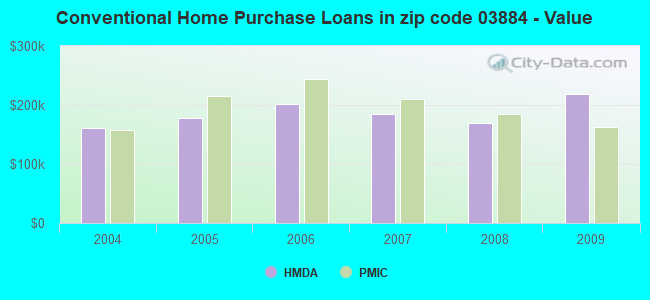
B) Conventional Home Purchase Loans
C) Refinancings
D) Home Improvement Loans
F) Non-occupant Loans on < 5 Family Dwellings (A B C & D)
G) Loans On Manufactured Home Dwelling (A B C & D)
Number
Average Value
Number
Average Value
Number
Average Value
Number
Average Value
Number
Average Value
Number
Average Value
LOANS ORIGINATED
11
$219,894
11
$218,488
93
$179,963
14
$122,737
7
$167,834
2
$90,715
APPLICATIONS APPROVED, NOT ACCEPTED
0
$0
1
$78,920
7
$153,189
0
$0
1
$78,920
0
$0
APPLICATIONS DENIED
3
$273,370
4
$197,502
32
$180,594
6
$52,207
2
$264,825
2
$18,305
APPLICATIONS WITHDRAWN
2
$166,380
2
$376,290
27
$218,979
1
$117,970
0
$0
0
$0
FILES CLOSED FOR INCOMPLETENESS
0
$0
0
$0
2
$199,330
1
$28,480
0
$0
1
$28,480
Aggregated Statistics For Year 2008 (Based on 2 partial tracts)
A) FHA, FSA/RHS & VA Home Purchase Loans
B) Conventional Home Purchase Loans
C) Refinancings
D) Home Improvement Loans
F) Non-occupant Loans on < 5 Family Dwellings (A B C & D)
G) Loans On Manufactured Home Dwelling (A B C & D)
Number
Average Value
Number
Average Value
Number
Average Value
Number
Average Value
Number
Average Value
Number
Average Value
LOANS ORIGINATED
5
$223,578
17
$169,229
50
$179,952
7
$84,499
4
$220,892
3
$164,347
APPLICATIONS APPROVED, NOT ACCEPTED
0
$0
3
$179,263
11
$175,368
2
$25,630
2
$137,090
2
$54,920
APPLICATIONS DENIED
2
$160,685
1
$69,970
47
$197,566
7
$74,037
3
$254,927
2
$106,990
APPLICATIONS WITHDRAWN
0
$0
1
$91,940
16
$216,570
2
$207,060
0
$0
1
$91,940
FILES CLOSED FOR INCOMPLETENESS
0
$0
0
$0
2
$286,795
0
$0
0
$0
0
$0
Aggregated Statistics For Year 2007 (Based on 2 partial tracts)
A) FHA, FSA/RHS & VA Home Purchase Loans
B) Conventional Home Purchase Loans
C) Refinancings
D) Home Improvement Loans
F) Non-occupant Loans on < 5 Family Dwellings (A B C & D)
G) Loans On Manufactured Home Dwelling (A B C & D)
Number
Average Value
Number
Average Value
Number
Average Value
Number
Average Value
Number
Average Value
Number
Average Value
LOANS ORIGINATED
1
$166,790
40
$183,996
64
$162,720
18
$75,258
10
$194,369
6
$61,292
APPLICATIONS APPROVED, NOT ACCEPTED
0
$0
5
$251,402
12
$199,128
3
$12,747
1
$1,630
1
$20,340
APPLICATIONS DENIED
2
$182,655
7
$167,834
61
$178,805
15
$75,773
9
$188,664
4
$99,260
APPLICATIONS WITHDRAWN
0
$0
2
$202,180
24
$183,467
2
$52,475
2
$261,165
0
$0
FILES CLOSED FOR INCOMPLETENESS
1
$174,110
2
$101,700
6
$227,672
0
$0
0
$0
0
$0
Aggregated Statistics For Year 2006 (Based on 2 partial tracts)
A) FHA, FSA/RHS & VA Home Purchase Loans
B) Conventional Home Purchase Loans
C) Refinancings
D) Home Improvement Loans
F) Non-occupant Loans on < 5 Family Dwellings (A B C & D)
G) Loans On Manufactured Home Dwelling (A B C & D)
Number
Average Value
Number
Average Value
Number
Average Value
Number
Average Value
Number
Average Value
Number
Average Value
LOANS ORIGINATED
2
$249,775
44
$201,070
84
$153,925
25
$55,325
4
$182,042
5
$128,224
APPLICATIONS APPROVED, NOT ACCEPTED
0
$0
9
$203,310
16
$190,281
3
$18,713
0
$0
0
$0
APPLICATIONS DENIED
0
$0
9
$140,843
47
$162,304
20
$62,850
4
$105,360
2
$63,055
APPLICATIONS WITHDRAWN
0
$0
4
$259,335
43
$201,205
5
$111,626
0
$0
1
$88,680
FILES CLOSED FOR INCOMPLETENESS
0
$0
0
$0
15
$179,589
2
$122,855
2
$110,650
1
$122,040
Aggregated Statistics For Year 2005 (Based on 2 partial tracts)
A) FHA, FSA/RHS & VA Home Purchase Loans
B) Conventional Home Purchase Loans
C) Refinancings
D) Home Improvement Loans
F) Non-occupant Loans on < 5 Family Dwellings (A B C & D)
G) Loans On Manufactured Home Dwelling (A B C & D)
Number
Average Value
Number
Average Value
Number
Average Value
Number
Average Value
Number
Average Value
Number
Average Value
LOANS ORIGINATED
2
$240,825
57
$178,592
147
$159,122
28
$82,086
9
$221,299
7
$120,646
APPLICATIONS APPROVED, NOT ACCEPTED
0
$0
8
$174,619
15
$151,492
2
$69,970
0
$0
1
$8,140
APPLICATIONS DENIED
0
$0
10
$183,467
50
$153,299
21
$57,417
2
$6,510
5
$113,254
APPLICATIONS WITHDRAWN
0
$0
7
$188,174
52
$183,983
10
$60,125
1
$136,680
1
$50,440
FILES CLOSED FOR INCOMPLETENESS
0
$0
4
$215,400
26
$169,072
1
$22,780
0
$0
0
$0
Aggregated Statistics For Year 2004 (Based on 2 partial tracts)
A) FHA, FSA/RHS & VA Home Purchase Loans
B) Conventional Home Purchase Loans
C) Refinancings
D) Home Improvement Loans
F) Non-occupant Loans on < 5 Family Dwellings (A B C & D)
G) Loans On Manufactured Home Dwelling (A B C & D)
Detailed PMIC statistics for the following Tracts:0860.00
2002 - 2018 National Fire Incident Reporting System (NFIRS) incidents
Based on the data from the years 2002 - 2018 the average number of fires per year is 14. The highest number of fires - 39 took place in 2015, and the least - 0 in 2003. The data has a rising trend.
When looking into fire subcategories, the most incidents belonged to: Structure Fires (69.1%), and Outside Fires (20.2%).
Fire incident types reported to NFIRS in Zip Code 03884


 Nearest zip codes: 03261, 03291, 03225, 03218, 03835, 03263.


 Based on the data from the years 2002 - 2018 the average number of fires per year is 14. The highest number of fires - 39 took place in 2015, and the least - 0 in 2003. The data has a rising trend.
 When looking into fire subcategories, the most incidents belonged to: Structure Fires (69.1%), and Outside Fires (20.2%).