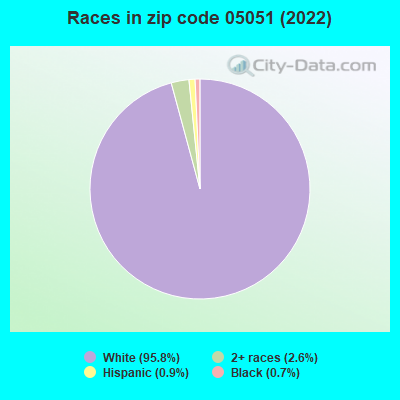
Estimated zip code population in 2022: 1,238 Zip code population in 2010: 1,549 Zip code population in 2000: 544
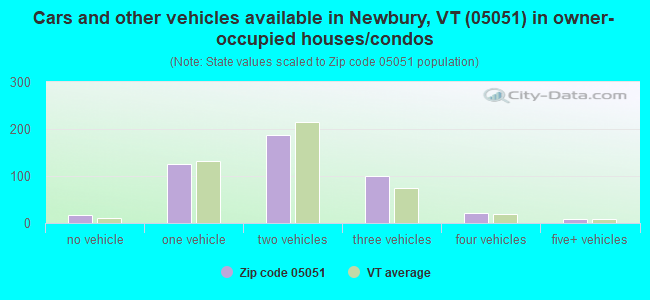
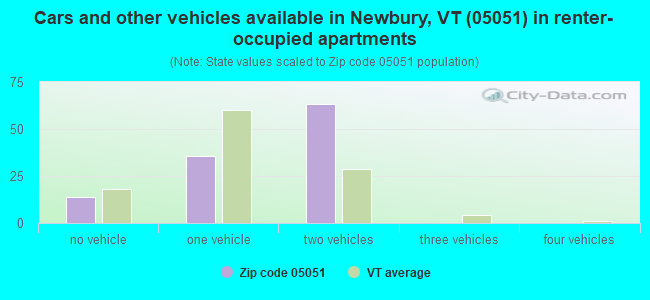
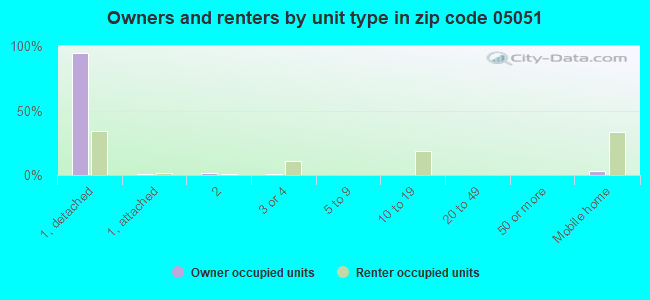
Houses and condos: 767 Renter-occupied apartments: 111
% of renters here:
20%
State:
26%
March 2022 cost of living index in zip code 05051: 93.1 (less than average, U.S. average is 100)
Land area: 48.0 sq. mi. Water area: 0.7 sq. mi.
Population density: 26 people per square mile
(very low).
OSM Map
Google Map
MSN Map
OSM Map
General Map
Google Map
MSN Map
OSM Map
Google Map
MSN Map
OSM Map
Google Map
MSN Map
Please wait while loading the map...
Real estate property taxes paid for housing units in 2022:
This zip code:
1.3% ($3,492)
Vermont:
1.6% ($4,787)
Median real estate property taxes paid for housing units with mortgages in 2022: $3,330 (1.4%) Median real estate property taxes paid for housing units with no mortgage in 2022: $3,847 (1.3%)
Averages for the 2020 tax year for zip code 05051, filed in 2021:
Average Adjusted Gross Income (AGI) in 2020: $54,200 (Individual Income Tax Returns)
Here:
$54,200
State:
$70,107
Salary/wage: $45,110 (reported on 75.9% of returns)
Here:
$45,110
State:
$56,381
(% of AGI for various income ranges: 1128.2% for AGIs below $25k, 3343.3% for AGIs $25k-50k, 7561.7% for AGIs $50k-75k, 8023.3% for AGIs $75k-100k, 20993.3% for AGIs $100k-200k)
Taxable interest for individuals: $1,082 (reported on 31.5% of returns)
This zip code:
$1,082
Vermont:
$1,276
(% of AGI for various income ranges: 8.2% for AGIs below $25k, 24.2% for AGIs $25k-50k, 31.7% for AGIs $50k-75k, 60.0% for AGIs $75k-100k, 363.3% for AGIs $100k-200k)
Ordinary dividends: $3,633 (reported on 16.7% of returns)
Here:
$3,633
State:
$8,930
(% of AGI for various income ranges: 32.7% for AGIs below $25k, 56.7% for AGIs $25k-50k, 183.3% for AGIs $50k-75k, 376.7% for AGIs $100k-200k)
Net capital gain/loss in AGI: +$5,900 (reported on 16.7% of returns)
Here:
+$5,900
State:
+$19,777
(% of AGI for various income ranges: 78.2% for AGIs below $25k, 380.0% for AGIs $50k-75k, 723.3% for AGIs $100k-200k)
Profit/loss from business: +$9,275 (reported on 14.8% of returns)
Here:
+$9,275
State:
+$15,467
(% of AGI for various income ranges: 104.5% for AGIs below $25k, 259.2% for AGIs $25k-50k, 1053.3% for AGIs $75k-100k)
Taxable individual retirement arrangement distribution: $8,314 (reported on 13.0% of returns)
05051:
$8,314
Vermont:
$17,245
(% of AGI for various income ranges: 99.1% for AGIs below $25k, 84.2% for AGIs $25k-50k, 1240.0% for AGIs $75k-100k)
Earned income credit: $1,662 (reported on 14.8% of returns)
Here:
$1,662
State:
$1,839
(% of AGI for various income ranges: 73.6% for AGIs below $25k, 43.3% for AGIs $25k-50k)
Percentage of individuals using paid preparers for their 2020 taxes: 94.4%
Here:
94%
State:
93%
(% for various income ranges: 94.4% for AGIs below $25k, 100.0% for AGIs $25k-50k, 90.0% for AGIs $50k-75k, 100.0% for AGIs $75k-100k, 85.7% for AGIs $100k-200k)
Averages for the 2012 tax year for zip code 05051, filed in 2013:
Average Adjusted Gross Income (AGI) in 2012: $38,865 (Individual Income Tax Returns)
Here:
$38,865
State:
$55,225
Salary/wage: $34,750 (reported on 74.5% of returns)
Here:
$34,750
State:
$44,925
(% of AGI for various income ranges: 62.1% for AGIs below $25k, 76.5% for AGIs $25k-50k, 75.3% for AGIs $50k-75k, 58.0% for AGIs $75k-100k, 56.0% for AGIs $100k-200k)
Taxable interest for individuals: $817 (reported on 35.3% of returns)
This zip code:
$817
Vermont:
$1,237
(% of AGI for various income ranges: 2.5% for AGIs below $25k, 0.6% for AGIs $25k-50k, 0.4% for AGIs $50k-75k, 0.9% for AGIs $75k-100k, 0.2% for AGIs $100k-200k)
Ordinary dividends: $3,050 (reported on 23.5% of returns)
Here:
$3,050
State:
$7,010
(% of AGI for various income ranges: 3.4% for AGIs below $25k, 3.0% for AGIs $25k-50k, 4.2% for AGIs $75k-100k)
Net capital gain/loss in AGI: +$300 (reported on 15.7% of returns)
Here:
+$300
State:
+$13,197
(% of AGI for various income ranges: 0.5% for AGIs below $25k, 0.5% for AGIs $75k-100k)
Profit/loss from business: +$14,530 (reported on 19.6% of returns)
Here:
+$14,530
State:
+$12,941
(% of AGI for various income ranges: 12.6% for AGIs below $25k, 7.1% for AGIs $25k-50k, 23.6% for AGIs $75k-100k)
Taxable individual retirement arrangement distribution: $6,662 (reported on 15.7% of returns)
05051:
$6,662
Vermont:
$12,934
Total itemized deductions: $17,577 (25% of AGI, reported on 25.5% of returns)
Here:
$17,577
State:
$22,572
Here:
24.7% of AGI
State:
19.9% of AGI
(% of AGI for various income ranges: 14.8% for AGIs $25k-50k, 21.1% for AGIs $50k-75k, 12.9% for AGIs $100k-200k)
Charity contributions: $1,914 (reported on 13.7% of returns)
Here:
$1,914
State:
$3,170
(% of AGI for various income ranges: 1.2% for AGIs below $25k, 1.2% for AGIs $50k-75k, 1.1% for AGIs $100k-200k)
Taxes paid: $6,262 (reported on 25.5% of returns)
05051:
$6,262
State:
$10,425
(% of AGI for various income ranges: 3.5% for AGIs $25k-50k, 7.0% for AGIs $50k-75k, 6.9% for AGIs $100k-200k)
Earned income credit: $1,662 (reported on 15.7% of returns)
Here:
$1,662
State:
$1,828
(% of AGI for various income ranges: 4.0% for AGIs below $25k, 0.8% for AGIs $25k-50k)
Percentage of individuals using paid preparers for their 2012 taxes: 51.0%
Here:
51%
State:
49%
(% for various income ranges: 52.2% for AGIs below $25k, 46.2% for AGIs $25k-50k, 50.0% for AGIs $50k-75k, 50.0% for AGIs $75k-100k, 66.7% for AGIs $100k-200k)
Averages for the 2004 tax year for zip code 05051, filed in 2005:
Average Adjusted Gross Income (AGI) in 2004: $38,605 (Individual Income Tax Returns)
Here:
$38,605
State:
$44,564
Salary/wage: $32,575 (reported on 78.0% of returns)
Here:
$32,575
State:
$37,522
(% of AGI for various income ranges: 95.9% for AGIs below $10k, 70.0% for AGIs $10k-25k, 74.8% for AGIs $25k-50k, 79.8% for AGIs $50k-75k, 75.3% for AGIs $75k-100k, 44.5% for AGIs over 100k)
Taxable interest for individuals: $1,579 (reported on 47.9% of returns)
This zip code:
$1,579
Vermont:
$1,373
(% of AGI for various income ranges: 4.1% for AGIs below $10k, 4.4% for AGIs $10k-25k, 1.7% for AGIs $25k-50k, 0.7% for AGIs $50k-75k, 1.5% for AGIs $75k-100k, 1.9% for AGIs over 100k)
Taxable dividends: $1,767 (reported on 25.9% of returns)
Here:
$1,767
State:
$4,037
(% of AGI for various income ranges: 10.8% for AGIs below $10k, 3.0% for AGIs $10k-25k, 1.1% for AGIs $25k-50k, 1.1% for AGIs $50k-75k, 0.5% for AGIs over 100k)
Net capital gain/loss: +$6,853 (reported on 20.5% of returns)
Here:
+$6,853
State:
+$11,311
(% of AGI for various income ranges: -3.1% for AGIs below $10k, -0.2% for AGIs $10k-25k, 0.0% for AGIs $25k-50k, 1.0% for AGIs $50k-75k, 10.9% for AGIs over 100k)
Profit/loss from business: +$11,323 (reported on 19.6% of returns)
Here:
+$11,323
State:
+$11,197
Total itemized deductions: $15,165 (19% of AGI, reported on 25.6% of returns)
Here:
$15,165
State:
$17,791
Here:
19.4% of AGI
State:
20.0% of AGI
(% of AGI for various income ranges: 8.9% for AGIs $10k-25k, 8.7% for AGIs $25k-50k, 8.1% for AGIs $50k-75k, 14.3% for AGIs $75k-100k, 11.4% for AGIs over 100k)
Charity contributions deductions: $1,071 (1% of AGI, reported on 16.9% of returns)
Here:
$1,071
State:
$2,686
Here:
1.3% of AGI
State:
2.8% of AGI
Total tax: $5,368 (reported on 75.3% of returns)
05051:
$5,368
State:
$6,533
(% of AGI for various income ranges: 2.7% for AGIs below $10k, 4.6% for AGIs $10k-25k, 7.4% for AGIs $25k-50k, 7.7% for AGIs $50k-75k, 10.3% for AGIs $75k-100k, 16.8% for AGIs over 100k)
Earned income credit: $1,532 (reported on 14.2% of returns)
Here:
$1,532
State:
$1,432
Percentage of individuals using paid preparers for their 2004 taxes: 60.8%
Here:
61%
State:
54%
(% for various income ranges: 50.0% for AGIs below $10k, 60.4% for AGIs $10k-25k, 69.2% for AGIs $25k-50k, 64.1% for AGIs $50k-75k, 50.0% for AGIs $75k-100k, 75.0% for AGIs over 100k)
Likely homosexual households (counted as self-reported same-sex unmarried-partner households)
Lesbian couples: 0.6% of all households
Gay men: 0.0% of all households
Household received Food Stamps/SNAP in the past 12 months: 90 Household did not receive Food Stamps/SNAP in the past 12 months: 479
Women who had a birth in the past 12 months: 48 (12 now married, 38 unmarried) Women who did not have a birth in the past 12 months: 266 (115 now married, 151 unmarried)
Housing units in zip code 05051 with a mortgage: 265 (10 second mortgage, 8 both second mortgage and home equity loan) Houses without a mortgage: 3
Median monthly owner costs for units with a mortgage: $1,747 Median monthly owner costs for units without a mortgage: $720
Residents with income below the poverty level in 2022:
This zip code:
6.2%
Whole state:
10.4%
Residents with income below 50% of the poverty level in 2022:
This zip code:
4.6%
Whole state:
6.1%
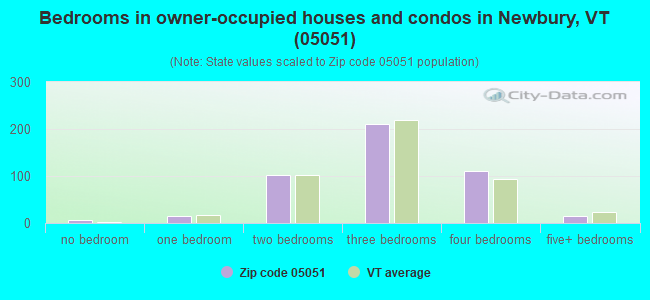
Median number of rooms in houses and condos:
Here:
5.8
State:
6.4
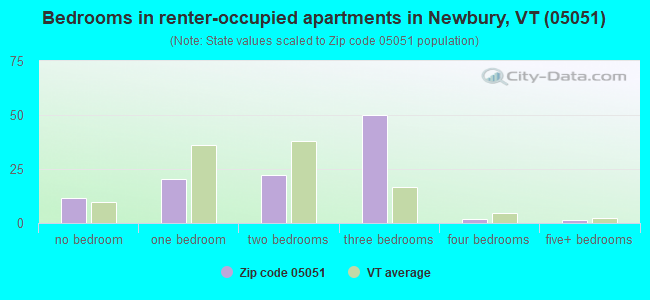
Median number of rooms in apartments:
Here:
5.1
State:
3.9
Notable locations in this zip code not listed on our city pages
Notable locations in zip code 05051: Tenney Memorial Library (A), Newbury Fire Department (B), West Newbury Fire Department (C). Display/hide their locations on the map
Cemeteries: West Newbury Cemetery (1), Tucker Mountain-Putnam Cemetery (2), Renfrow-Heath Cemetery (3), Oxbow Cemetery (4), Jefferson Hill Cemetery (5), Oxbow Cemetery (6), Rogers Hill Cemetery (7). Display/hide their locations on the map
Lakes, reservoirs, and swamps: Eastman Pond (A), Round Pond (B), Muddy Pond (C), Harriman Pond (D), Halls Lake (E), Long Pond (F), The Fish Pond (G), Halls Lake (H). Display/hide their locations on the map
Parks in zip code 05051 include: Newbury Historic District (1), Bayley Historic District (2), South Newbury Village Historic District (3), West Newbury Village Historic District (4). Display/hide their locations on the map
Size of family households: 155 2-persons, 56 3-persons, 131 4-persons, 21 5-persons, 1 6-persons
Size of nonfamily households: 183 1-person, 15 2-persons
164 married couples with children.
67 single-parent households (32 men, 35 women).
97.4% of residents of 05051 zip code speak English at home.
0.6% of residents speak Spanish at home (100% very well).
1.8% of residents speak other Indo-European language at home (10% very well, 90% well).
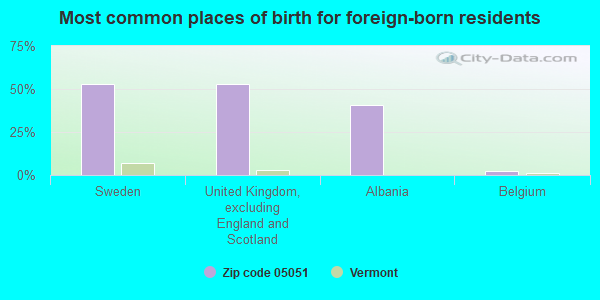
Foreign born population: 46 (3.8%) (75.2% of them are naturalized citizens)
This zip code:
3.8%
Whole state:
4.2%
53%Sweden
53%United Kingdom, excluding England and Scotland
40%Albania
2%Belgium
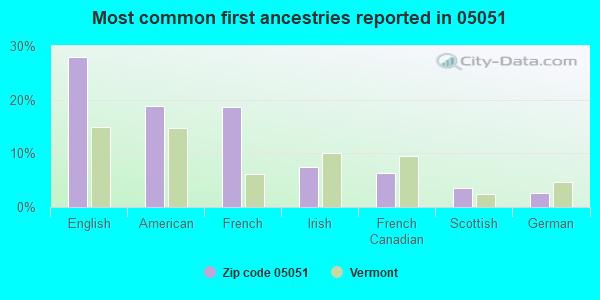
28%English
19%American
19%French
8%Irish
6%French Canadian
4%Scottish
3%German
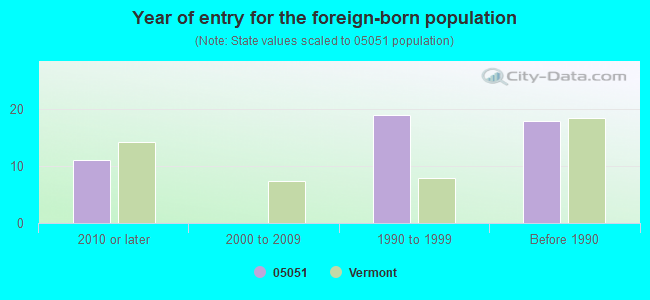
Year of entry for the foreign-born population
112010 or later
02000 to 2009
191990 to 1999
18Before 1990
Facilities with environmental interests located in this zip code:
BRADFORD OIL P & H TRUCK STOP (2886 RTE 302 in NEWBURY, VT)
Small Quantity Generators, between 100 kg and 1000 kg of hazardous waste/month (Resource Conservation and Recovery Act (tracking hazardous waste)) Organizations: BRADFORD OIL CO (CONTACT/OPERATOR)
, GEORGE PRATT (CONTACT/OWNER)
CON-WAY CENTRAL EXPRESS (77 MAIN ST in NEWBURY, VT)
Small Quantity Generators, between 100 kg and 1000 kg of hazardous waste/month (Resource Conservation and Recovery Act (tracking hazardous waste)) Organizations: WALTER & CAROL YOUNG (CONTACT/OWNER)
PIKE INDUSTRIES INC. (PERINI ROAD in NEWBURY, VT)
National Pollutant Discharge Elimination System NON-MAJOR (Tracking pollutant discharge elimination systems) - permit
NEWBURY ELEMENTRY SCHOOL (ROUTE 5 BOX 165 in NEWBURY, VT)
(Geographic Names Information System) COMPLIANCE ACTIVITY (Tracking inspections of insecticide, fungicide, and rodenticide, and toxic substances) Alternative names: NEWBURY ELEMENTARY SCHOOL
RALPHS TRANSMISSION (SWAMP RD in NEWBURY, VT)
Conditionally Exempt Small Quantity Generators, less than 100 kg/month of hazardous waste (Resource Conservation and Recovery Act (tracking hazardous waste)) - notification Organizations: SHARON EMERSON (CONTACT/OWNER)
VT AGENCY OF TRANSPORTATION (705 BOLTONVILLE US 302 in NEWBURY, VT)
Conditionally Exempt Small Quantity Generators, less than 100 kg/month of hazardous waste (Resource Conservation and Recovery Act (tracking hazardous waste)) - notification Organizations: STATE OF VT (CONTACT/OWNER)
NEWBURY CHRISTIAN SCHOOL (CROSS STREET in NEWBURY, VT)
COMPLIANCE ACTIVITY (Tracking inspections of insecticide, fungicide, and rodenticide, and toxic substances)
Housing units lacking complete plumbing facilities: 6.4% Housing units lacking complete kitchen facilities: 4.9%
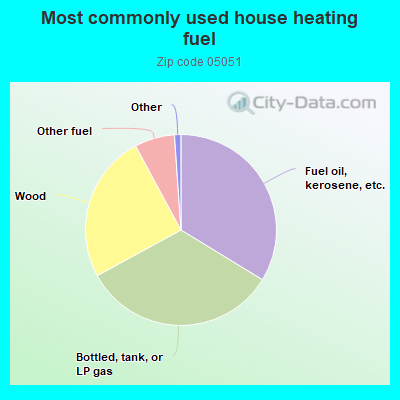
33.9%Fuel oil, kerosene, etc.
33.5%Bottled, tank, or LP gas
25.2%Wood
6.8%Other fuel
0.6%Utility gas
0.6%Electricity
Population in 1990: 1,488.
Place of birth for U.S.-born residents:
This state: 322
Northeast: 699
Midwest: 38
South: 53
West: 81
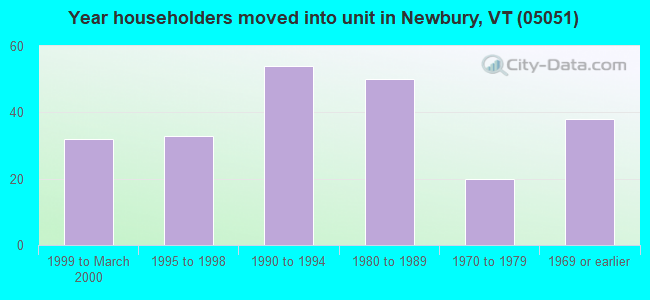
69% of the 05051 zip code residents lived in the same house 5 years ago. Out of people who lived in different houses, 49% lived in this county. Out of people who lived in different counties, 50% lived in Vermont.
93% of the 05051 zip code residents lived in the same house 1 year ago. Out of people who lived in different houses, 35% moved from this county. Out of people who lived in different houses, 24% moved from different county within same state. Out of people who lived in different houses, 39% moved from different state.
Private vs. public school enrollment:
Students in private schools in grades 1 to 8 (elementary and middle school):
Here:
0.0%
Vermont:
10.3%
Students in private schools in grades 9 to 12 (high school):
Here:
0.0%
Vermont:
11.6%
Students in private undergraduate colleges: 10
Here:
13.6%
Vermont:
29.2%
Occupation by median earnings in the past 12 months ($)
155,261Health diagnosing and treating practitioners and other technical occupations
110,242Computer and mathematical occupations
77,965Management occupations
64,184Production occupations
54,212Arts, design, entertainment, sports, and media occupations
52,819Healthcare support occupations
Top industries in this zip code by the number of employees in 2005:
Professional, Scientific, and Technical Services: Veterinary Services (10-19: 1)
Health Care and Social Assistance: Homes for the Elderly (10-19: 1)
Finance and Insurance: Insurance Agencies and Brokerages (5-9: 1)
Other Services (except Public Administration): Religious Organizations (1-4: 2)
Professional, Scientific, and Technical Services: Offices of Lawyers (1-4: 2)
Accommodation and Food Services: Recreational and Vacation Camps (except Campgrounds) (1-4: 1)
Information: Book Publishers (1-4: 1)
2002 - 2018 National Fire Incident Reporting System (NFIRS) incidents
According to the data from the years 2002 - 2018 the average number of fires per year is 14. The highest number of fires - 26 took place in 2014, and the least - 7 in 2011. The data has an increasing trend.
When looking into fire subcategories, the most reports belonged to: Structure Fires (59.5%), and Outside Fires (32.5%).
Fire incident types reported to NFIRS in Zip Code 05051


 Nearest zip codes: 05081, 05040, 05033, 03765, 05069, 05076.


 According to the data from the years 2002 - 2018 the average number of fires per year is 14. The highest number of fires - 26 took place in 2014, and the least - 7 in 2011. The data has an increasing trend.
 When looking into fire subcategories, the most reports belonged to: Structure Fires (59.5%), and Outside Fires (32.5%).