Estimated zip code population in 2022: 1,121 Zip code population in 2010: 1,064 Zip code population in 2000: 1,192
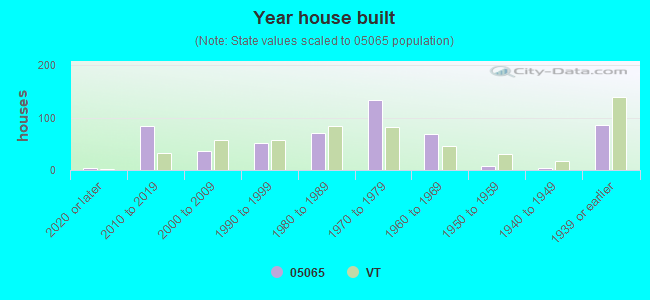
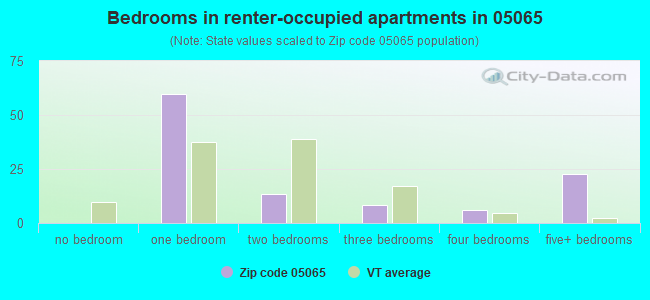
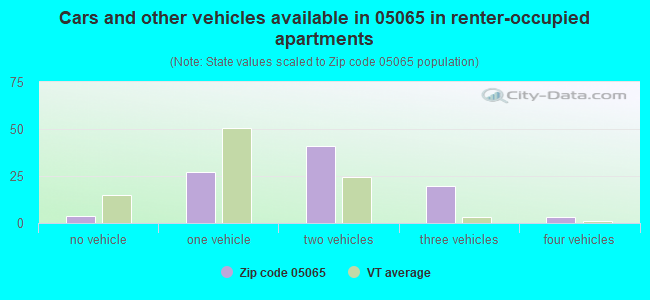
Houses and condos: 538 Renter-occupied apartments: 98
% of renters here:
22%
State:
26%
March 2022 cost of living index in zip code 05065: 92.7 (less than average, U.S. average is 100)
Land area: 32.2 sq. mi. Water area: 0.4 sq. mi.
Population density: 35 people per square mile
(very low).
OSM Map
Google Map
MSN Map
OSM Map
General Map
Google Map
MSN Map
OSM Map
Google Map
MSN Map
OSM Map
Google Map
MSN Map
Please wait while loading the map...
Real estate property taxes paid for housing units in 2022:
This zip code:
1.9% ($5,178)
Vermont:
1.6% ($4,787)
Median real estate property taxes paid for housing units with mortgages in 2022: $5,357 (1.9%) Median real estate property taxes paid for housing units with no mortgage in 2022: $4,965 (1.9%)
Business Search- 14 Million verified businesses
Males: 572
(51.1%)
Females: 548
(48.9%)
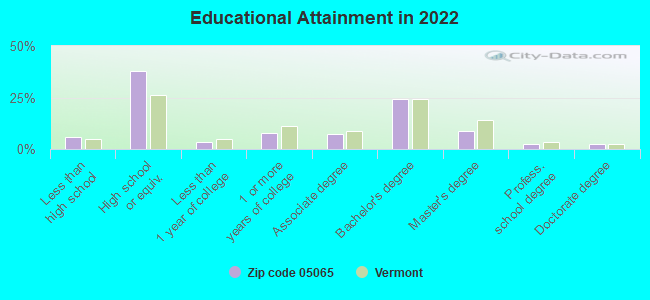
For population 25 years and over in 05065:
High school or higher: 92.4%
Bachelor's degree or higher: 37.3%
Graduate or professional degree: 13.7%
Unemployed: 4.0%
Mean travel time to work (commute): 25.4 minutes
For population 15 years and over in 05065:
Never married: 29.3%
Now married: 53.0%
Separated: 0.0%
Widowed: 4.6%
Divorced: 13.1%
Zip code 05065 compared to state average:
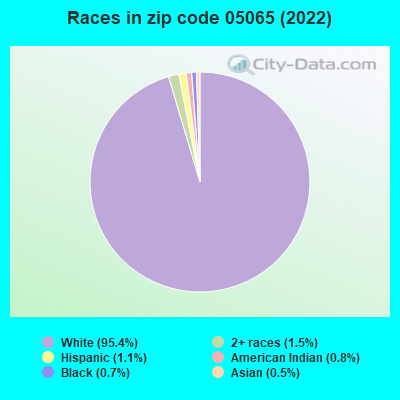
Hispanic race population percentage below state average.
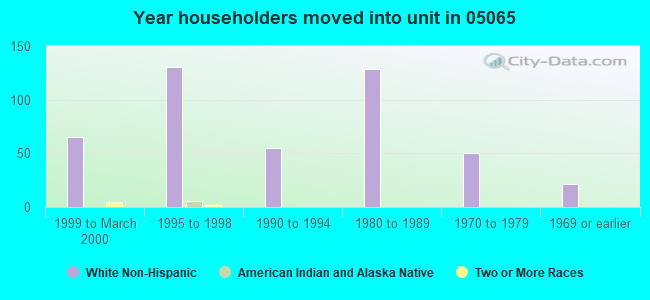
Length of stay since moving in significantly above state average.
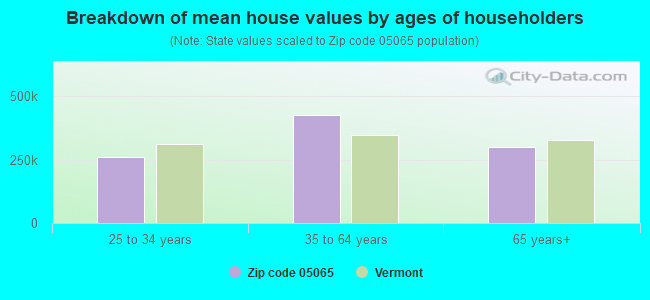
Estimated median house/condo value in 2022: $276,847
05065:
$276,847
Vermont:
$304,700
According to our research of Vermont and other state lists, there were 2 registered sex offenders living in 05065 zip code as of June 16, 2024. The ratio of all residents to sex offenders in zip code 05065 is 544 to 1. The ratio of registered sex offenders to all residents in this zip code is near the state average.
Median resident age:
This zip code:
45.4 years
Vermont median age:
43.2 years
Average household size:
This zip code:
2.5 people
Vermont:
2.2 people
Averages for the 2020 tax year for zip code 05065, filed in 2021:
Average Adjusted Gross Income (AGI) in 2020: $71,944 (Individual Income Tax Returns)
Here:
$71,944
State:
$70,107
Salary/wage: $53,985 (reported on 84.1% of returns)
Here:
$53,985
State:
$56,381
(% of AGI for various income ranges: 1219.2% for AGIs below $25k, 3868.2% for AGIs $25k-50k, 5902.5% for AGIs $50k-75k, 10167.5% for AGIs $75k-100k, 20150.0% for AGIs $100k-200k)
Taxable interest for individuals: $857 (reported on 36.5% of returns)
This zip code:
$857
Vermont:
$1,276
(% of AGI for various income ranges: 7.5% for AGIs below $25k, 19.1% for AGIs $25k-50k, 8.8% for AGIs $50k-75k, 47.5% for AGIs $75k-100k, 201.4% for AGIs $100k-200k)
Ordinary dividends: $8,969 (reported on 20.6% of returns)
Here:
$8,969
State:
$8,930
(% of AGI for various income ranges: 21.7% for AGIs below $25k, 108.2% for AGIs $25k-50k, 85.0% for AGIs $50k-75k, 302.9% for AGIs $100k-200k)
Net capital gain/loss in AGI: +$36,975 (reported on 19.0% of returns)
Here:
+$36,975
State:
+$19,777
(% of AGI for various income ranges: 120.9% for AGIs $25k-50k, 295.0% for AGIs $50k-75k, 495.7% for AGIs $100k-200k)
Profit/loss from business: +$10,291 (reported on 17.5% of returns)
Here:
+$10,291
State:
+$15,467
(% of AGI for various income ranges: 75.8% for AGIs below $25k, 59.1% for AGIs $25k-50k, 257.5% for AGIs $50k-75k, 1100.0% for AGIs $100k-200k)
Taxable individual retirement arrangement distribution: $18,500 (reported on 7.9% of returns)
05065:
$18,500
Vermont:
$17,245
(% of AGI for various income ranges: 119.2% for AGIs below $25k, 977.5% for AGIs $50k-75k)
Total itemized deductions: $28,800 (reported on 4.8% of returns)
Here:
$28,800
State:
$33,390
(% of AGI for various income ranges: 2160.0% for AGIs $75k-100k)
Charity contributions: $17,250 (reported on 3.2% of returns)
Here:
$17,250
State:
$11,950
(% of AGI for various income ranges: 431.2% for AGIs $50k-75k)
Taxes paid: $8,933 (reported on 4.8% of returns)
05065:
$8,933
State:
$8,349
(% of AGI for various income ranges: 670.0% for AGIs $75k-100k)
Earned income credit: $2,071 (reported on 11.1% of returns)
Here:
$2,071
State:
$1,839
(% of AGI for various income ranges: 65.0% for AGIs below $25k, 60.9% for AGIs $25k-50k)
Percentage of individuals using paid preparers for their 2020 taxes: 93.7%
Here:
94%
State:
93%
(% for various income ranges: 88.9% for AGIs below $25k, 100.0% for AGIs $25k-50k, 100.0% for AGIs $50k-75k, 100.0% for AGIs $75k-100k, 90.9% for AGIs $100k-200k, 66.7% for AGIs over 200k)
Averages for the 2012 tax year for zip code 05065, filed in 2013:
Average Adjusted Gross Income (AGI) in 2012: $57,043 (Individual Income Tax Returns)
Here:
$57,043
State:
$55,225
Salary/wage: $46,808 (reported on 84.1% of returns)
Here:
$46,808
State:
$44,925
(% of AGI for various income ranges: 72.8% for AGIs below $25k, 80.1% for AGIs $25k-50k, 81.2% for AGIs $50k-75k, 76.3% for AGIs $75k-100k, 145.5% for AGIs $100k-200k)
Taxable interest for individuals: $673 (reported on 34.9% of returns)
This zip code:
$673
Vermont:
$1,237
(% of AGI for various income ranges: 0.7% for AGIs below $25k, 0.8% for AGIs $25k-50k, 0.3% for AGIs $50k-75k, 0.3% for AGIs $75k-100k, 0.8% for AGIs $100k-200k)
Ordinary dividends: $10,092 (reported on 20.6% of returns)
Here:
$10,092
State:
$7,010
(% of AGI for various income ranges: 8.1% for AGIs below $25k, 1.6% for AGIs $50k-75k, 2.9% for AGIs $75k-100k, 13.8% for AGIs $100k-200k)
Net capital gain/loss in AGI: +$8,388 (reported on 12.7% of returns)
Here:
+$8,388
State:
+$13,197
(% of AGI for various income ranges: 1.3% for AGIs below $25k, 1.9% for AGIs $50k-75k, 8.7% for AGIs $100k-200k)
Profit/loss from business: +$12,091 (reported on 17.5% of returns)
Here:
+$12,091
State:
+$12,941
(% of AGI for various income ranges: 8.4% for AGIs below $25k, 3.4% for AGIs $25k-50k, 4.3% for AGIs $50k-75k, 11.0% for AGIs $75k-100k)
Taxable individual retirement arrangement distribution: $12,083 (reported on 9.5% of returns)
05065:
$12,083
Vermont:
$12,934
Total itemized deductions: $24,644 (19% of AGI, reported on 25.4% of returns)
Here:
$24,644
State:
$22,572
Here:
18.9% of AGI
State:
19.9% of AGI
(% of AGI for various income ranges: 7.1% for AGIs $25k-50k, 10.4% for AGIs $50k-75k, 10.5% for AGIs $75k-100k, 15.0% for AGIs $100k-200k, 15.0% for AGIs over 200k)
Charity contributions: $2,555 (reported on 17.5% of returns)
Here:
$2,555
State:
$3,170
(% of AGI for various income ranges: 0.4% for AGIs $50k-75k, 0.6% for AGIs $75k-100k, 3.8% for AGIs $100k-200k)
Taxes paid: $11,381 (reported on 25.4% of returns)
05065:
$11,381
State:
$10,425
(% of AGI for various income ranges: 2.6% for AGIs $25k-50k, 4.2% for AGIs $50k-75k, 4.9% for AGIs $75k-100k, 8.2% for AGIs $100k-200k, 6.9% for AGIs over 200k)
Earned income credit: $1,900 (reported on 15.9% of returns)
Here:
$1,900
State:
$1,828
(% of AGI for various income ranges: 4.6% for AGIs below $25k, 0.9% for AGIs $25k-50k)
Percentage of individuals using paid preparers for their 2012 taxes: 44.4%
Here:
44%
State:
49%
(% for various income ranges: 43.5% for AGIs below $25k, 41.2% for AGIs $25k-50k, 50.0% for AGIs $50k-75k, 50.0% for AGIs $75k-100k, 60.0% for AGIs $100k-200k)
Averages for the 2004 tax year for zip code 05065, filed in 2005:
Average Adjusted Gross Income (AGI) in 2004: $43,304 (Individual Income Tax Returns)
Here:
$43,304
State:
$44,564
Salary/wage: $37,750 (reported on 85.5% of returns)
Here:
$37,750
State:
$37,522
(% of AGI for various income ranges: 83.8% for AGIs below $10k, 73.7% for AGIs $10k-25k, 82.4% for AGIs $25k-50k, 83.9% for AGIs $50k-75k, 76.0% for AGIs $75k-100k, 61.8% for AGIs over 100k)
Taxable interest for individuals: $669 (reported on 51.9% of returns)
This zip code:
$669
Vermont:
$1,373
(% of AGI for various income ranges: 5.5% for AGIs below $10k, 1.8% for AGIs $10k-25k, 0.9% for AGIs $25k-50k, 0.6% for AGIs $50k-75k, 0.1% for AGIs $75k-100k, 0.5% for AGIs over 100k)
Taxable dividends: $4,936 (reported on 25.0% of returns)
Here:
$4,936
State:
$4,037
(% of AGI for various income ranges: 9.6% for AGIs below $10k, 3.1% for AGIs $10k-25k, 1.1% for AGIs $25k-50k, 0.6% for AGIs $50k-75k, 1.1% for AGIs $75k-100k, 5.9% for AGIs over 100k)
Net capital gain/loss: +$4,076 (reported on 20.9% of returns)
Here:
+$4,076
State:
+$11,311
(% of AGI for various income ranges: -3.6% for AGIs below $10k, 1.1% for AGIs $10k-25k, 0.4% for AGIs $25k-50k, 0.8% for AGIs $50k-75k, -0.0% for AGIs $75k-100k, 5.5% for AGIs over 100k)
Profit/loss from business: +$12,000 (reported on 22.8% of returns)
Here:
+$12,000
State:
+$11,197
(% of AGI for various income ranges: 6.2% for AGIs below $10k, 10.6% for AGIs $10k-25k, 5.8% for AGIs $25k-50k, 7.3% for AGIs $50k-75k, 15.5% for AGIs $75k-100k)
IRA payment deduction: $2,778 (reported on 4.3% of returns)
05065:
$2,778
Vermont:
$3,004
Self-employed pension: $6,700 (reported on 1.6% of returns)
Here:
$6,700
Vermont:
$12,124
Total itemized deductions: $17,230 (20% of AGI, reported on 27.7% of returns)
Here:
$17,230
State:
$17,791
Here:
20.4% of AGI
State:
20.0% of AGI
(% of AGI for various income ranges: 9.7% for AGIs $10k-25k, 7.1% for AGIs $25k-50k, 9.9% for AGIs $50k-75k, 15.2% for AGIs $75k-100k, 13.6% for AGIs over 100k)
Charity contributions deductions: $2,843 (3% of AGI, reported on 20.2% of returns)
Here:
$2,843
State:
$2,686
Here:
2.9% of AGI
State:
2.8% of AGI
(% of AGI for various income ranges: 2.1% for AGIs below $10k, 0.4% for AGIs $25k-50k, 0.8% for AGIs $50k-75k, 1.0% for AGIs $75k-100k, 2.9% for AGIs over 100k)
Total tax: $6,239 (reported on 79.1% of returns)
05065:
$6,239
State:
$6,533
(% of AGI for various income ranges: 3.3% for AGIs below $10k, 5.5% for AGIs $10k-25k, 7.7% for AGIs $25k-50k, 9.1% for AGIs $50k-75k, 11.7% for AGIs $75k-100k, 17.8% for AGIs over 100k)
Earned income credit: $1,623 (reported on 9.7% of returns)
Here:
$1,623
State:
$1,432
Percentage of individuals using paid preparers for their 2004 taxes: 55.4%
Here:
55%
State:
54%
(% for various income ranges: 48.4% for AGIs below $10k, 59.1% for AGIs $10k-25k, 54.7% for AGIs $25k-50k, 53.6% for AGIs $50k-75k, 63.3% for AGIs $75k-100k, 60.9% for AGIs over 100k)
Household received Food Stamps/SNAP in the past 12 months: 39 Household did not receive Food Stamps/SNAP in the past 12 months: 411
Women who had a birth in the past 12 months: 5 (5 now married, 0 unmarried) Women who did not have a birth in the past 12 months: 202 (122 now married, 82 unmarried)
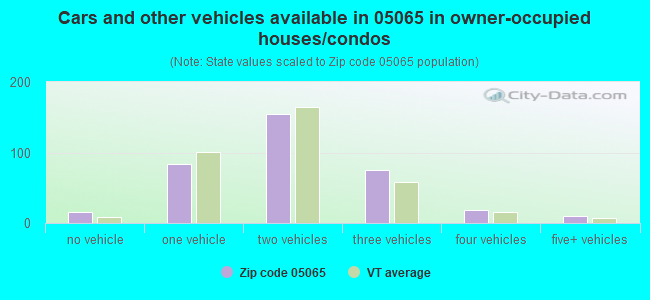
Housing units in zip code 05065 with a mortgage: 190 (15 second mortgage, 3 home equity loan, 6 both second mortgage and home equity loan) Median monthly owner costs for units with a mortgage: $1,534 Median monthly owner costs for units without a mortgage: $683
Residents with income below the poverty level in 2022:
This zip code:
5.9%
Whole state:
10.4%
Residents with income below 50% of the poverty level in 2022:
This zip code:
4.2%
Whole state:
6.1%
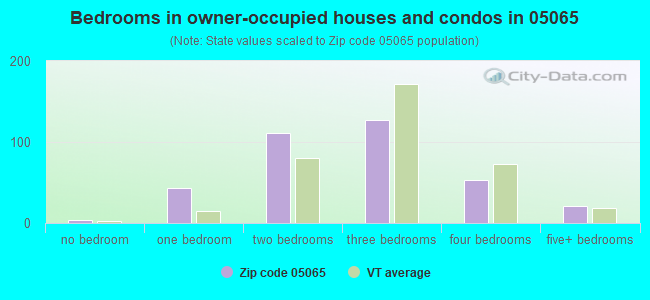
Median number of rooms in houses and condos:
Here:
6.0
State:
6.4
Median number of rooms in apartments:
Here:
4.1
State:
3.9
Notable locations in this zip code not listed on our city pages
Size of family households: 166 2-persons, 61 3-persons, 33 4-persons, 21 5-persons, 13 6-persons
Size of nonfamily households: 108 1-person, 51 2-persons
128 married couples with children.
96 single-parent households (96 women).
95.7% of residents of 05065 zip code speak English at home.
1.0% of residents speak Spanish at home (73% very well, 27% well).
2.1% of residents speak other Indo-European language at home (83% very well, 17% well).
0.5% of residents speak Asian or Pacific Island language at home (100% very well).
0.5% of residents speak other language at home (100% very well).
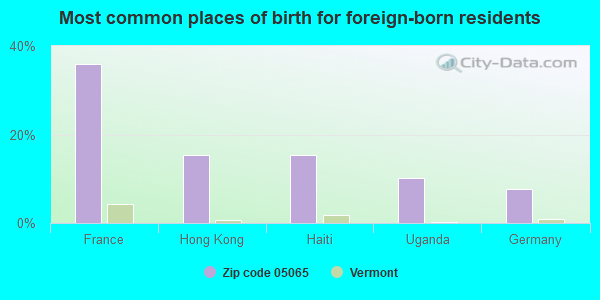
Foreign born population: 38 (3.4%) (69.7% of them are naturalized citizens)
This zip code:
3.4%
Whole state:
4.2%
36%France
15%Hong Kong
15%Haiti
10%Uganda
8%Germany
28%English
18%American
18%German
12%Irish
6%Scottish
3%French Canadian
3%British
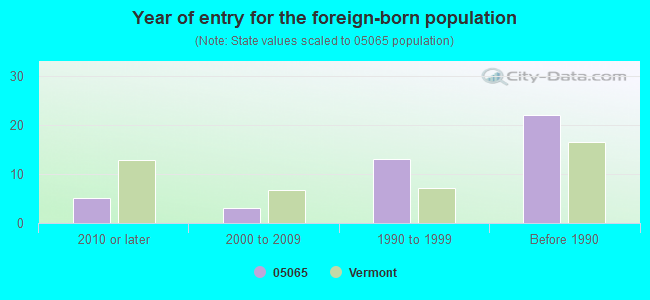
Year of entry for the foreign-born population
52010 or later
32000 to 2009
131990 to 1999
22Before 1990
Facilities with environmental interests located in this zip code:
SHARON ELEMENTARY SCHOOL (ROUTE 132 in SHARON, VT)
(Geographic Names Information System) (National Center for Education Statistics) - STATE ID-PS263
JOES GARAGE (RTE 14 in SHARON, VT)
Conditionally Exempt Small Quantity Generators, less than 100 kg/month of hazardous waste (Resource Conservation and Recovery Act (tracking hazardous waste)) - notification Organizations: ANTHONY DORIA (CONTACT/OWNER)
MILLERS AL AUTO BODY (RTE 14 in SHARON, VT)
Conditionally Exempt Small Quantity Generators, less than 100 kg/month of hazardous waste (Resource Conservation and Recovery Act (tracking hazardous waste)) - notification Organizations: ALFRED MILLER (CONTACT/OWNER)
POTTER D C & SON (FAY BROOK RD in SHARON, VT)
Conditionally Exempt Small Quantity Generators, less than 100 kg/month of hazardous waste (Resource Conservation and Recovery Act (tracking hazardous waste)) - notification Organizations: DAVID C. POTTER (CONTACT/OWNER)
Housing units lacking complete plumbing facilities: 1.8% Housing units lacking complete kitchen facilities: 2.4%
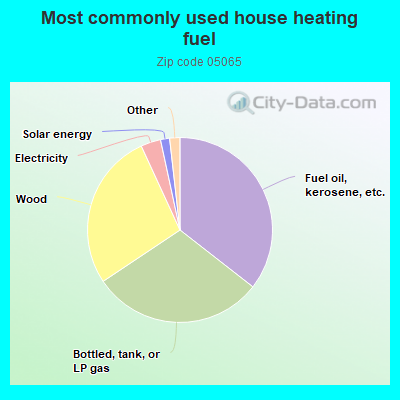
35.7%Fuel oil, kerosene, etc.
30.2%Bottled, tank, or LP gas
27.6%Wood
3.5%Electricity
1.6%Solar energy
0.9%Utility gas
0.9%Other fuel
Population in 1990: 599. Population change in the 1990s: +593 (+99.0%).
Place of birth for U.S.-born residents:
This state: 403
Northeast: 565
Midwest: 55
South: 19
West: 35
61% of the 05065 zip code residents lived in the same house 5 years ago. Out of people who lived in different houses, 52% lived in this county. Out of people who lived in different counties, 50% lived in Vermont.
92% of the 05065 zip code residents lived in the same house 1 year ago. Out of people who lived in different houses, 51% moved from this county. Out of people who lived in different houses, 24% moved from different county within same state. Out of people who lived in different houses, 22% moved from different state.
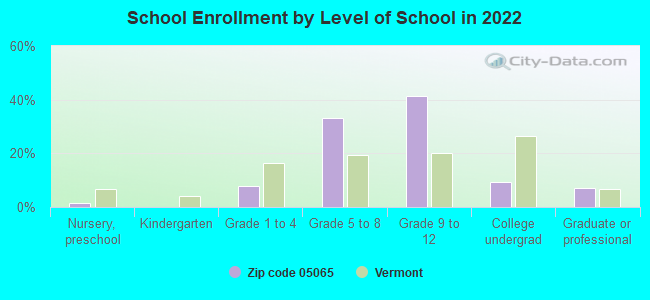
Private vs. public school enrollment:
Students in private schools in grades 1 to 8 (elementary and middle school):
Here:
0.0%
Vermont:
10.3%
Students in private schools in grades 9 to 12 (high school): 12
Here:
10.1%
Vermont:
11.6%
Students in private undergraduate colleges: 11
Here:
40.7%
Vermont:
29.2%
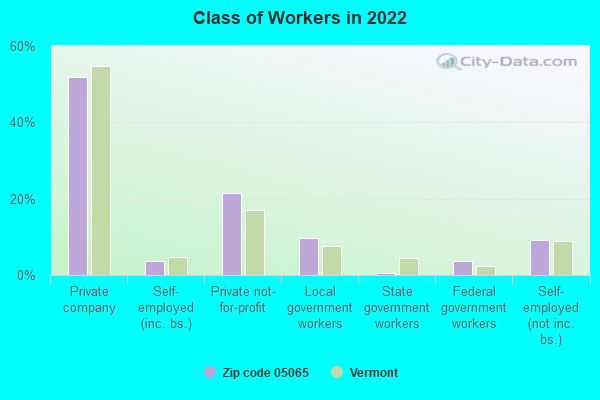
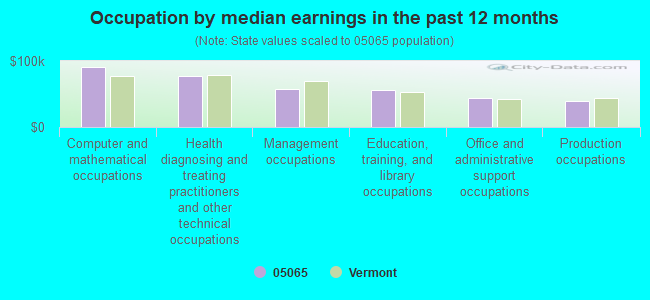
Occupation by median earnings in the past 12 months ($)
90,302Computer and mathematical occupations
77,794Health diagnosing and treating practitioners and other technical occupations
57,156Management occupations
56,400Education, training, and library occupations
43,680Office and administrative support occupations
38,677Production occupations
Top industries in this zip code by the number of employees in 2005:
Educational Services: Elementary and Secondary Schools (20-49 employees: 1 establishment)


 Nearest zip codes: 05084, 05053, 05055, 05070, 05001, 05068.