Estimated zip code population in 2022: 3,270 Zip code population in 2010: 3,183 Zip code population in 2000: 3,219
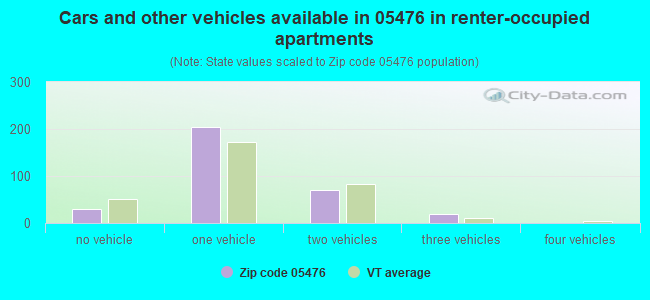
Houses and condos: 1,509 Renter-occupied apartments: 319
% of renters here:
25%
State:
26%
March 2022 cost of living index in zip code 05476: 92.3 (less than average, U.S. average is 100)
Land area: 63.8 sq. mi. Water area: 0.5 sq. mi.
Population density: 51 people per square mile
(very low).
OSM Map
Google Map
MSN Map
OSM Map
General Map
Google Map
MSN Map
OSM Map
Google Map
MSN Map
OSM Map
Google Map
MSN Map
Please wait while loading the map...
Real estate property taxes paid for housing units in 2022:
This zip code:
1.5% ($2,826)
Vermont:
1.6% ($4,787)
Median real estate property taxes paid for housing units with mortgages in 2022: $3,173 (1.5%) Median real estate property taxes paid for housing units with no mortgage in 2022: $2,415 (1.4%)
Business Search- 14 Million verified businesses
Males: 1,686
(51.6%)
Females: 1,583
(48.4%)
For population 25 years and over in 05476:
High school or higher: 85.4%
Bachelor's degree or higher: 18.3%
Graduate or professional degree: 4.7%
Unemployed: 7.5%
Mean travel time to work (commute): 25.9 minutes
For population 15 years and over in 05476:
Never married: 34.7%
Now married: 47.3%
Separated: 0.2%
Widowed: 5.9%
Divorced: 11.8%
Zip code 05476 compared to state average:
Median house value below state average.
Unemployed percentage above state average.
Black race population percentage significantly below state average.
Median age below state average.
Foreign-born population percentage significantly below state average.
Length of stay since moving in above state average.
Percentage of population with a bachelor's degree or higher significantly below state average.
Averages for the 2020 tax year for zip code 05476, filed in 2021:
Average Adjusted Gross Income (AGI) in 2020: $44,361 (Individual Income Tax Returns)
Here:
$44,361
State:
$70,107
Salary/wage: $39,899 (reported on 85.3% of returns)
Here:
$39,899
State:
$56,381
(% of AGI for various income ranges: 1243.3% for AGIs below $25k, 3749.0% for AGIs $25k-50k, 6333.1% for AGIs $50k-75k, 8900.0% for AGIs $75k-100k, 16871.4% for AGIs $100k-200k)
Taxable interest for individuals: $893 (reported on 21.0% of returns)
This zip code:
$893
Vermont:
$1,276
(% of AGI for various income ranges: 10.9% for AGIs below $25k, 28.2% for AGIs $25k-50k, 19.4% for AGIs $50k-75k, 30.0% for AGIs $75k-100k, 91.4% for AGIs $100k-200k)
Ordinary dividends: $908 (reported on 9.1% of returns)
Here:
$908
State:
$8,930
(% of AGI for various income ranges: 19.1% for AGIs below $25k, 2.1% for AGIs $25k-50k, 14.4% for AGIs $50k-75k, 26.7% for AGIs $75k-100k)
Net capital gain/loss in AGI: +$9,690 (reported on 7.0% of returns)
Here:
+$9,690
State:
+$19,777
(% of AGI for various income ranges: 8.5% for AGIs below $25k, 4.6% for AGIs $25k-50k, 121.9% for AGIs $50k-75k, 1040.0% for AGIs $100k-200k)
Profit/loss from business: +$5,705 (reported on 13.3% of returns)
Here:
+$5,705
State:
+$15,467
(% of AGI for various income ranges: 97.0% for AGIs below $25k, 38.2% for AGIs $25k-50k, 157.5% for AGIs $50k-75k, 403.3% for AGIs $75k-100k)
Taxable individual retirement arrangement distribution: $10,800 (reported on 7.0% of returns)
05476:
$10,800
Vermont:
$17,245
(% of AGI for various income ranges: 59.4% for AGIs below $25k, 131.0% for AGIs $25k-50k, 414.4% for AGIs $75k-100k)
Total itemized deductions: $22,000 (reported on 1.4% of returns)
Here:
$22,000
State:
$33,390
(% of AGI for various income ranges: 275.0% for AGIs $50k-75k)
Taxes paid: $8,100 (reported on 1.4% of returns)
05476:
$8,100
State:
$8,349
(% of AGI for various income ranges: 101.2% for AGIs $50k-75k)
Earned income credit: $2,131 (reported on 22.4% of returns)
Here:
$2,131
State:
$1,839
(% of AGI for various income ranges: 123.9% for AGIs below $25k, 70.0% for AGIs $25k-50k)
Percentage of individuals using paid preparers for their 2020 taxes: 93.7%
Here:
94%
State:
93%
(% for various income ranges: 90.2% for AGIs below $25k, 95.7% for AGIs $25k-50k, 95.5% for AGIs $50k-75k, 100.0% for AGIs $75k-100k, 90.9% for AGIs $100k-200k)
Averages for the 2012 tax year for zip code 05476, filed in 2013:
Average Adjusted Gross Income (AGI) in 2012: $36,332 (Individual Income Tax Returns)
Here:
$36,332
State:
$55,225
Salary/wage: $34,255 (reported on 87.5% of returns)
Here:
$34,255
State:
$44,925
(% of AGI for various income ranges: 74.7% for AGIs below $25k, 85.4% for AGIs $25k-50k, 84.0% for AGIs $50k-75k, 83.8% for AGIs $75k-100k, 81.1% for AGIs $100k-200k)
Taxable interest for individuals: $714 (reported on 24.2% of returns)
This zip code:
$714
Vermont:
$1,237
(% of AGI for various income ranges: 1.3% for AGIs below $25k, 0.2% for AGIs $25k-50k, 0.6% for AGIs $50k-75k, 0.1% for AGIs $75k-100k, 0.3% for AGIs $100k-200k)
Ordinary dividends: $1,241 (reported on 14.2% of returns)
Here:
$1,241
State:
$7,010
(% of AGI for various income ranges: 0.9% for AGIs below $25k, 0.3% for AGIs $25k-50k, 0.9% for AGIs $50k-75k, 0.3% for AGIs $75k-100k)
Net capital gain/loss in AGI: +$7,060 (reported on 8.3% of returns)
Here:
+$7,060
State:
+$13,197
(% of AGI for various income ranges: 0.8% for AGIs below $25k, 0.3% for AGIs $50k-75k, 8.7% for AGIs $75k-100k)
Profit/loss from business: +$5,426 (reported on 15.8% of returns)
Here:
+$5,426
State:
+$12,941
(% of AGI for various income ranges: 7.1% for AGIs below $25k, 2.5% for AGIs $25k-50k, 2.9% for AGIs $50k-75k)
Taxable individual retirement arrangement distribution: $6,036 (reported on 9.2% of returns)
05476:
$6,036
Vermont:
$12,934
(% of AGI for various income ranges: 2.9% for AGIs below $25k, 0.9% for AGIs $25k-50k, 3.5% for AGIs $50k-75k)
Total itemized deductions: $15,579 (22% of AGI, reported on 15.8% of returns)
Here:
$15,579
State:
$22,572
Here:
21.8% of AGI
State:
19.9% of AGI
(% of AGI for various income ranges: 6.2% for AGIs $25k-50k, 6.2% for AGIs $50k-75k, 6.9% for AGIs $75k-100k, 14.5% for AGIs $100k-200k)
Charity contributions: $2,100 (reported on 7.5% of returns)
Here:
$2,100
State:
$3,170
Taxes paid: $6,042 (reported on 15.8% of returns)
05476:
$6,042
State:
$10,425
(% of AGI for various income ranges: 1.7% for AGIs $25k-50k, 2.3% for AGIs $50k-75k, 2.9% for AGIs $75k-100k, 6.8% for AGIs $100k-200k)
Earned income credit: $2,245 (reported on 25.8% of returns)
Here:
$2,245
State:
$1,828
(% of AGI for various income ranges: 8.0% for AGIs below $25k, 1.5% for AGIs $25k-50k)
Percentage of individuals using paid preparers for their 2012 taxes: 54.2%
Here:
54%
State:
49%
(% for various income ranges: 50.9% for AGIs below $25k, 52.9% for AGIs $25k-50k, 58.8% for AGIs $50k-75k, 75.0% for AGIs $75k-100k, 50.0% for AGIs $100k-200k)
Averages for the 2004 tax year for zip code 05476, filed in 2005:
Average Adjusted Gross Income (AGI) in 2004: $29,798 (Individual Income Tax Returns)
Here:
$29,798
State:
$44,564
Salary/wage: $28,621 (reported on 85.6% of returns)
Here:
$28,621
State:
$37,522
(% of AGI for various income ranges: 102.0% for AGIs below $10k, 77.1% for AGIs $10k-25k, 85.1% for AGIs $25k-50k, 85.4% for AGIs $50k-75k, 92.6% for AGIs $75k-100k, 51.0% for AGIs over 100k)
Taxable interest for individuals: $913 (reported on 34.7% of returns)
This zip code:
$913
Vermont:
$1,373
(% of AGI for various income ranges: 7.5% for AGIs below $10k, 1.3% for AGIs $10k-25k, 0.7% for AGIs $25k-50k, 0.5% for AGIs $50k-75k, 0.2% for AGIs $75k-100k, 2.9% for AGIs over 100k)
Taxable dividends: $958 (reported on 14.0% of returns)
Here:
$958
State:
$4,037
(% of AGI for various income ranges: 1.7% for AGIs below $10k, 1.1% for AGIs $10k-25k, 0.4% for AGIs $25k-50k, 0.1% for AGIs $50k-75k, 0.0% for AGIs $75k-100k, 0.4% for AGIs over 100k)
Net capital gain/loss: +$4,218 (reported on 11.1% of returns)
Here:
+$4,218
State:
+$11,311
(% of AGI for various income ranges: 4.5% for AGIs below $10k, 0.9% for AGIs $10k-25k, 1.1% for AGIs $25k-50k, 1.1% for AGIs $50k-75k, 7.3% for AGIs over 100k)
Profit/loss from business: +$4,985 (reported on 16.3% of returns)
Here:
+$4,985
State:
+$11,197
(% of AGI for various income ranges: 3.4% for AGIs below $10k, 6.1% for AGIs $10k-25k, 2.7% for AGIs $25k-50k, 2.6% for AGIs $50k-75k, 0.2% for AGIs $75k-100k)
Profit/loss from farming: +$77 (reported on 2.2% of returns)
Here:
+$77
State:
-$1,958
IRA payment deduction: $3,132 (reported on 3.2% of returns)
05476:
$3,132
Vermont:
$3,004
Total itemized deductions: $12,582 (21% of AGI, reported on 13.8% of returns)
Here:
$12,582
State:
$17,791
Here:
21.0% of AGI
State:
20.0% of AGI
(% of AGI for various income ranges: 2.5% for AGIs $10k-25k, 4.5% for AGIs $25k-50k, 6.0% for AGIs $50k-75k, 9.3% for AGIs $75k-100k, 14.5% for AGIs over 100k)
Charity contributions deductions: $1,441 (2% of AGI, reported on 9.9% of returns)
Here:
$1,441
State:
$2,686
Here:
2.3% of AGI
State:
2.8% of AGI
(% of AGI for various income ranges: 0.4% for AGIs $25k-50k, 0.3% for AGIs $50k-75k, 0.5% for AGIs $75k-100k, 2.4% for AGIs over 100k)
Total tax: $3,242 (reported on 71.8% of returns)
05476:
$3,242
State:
$6,533
(% of AGI for various income ranges: 4.4% for AGIs below $10k, 4.3% for AGIs $10k-25k, 6.6% for AGIs $25k-50k, 8.4% for AGIs $50k-75k, 10.8% for AGIs $75k-100k, 15.5% for AGIs over 100k)
Earned income credit: $1,632 (reported on 21.8% of returns)
Here:
$1,632
State:
$1,432
Percentage of individuals using paid preparers for their 2004 taxes: 62.6%
Here:
63%
State:
54%
(% for various income ranges: 54.6% for AGIs below $10k, 60.2% for AGIs $10k-25k, 67.7% for AGIs $25k-50k, 66.9% for AGIs $50k-75k, 68.6% for AGIs $75k-100k, 69.6% for AGIs over 100k)
Household received Food Stamps/SNAP in the past 12 months: 262 Household did not receive Food Stamps/SNAP in the past 12 months: 1,002
Women who had a birth in the past 12 months: 18 (4 now married, 14 unmarried) Women who did not have a birth in the past 12 months: 688 (315 now married, 375 unmarried)
Housing units in zip code 05476 with a mortgage: 518 (68 second mortgage, 1 home equity loan, 61 both second mortgage and home equity loan) Houses without a mortgage: 14
Median monthly owner costs for units with a mortgage: $1,324 Median monthly owner costs for units without a mortgage: $597
Residents with income below the poverty level in 2022:
This zip code:
15.3%
Whole state:
10.4%
Residents with income below 50% of the poverty level in 2022:
This zip code:
11.5%
Whole state:
6.1%
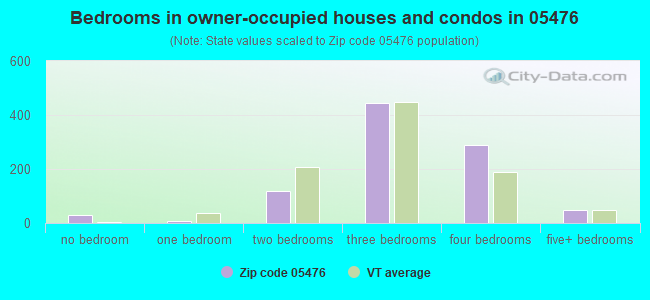
Median number of rooms in houses and condos:
Here:
6.8
State:
6.4
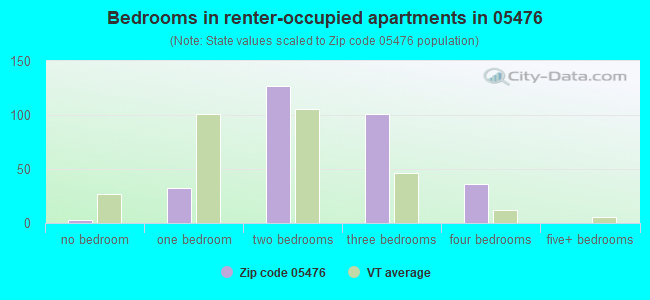
Median number of rooms in apartments:
Here:
5.5
State:
3.9
Notable locations in this zip code not listed on our city pages
Notable locations in zip code 05476: Nutting Corners (A), Richford Country Club (B), Missisquoi Station (C), Richford Country Club (D), Richford Town Hall (E), Arvin A Brown Public Library (F), Richford Fire Department (G). Display/hide their locations on the map
Cemeteries: Troy Street Cemetery (1), South Richford Cemetery (2), Richford Center Cemetery (3), Hillside Cemetery (4), East Richford Cemetery (5), Barnet Monument (6), All Saints Cemetery (7). Display/hide their locations on the map
Streams, rivers, and creeks: Stanhope Brook (A), North Branch Missisquoi River (B), Mountain Brook (C), Lucas Brook (D), Loveland Brook (E), Black Falls Brook (F), Whittaker Brook (G), Trout River (H). Display/hide their locations on the map
In group quarters: 42 (-1 institutionalized population)
Size of family households: 308 2-persons, 212 3-persons, 122 4-persons, 145 5-persons, 9 7-or-more-persons
Size of nonfamily households: 357 1-person, 114 2-persons, 2 3-persons
425 married couples with children.
267 single-parent households (105 men, 162 women).
96.5% of residents of 05476 zip code speak English at home.
2.0% of residents speak Spanish at home (91% very well, 9% well).
1.1% of residents speak other Indo-European language at home (58% very well, 33% well, 9% not well).
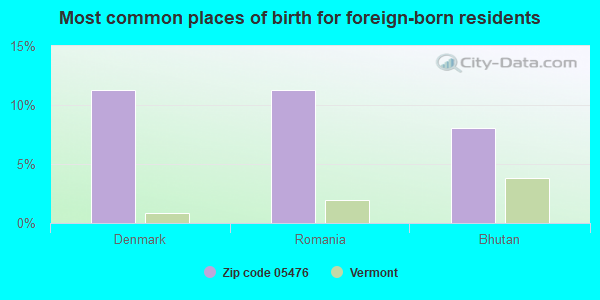
Foreign born population: 61 (1.9%) (79.8% of them are naturalized citizens)
This zip code:
1.9%
Whole state:
4.2%
11%Denmark
11%Romania
8%Bhutan
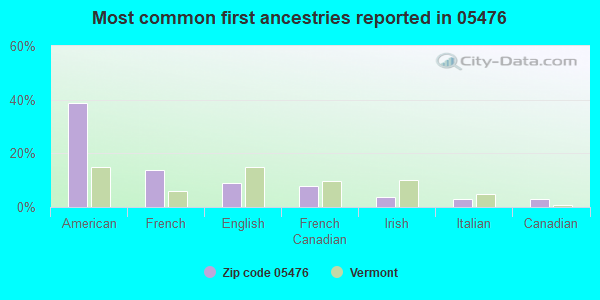
39%American
14%French
9%English
8%French Canadian
4%Irish
3%Italian
3%Canadian
Year of entry for the foreign-born population
42010 or later
222000 to 2009
211990 to 1999
36Before 1990
Major facilities with environmental interests located in this zip code:
BERKSHIRE ELEMENTARY SCHOOL (4850 WATER TOWER ROAD in RICHFORD, VT)
(Geographic Names Information System) (National Center for Education Statistics) - STATE ID-PS032
RICHFORD ELEMENTARY SCHOOL (1 ELEMENTARY SCHOOL ROAD in RICHFORD, VT)
(Geographic Names Information System) (National Center for Education Statistics) - STATE ID-PS241
RICHFORD JR/SR HIGH SCHOOL (1 CORLISS HEIGHTS in RICHFORD, VT)
(National Center for Education Statistics) - STATE ID-PS242
SWEAT-COMINGS CO (30 MAIN STREET in RICHFORD, VT)
AIR MINOR (AIRS/AFS) (Resource Conservation and Recovery Act (tracking hazardous waste)) Business SIC classification: WOOD HOUSEHOLD FURNITURE, EXCEPT UPHOLSTERED Business NAICS classification: NONUPHOLSTERED WOOD HOUSEHOLD FURNITURE MANUFACTURING. Organizations: RICHFORD MAIN STREET MILL DEVELOPMENT (CONTACT/OWNER)
, SWEAT COMINGS CO (CONTACT/OWNER)
S B COLLINS INC PINNACLE PEDDLER (RTE 105 in RICHFORD, VT)
(Resource Conservation and Recovery Act (tracking hazardous waste)) Small Quantity Generators, between 100 kg and 1000 kg of hazardous waste/month (Resource Conservation and Recovery Act (tracking hazardous waste)) - notification Organizations: MAURICE & PAULETTE LEGAULT (CONTACT/OWNER)
KAYTEC INC. (1 JACK NICKSON DR in RICHFORD, VT)
AIR MINOR (AIRS/AFS) Conditionally Exempt Small Quantity Generators, less than 100 kg/month of hazardous waste (Resource Conservation and Recovery Act (tracking hazardous waste)) - notification Business SIC classification: NONCLASSIFIABLE ESTABLISHMENTS Organizations: CANADA INC LIONEL DUBROFSKY (CONTACT/OWNER)
BLUE SEAL FEEDS INCORPORATED (1 WEBSTER STREET in RICHFORD, VT)
USED OIL PROGRAM (Resource Conservation and Recovery Act (tracking hazardous waste)) TRI REPORTER (Tracking of toxic chemicals releasing facilities) Business SIC classification: DOG AND CAT FOOD; PREPARED FEEDS AND FEED INGREDIENTS FOR ANIMALS AND FOWLS, EXCEPT DOGS AND CATS
RICHFORD HEALTH CTR & DENTAL SERVICE (53 MAIN ST in RICHFORD, VT)
Conditionally Exempt Small Quantity Generators, less than 100 kg/month of hazardous waste (Resource Conservation and Recovery Act (tracking hazardous waste)) Organizations: RICHFORD HEALTH CENTER INC (CONTACT/OWNER)
RICHFORD MTP (W W T F ROAD in RICHFORD, VT)
National Pollutant Discharge Elimination System NON-MAJOR (Tracking pollutant discharge elimination systems) - permit Business SIC classification: SEWERAGE SYSTEMS Alternative names: RICHFORD STP
RICHFORD TOWN OF (HARDWOOD HILL RD in RICHFORD, VT)
Small Quantity Generators, between 100 kg and 1000 kg of hazardous waste/month (Resource Conservation and Recovery Act (tracking hazardous waste)) Organizations: GARRY SHOVER (CONTACT/OPERATOR)
, TOWN OF RICHFORD (CONTACT/OWNER)
SOUTH MAIN QUICK STOP (301 S MAIN ST in RICHFORD, VT)
Small Quantity Generators, between 100 kg and 1000 kg of hazardous waste/month (Resource Conservation and Recovery Act (tracking hazardous waste)) Organizations: JOHN WETHERBY (CONTACT/OPERATOR)
W A SANDRI INC (75 MAIN ST in RICHFORD, VT)
Conditionally Exempt Small Quantity Generators, less than 100 kg/month of hazardous waste (Resource Conservation and Recovery Act (tracking hazardous waste)) - notification TRANSPORTER (Resource Conservation and Recovery Act (tracking hazardous waste)) - notification Organizations: CRUMPIN-FOX CLUB INC (CONTACT/OWNER)
CITIZENS UTILITIES RICHFORD (HOME ST in RICHFORD, VT)
Housing units lacking complete plumbing facilities: 2.3% Housing units lacking complete kitchen facilities: 3.3%
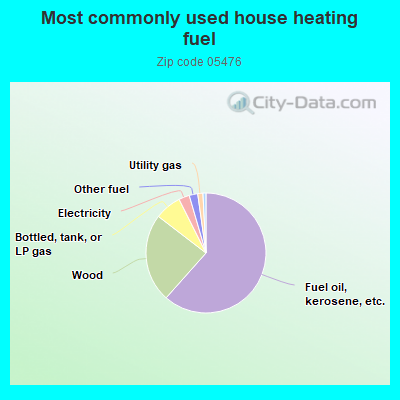
61.7%Fuel oil, kerosene, etc.
23.9%Wood
7.2%Bottled, tank, or LP gas
2.9%Electricity
2.3%Other fuel
1.4%Utility gas
0.8%Solar energy
Population in 1990: 3,794.
Place of birth for U.S.-born residents:
This state: 2,190
Northeast: 501
Midwest: 95
South: 258
West: 110
62% of the 05476 zip code residents lived in the same house 5 years ago. Out of people who lived in different houses, 67% lived in this county. Out of people who lived in different counties, 50% lived in Vermont.
93% of the 05476 zip code residents lived in the same house 1 year ago. Out of people who lived in different houses, 28% moved from this county. Out of people who lived in different houses, 39% moved from different county within same state. Out of people who lived in different houses, 27% moved from different state. Out of people who lived in different houses, 10% moved from abroad.
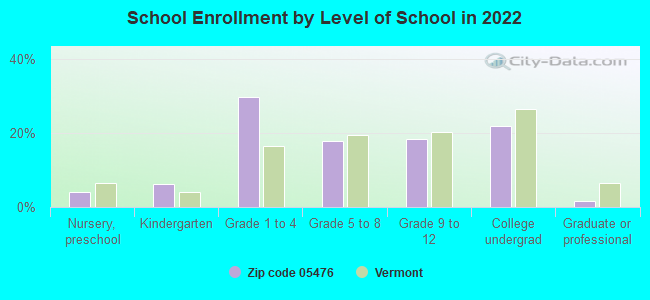
Private vs. public school enrollment:
Students in private schools in grades 1 to 8 (elementary and middle school):
Here:
0.0%
Vermont:
10.3%
Students in private schools in grades 9 to 12 (high school): 17
Here:
12.4%
Vermont:
11.6%
Students in private undergraduate colleges: 35
Here:
20.8%
Vermont:
29.2%
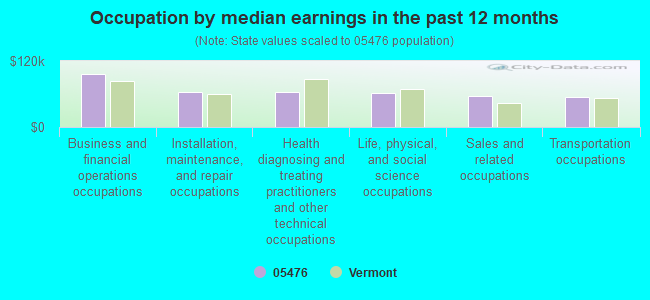
Occupation by median earnings in the past 12 months ($)
96,547Business and financial operations occupations
63,488Installation, maintenance, and repair occupations
63,393Health diagnosing and treating practitioners and other technical occupations
61,967Life, physical, and social science occupations
55,661Sales and related occupations
54,955Transportation occupations
Top industries in this zip code by the number of employees in 2005:
Health Care and Social Assistance: Offices of Physicians (except Mental Health Specialists) (50-99 employees: 1 establishment)
Health Care and Social Assistance: Continuing Care Retirement Communities (50-99: 1)
Accommodation and Food Services: Limited-Service Restaurants (10-19: 1, 1-4: 1)
Health Care and Social Assistance: Child Day Care Services (10-19: 1)
Health Care and Social Assistance: Other Residential Care Facilities (10-19: 1)
Information: Libraries and Archives (5-9: 1)
Other Services (except Public Administration): Civic and Social Organizations (5-9: 1)
People in group quarters in 2010:
73 people in group homes intended for adults
People in group quarters in 2000:
48 people in other noninstitutional group quarters
Fatal accident statistics in 2014:
Fatal accident count: 1
Vehicles involved in fatal accidents: 2
Fatal accidents caused by drunken drivers: 0
Fatalities: 1
Persons involved in fatal accidents: 5
Pedestrians involved in fatal accidents: 0
Fatal accident statistics in 2011:
Fatal accident count: 1
Vehicles involved in fatal accidents: 1
Fatal accidents caused by drunken drivers: 1
Fatalities: 1
Persons involved in fatal accidents: 1
Pedestrians involved in fatal accidents: 0
Home Mortgage Disclosure Act Aggregated Statistics For Year 2009 (Based on 4 partial tracts)
A) FHA, FSA/RHS & VA Home Purchase Loans
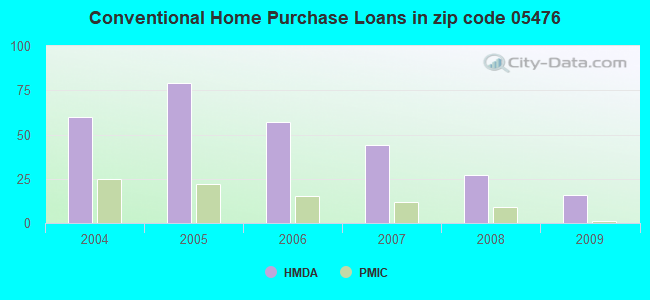
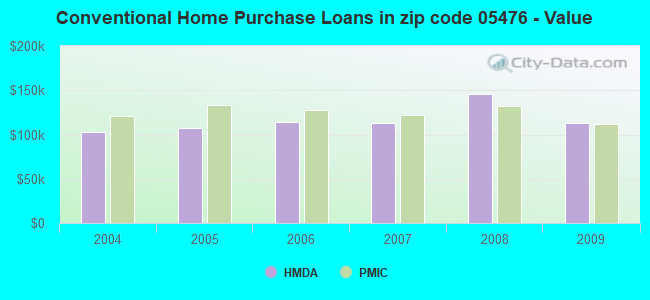
B) Conventional Home Purchase Loans
C) Refinancings
D) Home Improvement Loans
F) Non-occupant Loans on < 5 Family Dwellings (A B C & D)
G) Loans On Manufactured Home Dwelling (A B C & D)
Number
Average Value
Number
Average Value
Number
Average Value
Number
Average Value
Number
Average Value
Number
Average Value
LOANS ORIGINATED
12
$122,652
16
$113,236
100
$127,134
18
$62,754
13
$103,179
10
$67,408
APPLICATIONS APPROVED, NOT ACCEPTED
0
$0
3
$127,183
14
$98,211
1
$21,110
1
$84,550
2
$61,600
APPLICATIONS DENIED
3
$86,303
9
$131,744
44
$127,313
15
$53,441
4
$73,782
5
$105,536
APPLICATIONS WITHDRAWN
2
$149,455
6
$99,422
31
$153,462
0
$0
3
$67,323
2
$101,405
FILES CLOSED FOR INCOMPLETENESS
0
$0
0
$0
8
$106,291
0
$0
2
$90,795
0
$0
Aggregated Statistics For Year 2008 (Based on 4 partial tracts)
A) FHA, FSA/RHS & VA Home Purchase Loans
B) Conventional Home Purchase Loans
C) Refinancings
D) Home Improvement Loans
E) Loans on Dwellings For 5+ Families
F) Non-occupant Loans on < 5 Family Dwellings (A B C & D)
G) Loans On Manufactured Home Dwelling (A B C & D)
Number
Average Value
Number
Average Value
Number
Average Value
Number
Average Value
Number
Average Value
Number
Average Value
Number
Average Value
LOANS ORIGINATED
4
$127,050
27
$145,485
66
$126,982
37
$43,688
1
$77,260
11
$121,602
8
$47,566
APPLICATIONS APPROVED, NOT ACCEPTED
0
$0
3
$93,760
18
$76,226
0
$0
0
$0
1
$78,200
2
$111,090
APPLICATIONS DENIED
2
$121,315
8
$119,254
53
$105,402
13
$47,858
0
$0
0
$0
4
$52,560
APPLICATIONS WITHDRAWN
0
$0
2
$109,765
21
$119,354
3
$92,323
0
$0
2
$86,680
2
$76,790
FILES CLOSED FOR INCOMPLETENESS
0
$0
0
$0
4
$161,020
0
$0
0
$0
1
$292,080
0
$0
Aggregated Statistics For Year 2007 (Based on 4 partial tracts)
A) FHA, FSA/RHS & VA Home Purchase Loans
B) Conventional Home Purchase Loans
C) Refinancings
D) Home Improvement Loans
E) Loans on Dwellings For 5+ Families
F) Non-occupant Loans on < 5 Family Dwellings (A B C & D)
G) Loans On Manufactured Home Dwelling (A B C & D)
Number
Average Value
Number
Average Value
Number
Average Value
Number
Average Value
Number
Average Value
Number
Average Value
Number
Average Value
LOANS ORIGINATED
3
$169,970
44
$112,820
82
$116,567
31
$51,942
1
$183,020
15
$121,900
9
$86,499
APPLICATIONS APPROVED, NOT ACCEPTED
0
$0
11
$105,309
20
$88,092
3
$116,203
0
$0
2
$119,565
4
$89,052
APPLICATIONS DENIED
0
$0
17
$118,542
77
$128,158
11
$41,335
0
$0
4
$49,322
6
$117,238
APPLICATIONS WITHDRAWN
0
$0
4
$140,982
37
$128,995
2
$78,340
0
$0
2
$108,090
0
$0
FILES CLOSED FOR INCOMPLETENESS
0
$0
1
$92,150
7
$123,829
0
$0
0
$0
2
$40,985
1
$39,570
Aggregated Statistics For Year 2006 (Based on 4 partial tracts)
A) FHA, FSA/RHS & VA Home Purchase Loans
B) Conventional Home Purchase Loans
C) Refinancings
D) Home Improvement Loans
E) Loans on Dwellings For 5+ Families
F) Non-occupant Loans on < 5 Family Dwellings (A B C & D)
G) Loans On Manufactured Home Dwelling (A B C & D)
Number
Average Value
Number
Average Value
Number
Average Value
Number
Average Value
Number
Average Value
Number
Average Value
Number
Average Value
LOANS ORIGINATED
1
$140,070
57
$114,313
105
$105,791
39
$45,356
0
$0
17
$128,444
8
$70,386
APPLICATIONS APPROVED, NOT ACCEPTED
0
$0
5
$78,136
22
$94,097
6
$54,877
0
$0
2
$122,955
1
$83,860
APPLICATIONS DENIED
1
$77,910
19
$86,845
91
$109,846
26
$60,673
0
$0
6
$66,428
2
$83,860
APPLICATIONS WITHDRAWN
1
$80,210
7
$126,741
41
$112,439
2
$74,920
1
$195,980
3
$118,403
1
$88,660
FILES CLOSED FOR INCOMPLETENESS
0
$0
0
$0
10
$127,994
1
$154,520
0
$0
1
$117,780
1
$117,780
Aggregated Statistics For Year 2005 (Based on 4 partial tracts)
A) FHA, FSA/RHS & VA Home Purchase Loans
B) Conventional Home Purchase Loans
C) Refinancings
D) Home Improvement Loans
E) Loans on Dwellings For 5+ Families
F) Non-occupant Loans on < 5 Family Dwellings (A B C & D)
G) Loans On Manufactured Home Dwelling (A B C & D)
Number
Average Value
Number
Average Value
Number
Average Value
Number
Average Value
Number
Average Value
Number
Average Value
Number
Average Value
LOANS ORIGINATED
2
$167,080
79
$107,381
119
$99,938
36
$56,947
1
$146,040
20
$101,686
6
$74,220
APPLICATIONS APPROVED, NOT ACCEPTED
0
$0
12
$84,109
17
$97,198
2
$78,115
0
$0
0
$0
0
$0
APPLICATIONS DENIED
0
$0
18
$91,063
76
$97,900
25
$56,519
0
$0
1
$147,470
9
$85,268
APPLICATIONS WITHDRAWN
0
$0
8
$99,358
47
$115,787
4
$139,160
0
$0
2
$73,965
3
$99,767
FILES CLOSED FOR INCOMPLETENESS
0
$0
2
$44,755
14
$105,001
0
$0
0
$0
0
$0
0
$0
Aggregated Statistics For Year 2004 (Based on 4 partial tracts)
A) FHA, FSA/RHS & VA Home Purchase Loans
B) Conventional Home Purchase Loans
C) Refinancings
D) Home Improvement Loans
E) Loans on Dwellings For 5+ Families
F) Non-occupant Loans on < 5 Family Dwellings (A B C & D)
G) Loans On Manufactured Home Dwelling (A B C & D)
Detailed PMIC statistics for the following Tracts:0102.00
, 0103.00
2004 - 2018 National Fire Incident Reporting System (NFIRS) incidents
Based on the data from the years 2004 - 2018 the average number of fire incidents per year is 15. The highest number of fires - 27 took place in 2007, and the least - 0 in 2005. The data has a growing trend.
When looking into fire subcategories, the most reports belonged to: Structure Fires (50.2%), and Outside Fires (28.0%).
Fire incident types reported to NFIRS in Zip Code 05476


+$77
-$1,958
 Nearest zip codes: 05447, 05471, 05450, 05441, 05874, 05442.
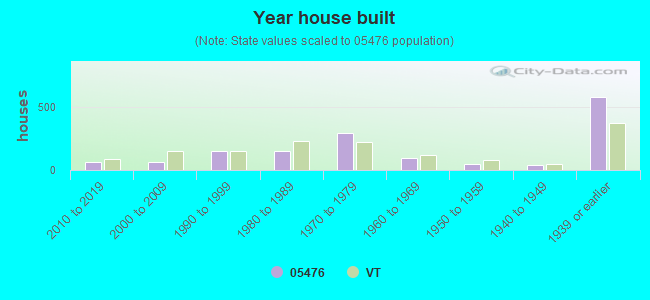


 Based on the data from the years 2004 - 2018 the average number of fire incidents per year is 15. The highest number of fires - 27 took place in 2007, and the least - 0 in 2005. The data has a growing trend.
 When looking into fire subcategories, the most reports belonged to: Structure Fires (50.2%), and Outside Fires (28.0%).