Estimated zip code population in 2022: 1,528 Zip code population in 2010: 1,402 Zip code population in 2000: 1,408
Houses and condos: 639 Renter-occupied apartments: 60
% of renters here:
11%
State:
26%
March 2022 cost of living index in zip code 05658: 94.2 (less than average, U.S. average is 100)
Land area: 37.6 sq. mi. Water area: 1.0 sq. mi.
Population density: 41 people per square mile
(very low).
OSM Map
Google Map
MSN Map
OSM Map
General Map
Google Map
MSN Map
OSM Map
Google Map
MSN Map
OSM Map
Google Map
MSN Map
Please wait while loading the map...
Real estate property taxes paid for housing units in 2022:
This zip code:
1.7% ($4,066)
Vermont:
1.6% ($4,787)
Median real estate property taxes paid for housing units with mortgages in 2022: $4,223 (1.7%) Median real estate property taxes paid for housing units with no mortgage in 2022: $3,858 (1.6%)
Business Search- 14 Million verified businesses
Males: 805
(52.7%)
Females: 722
(47.3%)
For population 25 years and over in 05658:
High school or higher: 89.4%
Bachelor's degree or higher: 43.5%
Graduate or professional degree: 17.1%
Unemployed: 1.3%
Mean travel time to work (commute): 26.4 minutes
For population 15 years and over in 05658:
Never married: 31.5%
Now married: 51.9%
Separated: 0.5%
Widowed: 4.6%
Divorced: 11.5%
Zip code 05658 compared to state average:
Unemployed percentage below state average.
Black race population percentage significantly below state average.
Renting percentage significantly below state average.
Estimated median house/condo value in 2022: $238,816
05658:
$238,816
Vermont:
$304,700
According to our research of Vermont and other state lists, there were 2 registered sex offenders living in 05658 zip code as of June 16, 2024. The ratio of all residents to sex offenders in zip code 05658 is 685 to 1. The ratio of registered sex offenders to all residents in this zip code is lower than the state average.
Median resident age:
This zip code:
41.5 years
Vermont median age:
43.2 years
Average household size:
This zip code:
2.8 people
Vermont:
2.2 people
Averages for the 2020 tax year for zip code 05658, filed in 2021:
Average Adjusted Gross Income (AGI) in 2020: $57,357 (Individual Income Tax Returns)
Here:
$57,357
State:
$70,107
Salary/wage: $48,640 (reported on 78.4% of returns)
Here:
$48,640
State:
$56,381
(% of AGI for various income ranges: 1082.3% for AGIs below $25k, 3995.0% for AGIs $25k-50k, 6482.7% for AGIs $50k-75k, 7798.0% for AGIs $75k-100k, 21960.0% for AGIs $100k-200k)
Taxable interest for individuals: $827 (reported on 35.1% of returns)
This zip code:
$827
Vermont:
$1,276
(% of AGI for various income ranges: 26.9% for AGIs below $25k, 24.2% for AGIs $25k-50k, 16.4% for AGIs $50k-75k, 106.0% for AGIs $75k-100k, 160.0% for AGIs $100k-200k)
Ordinary dividends: $5,400 (reported on 17.6% of returns)
Here:
$5,400
State:
$8,930
(% of AGI for various income ranges: 57.7% for AGIs below $25k, 40.0% for AGIs $25k-50k, 90.0% for AGIs $50k-75k, 306.0% for AGIs $75k-100k, 654.0% for AGIs $100k-200k)
Net capital gain/loss in AGI: +$8,769 (reported on 17.6% of returns)
Here:
+$8,769
State:
+$19,777
(% of AGI for various income ranges: 12.3% for AGIs below $25k, 35.8% for AGIs $25k-50k, 148.2% for AGIs $50k-75k, 1836.0% for AGIs $100k-200k)
Profit/loss from business: +$13,767 (reported on 24.3% of returns)
Here:
+$13,767
State:
+$15,467
(% of AGI for various income ranges: 279.2% for AGIs below $25k, 517.5% for AGIs $25k-50k, 237.3% for AGIs $50k-75k, 1034.0% for AGIs $75k-100k, 1432.0% for AGIs $100k-200k)
Taxable individual retirement arrangement distribution: $9,362 (reported on 10.8% of returns)
05658:
$9,362
Vermont:
$17,245
(% of AGI for various income ranges: 68.5% for AGIs below $25k, 231.7% for AGIs $25k-50k, 764.0% for AGIs $75k-100k)
Total itemized deductions: $30,567 (reported on 4.1% of returns)
Here:
$30,567
State:
$33,390
(% of AGI for various income ranges: 1834.0% for AGIs $75k-100k)
Charity contributions: $8,400 (reported on 2.7% of returns)
Here:
$8,400
State:
$11,950
(% of AGI for various income ranges: 152.7% for AGIs $50k-75k)
Taxes paid: $7,467 (reported on 4.1% of returns)
05658:
$7,467
State:
$8,349
(% of AGI for various income ranges: 448.0% for AGIs $75k-100k)
Earned income credit: $2,025 (reported on 16.2% of returns)
Here:
$2,025
State:
$1,839
(% of AGI for various income ranges: 110.0% for AGIs below $25k, 83.3% for AGIs $25k-50k)
Percentage of individuals using paid preparers for their 2020 taxes: 85.1%
Here:
85%
State:
93%
(% for various income ranges: 82.6% for AGIs below $25k, 83.3% for AGIs $25k-50k, 86.7% for AGIs $50k-75k, 85.7% for AGIs $75k-100k, 90.9% for AGIs $100k-200k)
Averages for the 2012 tax year for zip code 05658, filed in 2013:
Average Adjusted Gross Income (AGI) in 2012: $42,449 (Individual Income Tax Returns)
Here:
$42,449
State:
$55,225
Salary/wage: $37,908 (reported on 73.9% of returns)
Here:
$37,908
State:
$44,925
(% of AGI for various income ranges: 62.5% for AGIs below $25k, 69.7% for AGIs $25k-50k, 75.2% for AGIs $50k-75k, 73.3% for AGIs $75k-100k, 51.5% for AGIs $100k-200k)
Taxable interest for individuals: $667 (reported on 43.5% of returns)
This zip code:
$667
Vermont:
$1,237
(% of AGI for various income ranges: 1.4% for AGIs below $25k, 0.8% for AGIs $25k-50k, 0.4% for AGIs $50k-75k, 0.3% for AGIs $75k-100k, 0.8% for AGIs $100k-200k)
Ordinary dividends: $4,162 (reported on 18.8% of returns)
Here:
$4,162
State:
$7,010
(% of AGI for various income ranges: 0.8% for AGIs below $25k, 2.1% for AGIs $25k-50k, 1.8% for AGIs $50k-75k, 5.3% for AGIs $75k-100k)
Net capital gain/loss in AGI: +$5,238 (reported on 11.6% of returns)
Here:
+$5,238
State:
+$13,197
Profit/loss from business: +$13,016 (reported on 27.5% of returns)
Here:
+$13,016
State:
+$12,941
(% of AGI for various income ranges: 16.2% for AGIs below $25k, 9.2% for AGIs $25k-50k, 6.2% for AGIs $50k-75k, 18.4% for AGIs $75k-100k)
Taxable individual retirement arrangement distribution: $9,000 (reported on 11.6% of returns)
05658:
$9,000
Vermont:
$12,934
(% of AGI for various income ranges: 5.4% for AGIs below $25k, 2.9% for AGIs $25k-50k, 5.0% for AGIs $50k-75k)
Total itemized deductions: $18,300 (24% of AGI, reported on 24.6% of returns)
Here:
$18,300
State:
$22,572
Here:
23.6% of AGI
State:
19.9% of AGI
(% of AGI for various income ranges: 8.1% for AGIs below $25k, 8.9% for AGIs $25k-50k, 10.2% for AGIs $50k-75k, 11.7% for AGIs $75k-100k, 13.1% for AGIs $100k-200k)
Charity contributions: $2,670 (reported on 14.5% of returns)
Here:
$2,670
State:
$3,170
(% of AGI for various income ranges: 1.0% for AGIs $25k-50k, 1.8% for AGIs $50k-75k, 1.0% for AGIs $100k-200k)
Taxes paid: $7,450 (reported on 23.2% of returns)
05658:
$7,450
State:
$10,425
(% of AGI for various income ranges: 2.5% for AGIs below $25k, 2.3% for AGIs $25k-50k, 3.4% for AGIs $50k-75k, 5.1% for AGIs $75k-100k, 6.4% for AGIs $100k-200k)
Earned income credit: $1,936 (reported on 20.3% of returns)
Here:
$1,936
State:
$1,828
(% of AGI for various income ranges: 5.1% for AGIs below $25k, 1.4% for AGIs $25k-50k)
Percentage of individuals using paid preparers for their 2012 taxes: 44.9%
Here:
45%
State:
49%
(% for various income ranges: 39.3% for AGIs below $25k, 45.0% for AGIs $25k-50k, 45.5% for AGIs $50k-75k, 60.0% for AGIs $75k-100k, 60.0% for AGIs $100k-200k)
Averages for the 2004 tax year for zip code 05658, filed in 2005:
Average Adjusted Gross Income (AGI) in 2004: $36,758 (Individual Income Tax Returns)
Here:
$36,758
State:
$44,564
Salary/wage: $31,074 (reported on 81.2% of returns)
Here:
$31,074
State:
$37,522
(% of AGI for various income ranges: 90.3% for AGIs below $10k, 67.1% for AGIs $10k-25k, 82.8% for AGIs $25k-50k, 78.3% for AGIs $50k-75k, 86.4% for AGIs $75k-100k, 30.3% for AGIs over 100k)
Taxable interest for individuals: $1,118 (reported on 53.6% of returns)
This zip code:
$1,118
Vermont:
$1,373
(% of AGI for various income ranges: 4.6% for AGIs below $10k, 1.9% for AGIs $10k-25k, 0.9% for AGIs $25k-50k, 0.7% for AGIs $50k-75k, 0.6% for AGIs $75k-100k, 3.6% for AGIs over 100k)
Taxable dividends: $6,438 (reported on 22.0% of returns)
Here:
$6,438
State:
$4,037
(% of AGI for various income ranges: 3.1% for AGIs below $10k, 1.8% for AGIs $10k-25k, 0.6% for AGIs $25k-50k, 1.4% for AGIs $50k-75k, 13.6% for AGIs over 100k)
Net capital gain/loss: +$10,508 (reported on 18.1% of returns)
Here:
+$10,508
State:
+$11,311
(% of AGI for various income ranges: -2.2% for AGIs below $10k, 0.7% for AGIs $10k-25k, 1.1% for AGIs $25k-50k, 3.2% for AGIs $50k-75k, 17.9% for AGIs over 100k)
Profit/loss from business: +$7,162 (reported on 28.8% of returns)
Here:
+$7,162
State:
+$11,197
(% of AGI for various income ranges: 15.8% for AGIs below $10k, 13.7% for AGIs $10k-25k, 3.3% for AGIs $25k-50k, 9.2% for AGIs $50k-75k, 4.2% for AGIs $75k-100k)
IRA payment deduction: $2,966 (reported on 4.4% of returns)
05658:
$2,966
Vermont:
$3,004
Total itemized deductions: $16,664 (21% of AGI, reported on 19.7% of returns)
Here:
$16,664
State:
$17,791
Here:
20.8% of AGI
State:
20.0% of AGI
(% of AGI for various income ranges: 5.7% for AGIs $10k-25k, 7.0% for AGIs $25k-50k, 9.6% for AGIs $50k-75k, 8.0% for AGIs $75k-100k, 13.7% for AGIs over 100k)
Charity contributions deductions: $2,641 (3% of AGI, reported on 15.5% of returns)
Here:
$2,641
State:
$2,686
Here:
3.1% of AGI
State:
2.8% of AGI
(% of AGI for various income ranges: 1.2% for AGIs $10k-25k, 0.4% for AGIs $25k-50k, 0.7% for AGIs $50k-75k, 0.3% for AGIs $75k-100k, 2.9% for AGIs over 100k)
Total tax: $4,899 (reported on 79.1% of returns)
05658:
$4,899
State:
$6,533
(% of AGI for various income ranges: 5.9% for AGIs below $10k, 5.9% for AGIs $10k-25k, 7.2% for AGIs $25k-50k, 9.7% for AGIs $50k-75k, 10.7% for AGIs $75k-100k, 18.5% for AGIs over 100k)
Earned income credit: $1,598 (reported on 17.6% of returns)
Here:
$1,598
State:
$1,432
Percentage of individuals using paid preparers for their 2004 taxes: 49.1%
Here:
49%
State:
54%
(% for various income ranges: 43.0% for AGIs below $10k, 49.7% for AGIs $10k-25k, 47.2% for AGIs $25k-50k, 54.5% for AGIs $50k-75k, 44.8% for AGIs $75k-100k, 77.8% for AGIs over 100k)
Household received Food Stamps/SNAP in the past 12 months: 70 Household did not receive Food Stamps/SNAP in the past 12 months: 476
Women who had a birth in the past 12 months: 16 (10 now married, 6 unmarried) Women who did not have a birth in the past 12 months: 239 (119 now married, 121 unmarried)
Housing units in zip code 05658 with a mortgage: 266 (18 second mortgage, 14 both second mortgage and home equity loan) Houses without a mortgage: 5
Median monthly owner costs for units with a mortgage: $1,596 Median monthly owner costs for units without a mortgage: $703
Residents with income below the poverty level in 2022:
This zip code:
12.4%
Whole state:
10.4%
Residents with income below 50% of the poverty level in 2022:
This zip code:
6.5%
Whole state:
6.1%
Median number of rooms in houses and condos:
Here:
6.0
State:
6.4
Median number of rooms in apartments:
Here:
5.6
State:
3.9
Notable locations in this zip code not listed on our city pages
Notable locations in zip code 05658: Spooners Trailer Park and Campground (A), Jaquith Public Library (B), Marshfield Fire Department (C). Display/hide their locations on the map
Cemeteries: Eaton Cemetery (1), Wooster Cemetery (2), West Hill Cemetery (3), New Discovery Cemetery (4), South Woodbury Cemetery (5), Hudson Cemetery (6), Pike Cemetery (7). Display/hide their locations on the map
Lakes and reservoirs: Knob Hill Pond (A), Mud Pond (B), Turtlehead Pond (C), Little Mud Pond (D), Mollys Falls Pond (E), Bailey Pond (F). Display/hide their locations on the map
Streams, rivers, and creeks: Mollys Brook (A), Marshfield Brook (B), Beaver Meadow Brook (C), Cold Brook (D), Guernsey Brook (E). Display/hide their locations on the map
Size of family households: 174 2-persons, 89 3-persons, 28 4-persons, 50 5-persons, 25 6-persons, 10 7-or-more-persons
Size of nonfamily households: 141 1-person, 24 2-persons
231 married couples with children.
100 single-parent households (58 men, 42 women).
97.8% of residents of 05658 zip code speak English at home.
1.4% of residents speak Spanish at home (100% very well).
0.3% of residents speak other Indo-European language at home (100% very well).
0.2% of residents speak Asian or Pacific Island language at home (100% very well).
Foreign born population: 54 (3.6%) (98.5% of them are naturalized citizens)
This zip code:
3.6%
Whole state:
4.2%
12%North Macedonia (Macedonia)
12%Bhutan
12%Guyana
4%Malaysia
17%English
15%French Canadian
10%Irish
10%American
8%French
5%European
4%Italian
Year of entry for the foreign-born population
52010 or later
02000 to 2009
41990 to 1999
51Before 1990
Facilities with environmental interests located in this zip code:
WASTEWATER TREATMENT FACILITY (232 SCHOOL STREET in MARSHFIELD, VT)
National Pollutant Discharge Elimination System NON-MAJOR (Tracking pollutant discharge elimination systems) - permit Business SIC classification: SEWERAGE SYSTEMS Alternative names: MARSHFIELD, MARSHFIELD (V), VILLAGE OF MARSHFIELD
CARTER MACHINE (FORMER PATTYS XING in MARSHFIELD, VT)
Conditionally Exempt Small Quantity Generators, less than 100 kg/month of hazardous waste (Resource Conservation and Recovery Act (tracking hazardous waste)) - notification Organizations: GARY CARTER (CONTACT/OWNER)
S B COLLINS CORNER BROOK GENERAL STORE (ROUTE 2 BOX 233 in MARSHFIELD, VT)
Conditionally Exempt Small Quantity Generators, less than 100 kg/month of hazardous waste (Resource Conservation and Recovery Act (tracking hazardous waste)) Organizations: STEPHEN SCRIBNER (CONTACT/OWNER)
VT DEPT OF FORESTS PARKS & RECREATION (VT RTE 232 in MARSHFIELD, VT)
Conditionally Exempt Small Quantity Generators, less than 100 kg/month of hazardous waste (Resource Conservation and Recovery Act (tracking hazardous waste)) - notification
Housing units lacking complete plumbing facilities: 5.0% Housing units lacking complete kitchen facilities: 2.1%
39.5%Wood
39.3%Fuel oil, kerosene, etc.
13.2%Bottled, tank, or LP gas
5.4%Solar energy
2.1%Electricity
1.1%Utility gas
Population in 1990: 1,331. Population change in the 1990s: +77 (+5.8%).
Place of birth for U.S.-born residents:
This state: 753
Northeast: 423
Midwest: 166
South: 102
West: 33
65% of the 05658 zip code residents lived in the same house 5 years ago. Out of people who lived in different houses, 55% lived in this county. Out of people who lived in different counties, 50% lived in Vermont.
94% of the 05658 zip code residents lived in the same house 1 year ago. Out of people who lived in different houses, 41% moved from this county. Out of people who lived in different houses, 54% moved from different county within same state. Out of people who lived in different houses, 3% moved from different state.
Private vs. public school enrollment:
Students in private schools in grades 1 to 8 (elementary and middle school): 41
Here:
24.3%
Vermont:
10.3%
Students in private schools in grades 9 to 12 (high school): 20
Here:
30.1%
Vermont:
11.6%
Students in private undergraduate colleges: 13
Here:
42.5%
Vermont:
29.2%
Occupation by median earnings in the past 12 months ($)
98,898Architecture and engineering occupations
79,331Health diagnosing and treating practitioners and other technical occupations
55,624Education, training, and library occupations
51,927Management occupations
47,530Sales and related occupations
47,260Business and financial operations occupations
Top industries in this zip code by the number of employees in 2005:
Construction: Painting and Wall Covering Contractors (20-49 employees: 1 establishment)
Health Care and Social Assistance: Child Day Care Services (1-4: 2)
Construction: Electrical Contractors (1-4: 2)
Other Services (except Public Administration): Religious Organizations (1-4: 1)
Mining: Dimension Stone Mining and Quarrying (1-4: 1)
Fatal accident statistics in 2012:
Fatal accident count: 3
Vehicles involved in fatal accidents: 4
Fatal accidents caused by drunken drivers: 0
Fatalities: 4
Persons involved in fatal accidents: 7
Pedestrians involved in fatal accidents: 0
Fatal accident statistics in 2011:
Fatal accident count: 1
Vehicles involved in fatal accidents: 2
Fatal accidents caused by drunken drivers: 0
Fatalities: 1
Persons involved in fatal accidents: 2
Pedestrians involved in fatal accidents: 0
2002 - 2017 National Fire Incident Reporting System (NFIRS) incidents
According to the data from the years 2002 - 2017 the average number of fires per year is 7. The highest number of fire incidents - 16 took place in 2009, and the least - 0 in 2010. The data has a declining trend.
When looking into fire subcategories, the most incidents belonged to: Structure Fires (64.9%), and Outside Fires (20.7%).
Fire incident types reported to NFIRS in Zip Code 05658


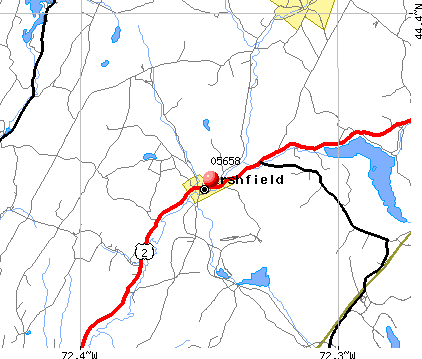 Nearest zip codes: 05650, 05647, 05667, 05681, 05648, 05862.


 According to the data from the years 2002 - 2017 the average number of fires per year is 7. The highest number of fire incidents - 16 took place in 2009, and the least - 0 in 2010. The data has a declining trend.
 When looking into fire subcategories, the most incidents belonged to: Structure Fires (64.9%), and Outside Fires (20.7%).