Estimated zip code population in 2022: 15,790 Zip code population in 2010: 17,267 Zip code population in 2000: 17,553
Houses and condos: 6,187 Renter-occupied apartments: 1,207
% of renters here:
20%
State:
34%
March 2022 cost of living index in zip code 06117: 105.1 (more than average, U.S. average is 100)
Land area: 9.9 sq. mi. Water area: 0.3 sq. mi.
Population density: 1,589 people per square mile
(low).
OSM Map
Google Map
MSN Map
OSM Map
General Map
Google Map
MSN Map
OSM Map
Google Map
MSN Map
OSM Map
Google Map
MSN Map
Please wait while loading the map...
Real estate property taxes paid for housing units in 2022:
This zip code:
2.2% ($9,545)
Connecticut:
1.8% ($6,189)
Median real estate property taxes paid for housing units with mortgages in 2022: $9,482 (2.2%) Median real estate property taxes paid for housing units with no mortgage in 2022: $9,598 (2.3%)
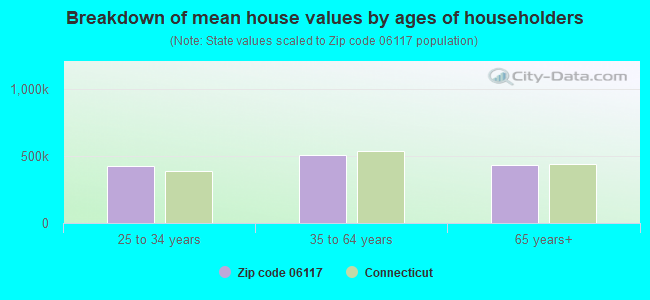
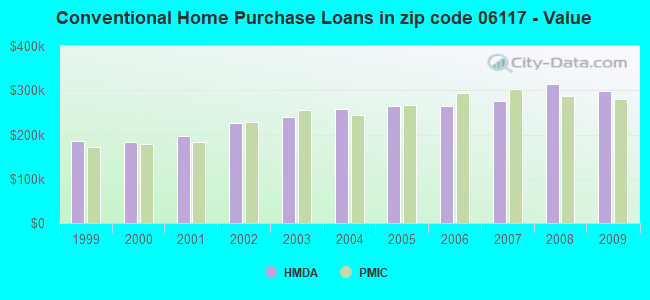
Estimated median house/condo value in 2022: $428,074
06117:
$428,074
Connecticut:
$347,200
According to our research of Connecticut and other state lists, there were 3 registered sex offenders living in 06117 zip code as of June 16, 2024. The ratio of all residents to sex offenders in zip code 06117 is 5,676 to 1. The ratio of registered sex offenders to all residents in this zip code is much lower than the state average.
Median resident age:
This zip code:
45.7 years
Connecticut median age:
40.9 years
Average household size:
This zip code:
2.5 people
Connecticut:
2.5 people
Averages for the 2020 tax year for zip code 06117, filed in 2021:
Average Adjusted Gross Income (AGI) in 2020: $188,449 (Individual Income Tax Returns)
Here:
$188,449
State:
$105,931
Salary/wage: $143,436 (reported on 75.9% of returns)
Here:
$143,436
State:
$83,540
(% of AGI for various income ranges: 1145.9% for AGIs below $25k, 3224.0% for AGIs $25k-50k, 6158.6% for AGIs $50k-75k, 9158.2% for AGIs $75k-100k, 19239.1% for AGIs $100k-200k, 103611.5% for AGIs over 200k)
Taxable interest for individuals: $4,382 (reported on 56.3% of returns)
This zip code:
$4,382
Connecticut:
$3,402
(% of AGI for various income ranges: 50.7% for AGIs below $25k, 76.0% for AGIs $25k-50k, 146.5% for AGIs $50k-75k, 153.2% for AGIs $75k-100k, 293.3% for AGIs $100k-200k, 2571.3% for AGIs over 200k)
Ordinary dividends: $16,071 (reported on 52.0% of returns)
Here:
$16,071
State:
$12,683
(% of AGI for various income ranges: 144.9% for AGIs below $25k, 264.6% for AGIs $25k-50k, 368.0% for AGIs $50k-75k, 663.5% for AGIs $75k-100k, 1115.7% for AGIs $100k-200k, 8561.1% for AGIs over 200k)
Net capital gain/loss in AGI: +$49,146 (reported on 46.5% of returns)
Here:
+$49,146
State:
+$44,158
(% of AGI for various income ranges: 62.4% for AGIs below $25k, 138.1% for AGIs $25k-50k, 232.4% for AGIs $50k-75k, 460.0% for AGIs $75k-100k, 1112.3% for AGIs $100k-200k, 29463.4% for AGIs over 200k)
Profit/loss from business: +$46,024 (reported on 19.4% of returns)
Here:
+$46,024
State:
+$22,988
(% of AGI for various income ranges: 92.6% for AGIs below $25k, 281.9% for AGIs $25k-50k, 297.3% for AGIs $50k-75k, 578.2% for AGIs $75k-100k, 1228.1% for AGIs $100k-200k, 9343.0% for AGIs over 200k)
Taxable individual retirement arrangement distribution: $28,659 (reported on 15.2% of returns)
06117:
$28,659
Connecticut:
$22,031
(% of AGI for various income ranges: 122.0% for AGIs below $25k, 263.7% for AGIs $25k-50k, 397.3% for AGIs $50k-75k, 673.0% for AGIs $75k-100k, 1198.4% for AGIs $100k-200k, 2803.4% for AGIs over 200k)
Self-employed (Keogh) retirement plans: $32,379 (reported on 4.4% of returns)
06117:
$32,379
Connecticut:
$29,016
(% of AGI for various income ranges: 65.5% for AGIs $50k-75k, 134.3% for AGIs $100k-200k, 1735.1% for AGIs over 200k)
Total itemized deductions: $45,216 (reported on 22.0% of returns)
Here:
$45,216
State:
$37,613
(% of AGI for various income ranges: 258.0% for AGIs below $25k, 466.5% for AGIs $25k-50k, 742.2% for AGIs $50k-75k, 1353.0% for AGIs $75k-100k, 1419.0% for AGIs $100k-200k, 9052.8% for AGIs over 200k)
Charity contributions: $13,863 (reported on 19.4% of returns)
Here:
$13,863
State:
$13,557
(% of AGI for various income ranges: 11.2% for AGIs below $25k, 28.1% for AGIs $25k-50k, 58.0% for AGIs $50k-75k, 139.0% for AGIs $75k-100k, 230.9% for AGIs $100k-200k, 3183.6% for AGIs over 200k)
Taxes paid: $9,324 (reported on 22.0% of returns)
06117:
$9,324
State:
$9,096
(% of AGI for various income ranges: 63.2% for AGIs below $25k, 127.2% for AGIs $25k-50k, 211.6% for AGIs $50k-75k, 418.8% for AGIs $75k-100k, 470.6% for AGIs $100k-200k, 1367.4% for AGIs over 200k)
Earned income credit: $1,511 (reported on 3.6% of returns)
Here:
$1,511
State:
$2,059
(% of AGI for various income ranges: 27.6% for AGIs below $25k, 31.9% for AGIs $25k-50k)
Percentage of individuals using paid preparers for their 2020 taxes: 92.5%
Here:
92%
State:
93%
(% for various income ranges: 90.2% for AGIs below $25k, 91.5% for AGIs $25k-50k, 91.0% for AGIs $50k-75k, 91.3% for AGIs $75k-100k, 93.7% for AGIs $100k-200k, 94.9% for AGIs over 200k)
Averages for the 2012 tax year for zip code 06117, filed in 2013:
Average Adjusted Gross Income (AGI) in 2012: $159,234 (Individual Income Tax Returns)
Here:
$159,234
State:
$93,290
Salary/wage: $124,413 (reported on 75.4% of returns)
Here:
$124,413
State:
$73,117
(% of AGI for various income ranges: 59.0% for AGIs below $25k, 59.8% for AGIs $25k-50k, 59.3% for AGIs $50k-75k, 62.9% for AGIs $75k-100k, 69.6% for AGIs $100k-200k, 55.1% for AGIs over 200k)
Taxable interest for individuals: $3,568 (reported on 68.3% of returns)
This zip code:
$3,568
Connecticut:
$2,530
(% of AGI for various income ranges: 3.3% for AGIs below $25k, 2.3% for AGIs $25k-50k, 1.9% for AGIs $50k-75k, 1.6% for AGIs $75k-100k, 1.3% for AGIs $100k-200k, 1.5% for AGIs over 200k)
Ordinary dividends: $16,564 (reported on 55.0% of returns)
Here:
$16,564
State:
$10,909
(% of AGI for various income ranges: 9.5% for AGIs below $25k, 5.2% for AGIs $25k-50k, 6.3% for AGIs $50k-75k, 4.9% for AGIs $75k-100k, 3.4% for AGIs $100k-200k, 6.4% for AGIs over 200k)
Net capital gain/loss in AGI: +$18,861 (reported on 47.0% of returns)
Here:
+$18,861
State:
+$34,090
(% of AGI for various income ranges: 2.3% for AGIs $25k-50k, 0.3% for AGIs $50k-75k, 1.5% for AGIs $75k-100k, 1.8% for AGIs $100k-200k, 7.7% for AGIs over 200k)
Profit/loss from business: +$40,686 (reported on 19.8% of returns)
Here:
+$40,686
State:
+$22,741
(% of AGI for various income ranges: 9.2% for AGIs below $25k, 5.6% for AGIs $25k-50k, 4.2% for AGIs $50k-75k, 4.1% for AGIs $75k-100k, 5.4% for AGIs $100k-200k, 5.0% for AGIs over 200k)
Taxable individual retirement arrangement distribution: $30,084 (reported on 19.4% of returns)
06117:
$30,084
Connecticut:
$19,976
(% of AGI for various income ranges: 7.8% for AGIs below $25k, 5.0% for AGIs $25k-50k, 5.6% for AGIs $50k-75k, 4.9% for AGIs $75k-100k, 4.4% for AGIs $100k-200k, 3.1% for AGIs over 200k)
Self-employment retirement plans: $27,508 (reported on 5.1% of returns)
06117:
$27,508
Connecticut:
$24,004
(% of AGI for various income ranges: 0.7% for AGIs $50k-75k, 0.6% for AGIs $100k-200k, 1.1% for AGIs over 200k)
Total itemized deductions: $43,065 (19% of AGI, reported on 65.0% of returns)
Here:
$43,065
State:
$33,239
Here:
18.7% of AGI
State:
18.9% of AGI
(% of AGI for various income ranges: 33.4% for AGIs below $25k, 25.6% for AGIs $25k-50k, 23.6% for AGIs $50k-75k, 22.8% for AGIs $75k-100k, 19.9% for AGIs $100k-200k, 15.4% for AGIs over 200k)
Charity contributions: $7,561 (reported on 58.6% of returns)
Here:
$7,561
State:
$4,947
(% of AGI for various income ranges: 1.3% for AGIs below $25k, 1.6% for AGIs $25k-50k, 2.0% for AGIs $50k-75k, 2.1% for AGIs $75k-100k, 2.0% for AGIs $100k-200k, 3.2% for AGIs over 200k)
Taxes paid: $23,351 (reported on 65.0% of returns)
06117:
$23,351
State:
$17,397
(% of AGI for various income ranges: 9.2% for AGIs below $25k, 9.7% for AGIs $25k-50k, 10.1% for AGIs $50k-75k, 10.8% for AGIs $75k-100k, 10.8% for AGIs $100k-200k, 9.0% for AGIs over 200k)
Earned income credit: $1,396 (reported on 3.7% of returns)
Here:
$1,396
State:
$2,053
(% of AGI for various income ranges: 1.5% for AGIs below $25k, 0.4% for AGIs $25k-50k)
Percentage of individuals using paid preparers for their 2012 taxes: 60.6%
Here:
61%
State:
55%
(% for various income ranges: 53.6% for AGIs below $25k, 56.2% for AGIs $25k-50k, 58.4% for AGIs $50k-75k, 63.2% for AGIs $75k-100k, 57.9% for AGIs $100k-200k, 76.1% for AGIs over 200k)
Averages for the 2004 tax year for zip code 06117, filed in 2005:
Average Adjusted Gross Income (AGI) in 2004: $132,800 (Individual Income Tax Returns)
Here:
$132,800
State:
$73,265
Salary/wage: $102,616 (reported on 70.4% of returns)
Here:
$102,616
State:
$62,030
(% of AGI for various income ranges: 45.9% for AGIs $10k-25k, 52.3% for AGIs $25k-50k, 58.6% for AGIs $50k-75k, 64.8% for AGIs $75k-100k, 52.8% for AGIs over 100k)
Taxable interest for individuals: $4,457 (reported on 80.3% of returns)
This zip code:
$4,457
Connecticut:
$2,287
(% of AGI for various income ranges: 8.2% for AGIs $10k-25k, 5.6% for AGIs $25k-50k, 4.6% for AGIs $50k-75k, 3.3% for AGIs $75k-100k, 2.2% for AGIs over 100k)
Taxable dividends: $8,930 (reported on 64.4% of returns)
Here:
$8,930
State:
$5,735
(% of AGI for various income ranges: 10.7% for AGIs $10k-25k, 7.2% for AGIs $25k-50k, 6.4% for AGIs $50k-75k, 4.4% for AGIs $75k-100k, 3.8% for AGIs over 100k)
Net capital gain/loss: +$24,045 (reported on 57.0% of returns)
Here:
+$24,045
State:
+$23,694
(% of AGI for various income ranges: 3.1% for AGIs $10k-25k, 2.4% for AGIs $25k-50k, 1.5% for AGIs $50k-75k, 1.9% for AGIs $75k-100k, 12.0% for AGIs over 100k)
Profit/loss from business: +$34,910 (reported on 19.2% of returns)
Here:
+$34,910
State:
+$20,783
(% of AGI for various income ranges: 6.1% for AGIs $10k-25k, 5.0% for AGIs $25k-50k, 4.4% for AGIs $50k-75k, 4.8% for AGIs $75k-100k, 5.1% for AGIs over 100k)
IRA payment deduction: $3,664 (reported on 3.3% of returns)
06117:
$3,664
Connecticut:
$3,216
(% of AGI for various income ranges: 0.4% for AGIs $10k-25k, 0.4% for AGIs $25k-50k, 0.3% for AGIs $50k-75k, 0.2% for AGIs $75k-100k, 0.1% for AGIs over 100k)
Self-employed pension: $21,320 (reported on 5.3% of returns)
Here:
$21,320
Connecticut:
$17,335
(% of AGI for various income ranges: 0.3% for AGIs $25k-50k, 0.2% for AGIs $50k-75k, 0.4% for AGIs $75k-100k, 1.0% for AGIs over 100k)
Total itemized deductions: $32,841 (16% of AGI, reported on 63.0% of returns)
Here:
$32,841
State:
$24,919
Here:
16.4% of AGI
State:
18.6% of AGI
(% of AGI for various income ranges: 33.5% for AGIs $10k-25k, 28.7% for AGIs $25k-50k, 26.5% for AGIs $50k-75k, 23.0% for AGIs $75k-100k, 13.2% for AGIs over 100k)
Charity contributions deductions: $6,795 (3% of AGI, reported on 59.0% of returns)
Here:
$6,795
State:
$3,762
Here:
3.2% of AGI
State:
2.7% of AGI
(% of AGI for various income ranges: 2.6% for AGIs $10k-25k, 3.0% for AGIs $25k-50k, 2.7% for AGIs $50k-75k, 2.7% for AGIs $75k-100k, 3.1% for AGIs over 100k)
Total tax: $33,510 (reported on 81.2% of returns)
06117:
$33,510
State:
$15,148
(% of AGI for various income ranges: 4.4% for AGIs $10k-25k, 7.2% for AGIs $25k-50k, 9.0% for AGIs $50k-75k, 10.2% for AGIs $75k-100k, 22.8% for AGIs over 100k)
Earned income credit: $902 (reported on 2.6% of returns)
Here:
$902
State:
$1,570
Percentage of individuals using paid preparers for their 2004 taxes: 65.0%
Here:
65%
State:
59%
(% for various income ranges: 63.3% for AGIs below $10k, 63.2% for AGIs $10k-25k, 62.0% for AGIs $25k-50k, 63.5% for AGIs $50k-75k, 62.5% for AGIs $75k-100k, 69.2% for AGIs over 100k)
Household received Food Stamps/SNAP in the past 12 months: 299 Household did not receive Food Stamps/SNAP in the past 12 months: 5,638
Women who had a birth in the past 12 months: 189 (182 now married, 0 unmarried) Women who did not have a birth in the past 12 months: 3,070 (1,449 now married, 1,594 unmarried)
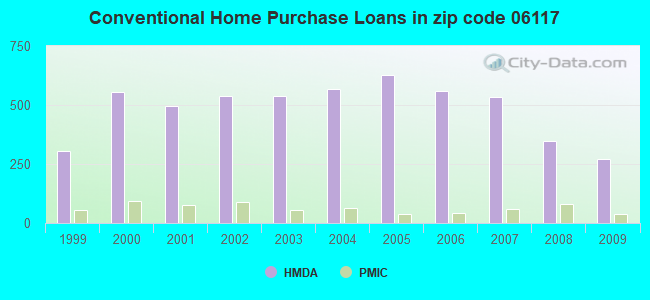
Housing units in zip code 06117 with a mortgage: 2,883 (362 second mortgage, 10 home equity loan, 357 both second mortgage and home equity loan) Houses without a mortgage: 166
Median monthly owner costs for units with a mortgage: $2,791 Median monthly owner costs for units without a mortgage: $1,407
Residents with income below the poverty level in 2022:
This zip code:
1.9%
Whole state:
9.8%
Residents with income below 50% of the poverty level in 2022:
This zip code:
1.2%
Whole state:
4.8%
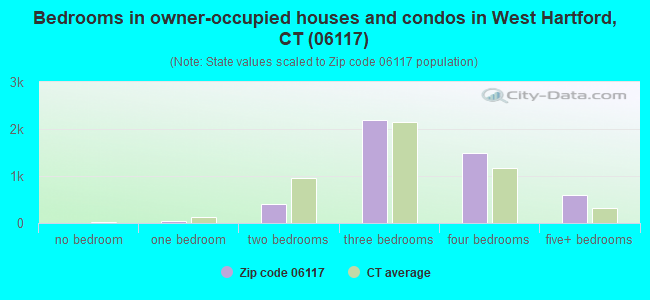
Median number of rooms in houses and condos:
Here:
7.6
State:
6.5
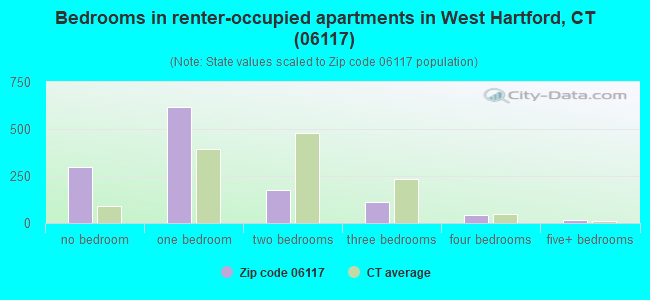
Median number of rooms in apartments:
Here:
2.6
State:
4.0
Notable locations in this zip code not listed on our city pages
Notable locations in zip code 06117: Hartford Country Club (A), Wampanoag Country Club (B), West Hartford Fire Department Station 4 (C), Wilde Auditorium (D), University Libraries (E), University Commons (F), United Technologies Hall (G), The Hartt School (H), Stanley Sculpture Studio (I), South Cottage (J), Pope Pius XII Library (K), Paranov Hall (L), O'Connell Hall (M), Museum of American Political Life (N), Millard Auditorium (O), Lincoln Theater (P), Joseloff Gallery (Q), Hawks Nest (R), Harry Jack Gray Center (S), Emanuel Synagogue Library (T). Display/hide their locations on the map
Shopping Centers: Shops at Bishops Corner Shopping Center (1), Bishops Corner West Shopping Center (2), Crossroads Plaza Shopping Center (3). Display/hide their locations on the map
Churches in zip code 06117 include: Shuvah Yisrael Messianic (A), Beth El Temple (B), Calvary Church (C), Church of Saint Timothy (D), Emanuel Synagogue (E), Young Israel of West Hartford (F), The Church of Jesus Christ of Latter Day Saints (G), Congregation Agudas Achim (H), Flagg Road United Church (I). Display/hide their locations on the map
Lakes and reservoirs: Welles Pond (A), Dyke Pond (B), Talcott Reservoir (C), Bugbee Reservoir (D), Hartford Reservoir Number 2 (E), Hartford Reservoir Number 3 (F), Hartford Reservoir Number 6 (G). Display/hide their locations on the map
Parks in zip code 06117 include: Beach Park (1), Hartford Golf Club Historic District (2), Prospect Avenue Historic District (3), Continental Army Hospital State Monument (4), Eisenhower Park (5), Elizabeth Park (6). Display/hide their locations on the map
In group quarters: 1,089 (-1 institutionalized population)
Size of family households: 1,533 2-persons, 1,004 3-persons, 944 4-persons, 391 5-persons, 89 6-persons
Size of nonfamily households: 1,686 1-person, 243 2-persons, 28 3-persons
2,821 married couples with children.
360 single-parent households (112 men, 248 women).
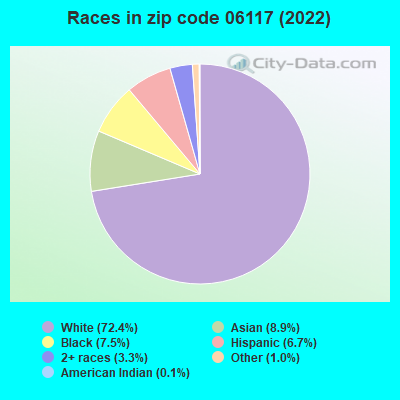
76.4% of residents of 06117 zip code speak English at home.
4.1% of residents speak Spanish at home (75% very well, 15% well, 10% not well).
11.9% of residents speak other Indo-European language at home (80% very well, 15% well, 5% not well).
5.4% of residents speak Asian or Pacific Island language at home (76% very well, 16% well, 4% not well, 4% not at all).
2.4% of residents speak other language at home (95% very well, 3% well, 2% not well).
Foreign born population: 3,472 (22.0%) (69.9% of them are naturalized citizens)
This zip code:
22.0%
Whole state:
15.7%
9%Bhutan
6%Serbia
5%Haiti
5%Romania
4%France
3%North Macedonia (Macedonia)
3%Greece
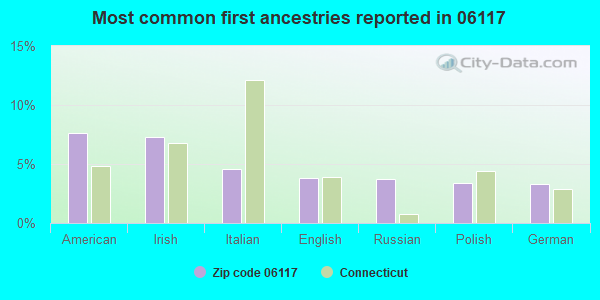
8%American
7%Irish
5%Italian
4%English
4%Russian
3%Polish
3%German
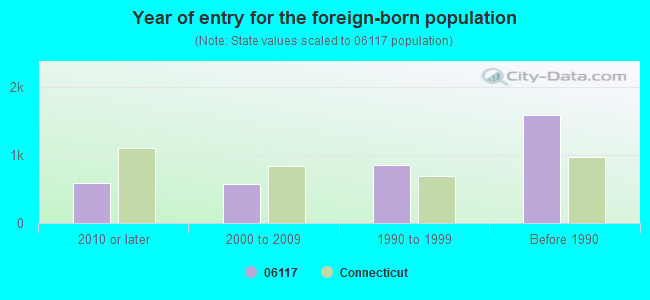
Year of entry for the foreign-born population
5842010 or later
5732000 to 2009
8441990 to 1999
1,584Before 1990
Facilities with environmental interests located in this zip code:
BISHOP CORNER W/ KONOVER MGT (345 N MAIN ST in WEST HARTFORD, CT)
AIR MINOR (AIRS/AFS) (Integrated Compliance Information System) - ICIS-01-2005-8063, ENFORCEMENT/COMPLIANCE ACTIVITY FORMAL ENFORCEMENT ACTION (Integrated Compliance Information System) - ICIS-01-2005-8063, ENFORCEMENT/COMPLIANCE ACTIVITY Business SIC classification: MISCELLANEOUS GENERAL MERCHANDISE STORES Alternative names: BISHOPS CORNER SHOPP
GENGRAS CENTER / SAINT JOSEPH COLLEGE (1678 ASYLUM AVE 1 in WEST HARTFORD, CT)
ENFORCEMENT/COMPLIANCE ACTIVITY (Integrated Compliance Information System) - ICIS-01-2002-0226, FORMAL ENFORCEMENT ACTION (Integrated Compliance Information System) - ICIS-01-2002-0226, FORMAL ENFORCEMENT ACTION COMPLIANCE ACTIVITY (Tracking inspections of insecticide, fungicide, and rodenticide, and toxic substances) Alternative names: THE GENGRAS CENTER, GENGRAS CENTER, THE ST. JOSEPH COLLEGE, ST JOSEPH COLLEGE
AIKEN SCHOOL (212 KING PHILIP DRIVE in WEST HARTFORD, CT)
(Geographic Names Information System) (National Center for Education Statistics) - STATE ID-16 Organizations: WEST HARTFORD SCHOOL DISTRICT (SCHOOL DISTRICT)
BUGBEE SCHOOL (1943 ASYLUM AVE in WEST HARTFORD, CT)
COMPLIANCE ACTIVITY (Tracking inspections of insecticide, fungicide, and rodenticide, and toxic substances) (National Center for Education Statistics) - STATE ID-4 Organizations: WEST HARTFORD SCHOOL DISTRICT (SCHOOL DISTRICT)
HALL HIGH SCHOOL (975 NORTH MAIN STREET in WEST HARTFORD, CT)
(Geographic Names Information System) (National Center for Education Statistics) - STATE ID-62 Organizations: WEST HARTFORD SCHOOL DISTRICT (SCHOOL DISTRICT)
ESQUIRE CLEANERS INC (2538 ALBANY AVE in WEST HARTFORD, CT)
AVON RIDGE SUBDIVISION (AVON RIDGE in WEST HARTFORD, CT)
National Pollutant Discharge Elimination System NON-MAJOR (Tracking pollutant discharge elimination systems) - permit
HEBREW HOME AND HOSPITAL (1 ABRAHAM BLVD in WEST HARTFORD, CT)
COMPLIANCE ACTIVITY (Tracking inspections of insecticide, fungicide, and rodenticide, and toxic substances)
INTENSIVE EDUCATION ACADEMY (840 NORTH MAIN STREET in WEST HARTFORD, CT)
COMPLIANCE ACTIVITY (Tracking inspections of insecticide, fungicide, and rodenticide, and toxic substances) Alternative names: INTENSIVE EDUCATION CENTER
Housing units lacking complete plumbing facilities: 0.1% Housing units lacking complete kitchen facilities: 0.9%
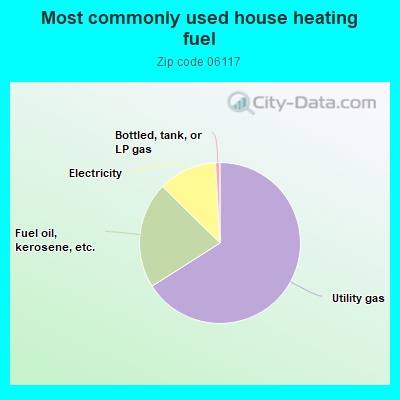
65.8%Utility gas
21.3%Fuel oil, kerosene, etc.
11.7%Electricity
0.9%Bottled, tank, or LP gas
Population in 1990: 14,774. Population change in the 1990s: +2,779 (+18.8%).
Place of birth for U.S.-born residents:
This state: 6,632
Northeast: 3,443
Midwest: 471
South: 898
West: 731
67% of the 06117 zip code residents lived in the same house 5 years ago. Out of people who lived in different houses, 64% lived in this county. Out of people who lived in different counties, 50% lived in Connecticut.
91% of the 06117 zip code residents lived in the same house 1 year ago. Out of people who lived in different houses, 37% moved from this county. Out of people who lived in different houses, 9% moved from different county within same state. Out of people who lived in different houses, 61% moved from different state. Out of people who lived in different houses, 4% moved from abroad.
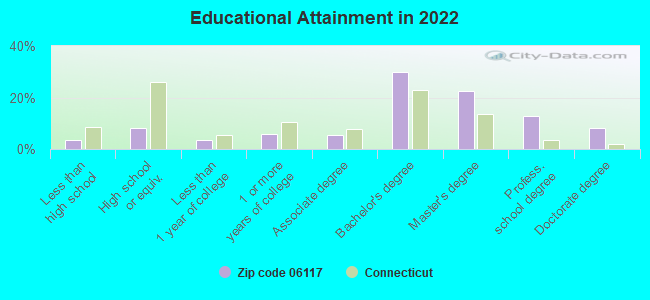
Private vs. public school enrollment:
Students in private schools in grades 1 to 8 (elementary and middle school): 287
Here:
20.4%
Connecticut:
9.5%
Students in private schools in grades 9 to 12 (high school): 131
Here:
12.6%
Connecticut:
12.9%
Students in private undergraduate colleges: 251
Here:
30.0%
Connecticut:
35.5%
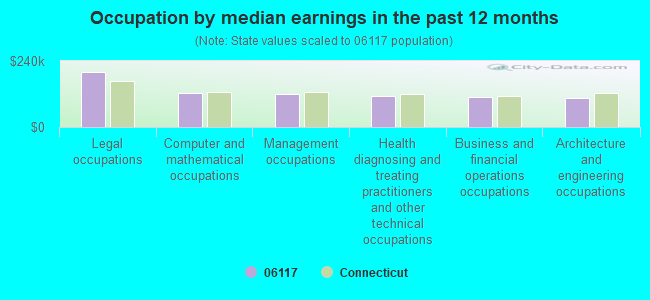
Occupation by median earnings in the past 12 months ($)
199,049Legal occupations
125,356Computer and mathematical occupations
119,968Management occupations
114,162Health diagnosing and treating practitioners and other technical occupations
108,856Business and financial operations occupations
107,012Architecture and engineering occupations
Companies with federal contracts located in this zip code:
CAMPUS YELLOW PAGES LLC (79 HIGH WOOD ROAD in W HARTFORD, CT; small business) : $18,350 in 2 contractsin 2005
$10,250 with Army for Advertising Services. Signed on 2005-05-20. Completion date: 2006-05-30.
$8,100, same as above.Signed on 2005-07-08. Completion date: 2006-05-30.
EXCEL FED SUPPLY INC (13 GOVENORS ROW in W HARTFORD, CT; small business)
$17,514 with Defense Logistics Agency for Miscellaneous Vehicular Components. Signed on 2006-05-23. Completion date: 2006-07-23.
Top industries in this zip code by the number of employees in 2005:
Educational Services: Colleges, Universities, and Professional Schools (over 1000 employees: 1 establishment, 500-999 employees: 1 establishment)
Health Care and Social Assistance: Specialty (except Psychiatric and Substance Abuse) Hospitals (500-999: 1)
Accommodation and Food Services: Food Service Contractors (100-249: 2, 20-49: 4, 10-19: 2, 5-9: 3, 1-4: 1)
Health Care and Social Assistance: Home Health Care Services (250-499: 1, 50-99: 2)
2002 - 2018 National Fire Incident Reporting System (NFIRS) incidents
According to the data from the years 2002 - 2018 the average number of fires per year is 23. The highest number of fires - 42 took place in 2010, and the least - 4 in 2003. The data has a growing trend.
When looking into fire subcategories, the most reports belonged to: Structure Fires (54.4%), and Outside Fires (25.6%).
Fire incident types reported to NFIRS in Zip Code 06117


 Nearest zip codes: 06107, 06119, 06105, 06110, 06002, 06112.
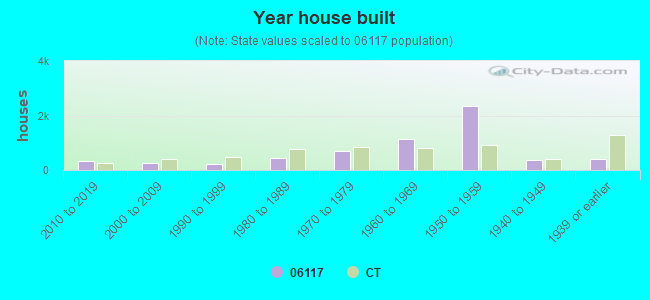


 According to the data from the years 2002 - 2018 the average number of fires per year is 23. The highest number of fires - 42 took place in 2010, and the least - 4 in 2003. The data has a growing trend.
 When looking into fire subcategories, the most reports belonged to: Structure Fires (54.4%), and Outside Fires (25.6%).