Estimated zip code population in 2022: 865 Zip code population in 2010: 857 Zip code population in 2000: 849
Houses and condos: 392 Renter-occupied apartments: 54
% of renters here:
16%
State:
46%
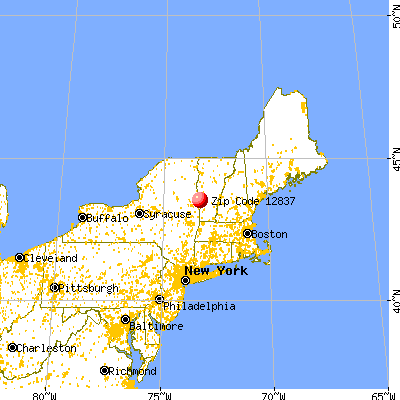
March 2022 cost of living index in zip code 12837: 94.6 (less than average, U.S. average is 100)
Land area: 14.8 sq. mi. Water area: 0.2 sq. mi.
Population density: 58 people per square mile
(very low).
OSM Map
General Map
Google Map
MSN Map
OSM Map
General Map
Google Map
MSN Map
OSM Map
General Map
Google Map
MSN Map
OSM Map
General Map
Google Map
MSN Map
Please wait while loading the map...
Real estate property taxes paid for housing units in 2022:
This zip code:
2.0% ($2,965)
New York:
1.5% ($6,180)
Median real estate property taxes paid for housing units with mortgages in 2022: $3,491 (1.4%) Median real estate property taxes paid for housing units with no mortgage in 2022: $2,479 (1.9%)
Business Search- 14 Million verified businesses
Males: 483
(55.9%)
Females: 381
(44.1%)
For population 25 years and over in 12837:
High school or higher: 86.4%
Bachelor's degree or higher: 16.0%
Graduate or professional degree: 4.5%
Unemployed: 16.6%
Mean travel time to work (commute): 26.4 minutes
For population 15 years and over in 12837:
Never married: 23.8%
Now married: 40.3%
Separated: 0.8%
Widowed: 1.3%
Divorced: 33.7%
Zip code 12837 compared to state average:
Median house value significantly below state average.
Unemployed percentage significantly above state average.
Black race population percentage significantly below state average.
Hispanic race population percentage significantly below state average.
Median age above state average.
Foreign-born population percentage significantly below state average.
Renting percentage significantly below state average.
Length of stay since moving in above state average.
Number of rooms per house above state average.
House age below state average.
Number of college students below state average.
Percentage of population with a bachelor's degree or higher significantly below state average.
Averages for the 2020 tax year for zip code 12837, filed in 2021:
Average Adjusted Gross Income (AGI) in 2020: $54,159 (Individual Income Tax Returns)
Here:
$54,159
State:
$90,930
Salary/wage: $49,010 (reported on 78.4% of returns)
Here:
$49,010
State:
$72,104
(% of AGI for various income ranges: 993.8% for AGIs below $25k, 3728.8% for AGIs $25k-50k, 5804.0% for AGIs $50k-75k, 6477.5% for AGIs $75k-100k, 16473.3% for AGIs $100k-200k)
Taxable interest for individuals: $218 (reported on 29.7% of returns)
This zip code:
$218
New York:
$3,075
(% of AGI for various income ranges: 7.5% for AGIs below $25k, 6.2% for AGIs $25k-50k, 14.0% for AGIs $50k-75k, 20.0% for AGIs $100k-200k)
Ordinary dividends: $875 (reported on 10.8% of returns)
Here:
$875
State:
$11,095
(% of AGI for various income ranges: 70.0% for AGIs $50k-75k)
Net capital gain/loss in AGI: +$1,950 (reported on 5.4% of returns)
Here:
+$1,950
State:
+$44,925
(% of AGI for various income ranges: 48.8% for AGIs below $25k)
Profit/loss from business: +$4,933 (reported on 8.1% of returns)
Here:
+$4,933
State:
+$14,940
(% of AGI for various income ranges: 185.0% for AGIs below $25k)
Taxable individual retirement arrangement distribution: $8,900 (reported on 5.4% of returns)
12837:
$8,900
New York:
$19,609
(% of AGI for various income ranges: 222.5% for AGIs below $25k)
Earned income credit: $2,100 (reported on 16.2% of returns)
Here:
$2,100
State:
$2,138
(% of AGI for various income ranges: 105.0% for AGIs below $25k, 52.5% for AGIs $25k-50k)
Percentage of individuals using paid preparers for their 2020 taxes: 97.3%
Here:
97%
State:
95%
(% for various income ranges: 90.9% for AGIs below $25k, 100.0% for AGIs $25k-50k, 100.0% for AGIs $50k-75k, 100.0% for AGIs $75k-100k, 100.0% for AGIs $100k-200k)
Averages for the 2012 tax year for zip code 12837, filed in 2013:
Average Adjusted Gross Income (AGI) in 2012: $40,389 (Individual Income Tax Returns)
Here:
$40,389
State:
$77,088
Salary/wage: $34,559 (reported on 88.9% of returns)
Here:
$34,559
State:
$60,593
(% of AGI for various income ranges: 67.9% for AGIs below $25k, 76.1% for AGIs $25k-50k, 70.1% for AGIs $50k-75k, 84.7% for AGIs $75k-100k, 78.4% for AGIs $100k-200k)
Taxable interest for individuals: $300 (reported on 30.6% of returns)
This zip code:
$300
New York:
$3,125
(% of AGI for various income ranges: 0.6% for AGIs below $25k, 0.3% for AGIs $50k-75k, 0.3% for AGIs $75k-100k)
Ordinary dividends: $450 (reported on 16.7% of returns)
Here:
$450
State:
$10,299
(% of AGI for various income ranges: 0.5% for AGIs below $25k, 0.5% for AGIs $50k-75k)
Net capital gain/loss in AGI: +$250 (reported on 5.6% of returns)
Here:
+$250
State:
+$42,474
Profit/loss from business: +$8,000 (reported on 11.1% of returns)
Here:
+$8,000
State:
+$16,168
Total itemized deductions: $18,271 (23% of AGI, reported on 19.4% of returns)
Here:
$18,271
State:
$34,985
Here:
22.8% of AGI
State:
21.3% of AGI
(% of AGI for various income ranges: 24.3% for AGIs $50k-75k, 14.5% for AGIs $100k-200k)
Charity contributions: $1,150 (reported on 11.1% of returns)
Here:
$1,150
State:
$5,572
Taxes paid: $7,600 (reported on 19.4% of returns)
12837:
$7,600
State:
$18,656
(% of AGI for various income ranges: 9.7% for AGIs $50k-75k, 6.5% for AGIs $100k-200k)
Earned income credit: $2,343 (reported on 19.4% of returns)
Here:
$2,343
State:
$2,230
(% of AGI for various income ranges: 7.8% for AGIs below $25k)
Percentage of individuals using paid preparers for their 2012 taxes: 61.1%
Here:
61%
State:
66%
(% for various income ranges: 47.1% for AGIs below $25k, 71.4% for AGIs $25k-50k, 80.0% for AGIs $50k-75k, 75.0% for AGIs $75k-100k, 66.7% for AGIs $100k-200k)
Averages for the 2004 tax year for zip code 12837, filed in 2005:
Average Adjusted Gross Income (AGI) in 2004: $35,383 (Individual Income Tax Returns)
Here:
$35,383
State:
$59,519
Salary/wage: $32,149 (reported on 85.8% of returns)
Here:
$32,149
State:
$50,673
(% of AGI for various income ranges: 67.7% for AGIs below $10k, 76.1% for AGIs $10k-25k, 82.4% for AGIs $25k-50k, 81.1% for AGIs $50k-75k, 82.0% for AGIs $75k-100k, 61.6% for AGIs over 100k)
Taxable interest for individuals: $423 (reported on 41.2% of returns)
This zip code:
$423
New York:
$2,377
(% of AGI for various income ranges: 1.6% for AGIs below $10k, 0.5% for AGIs $10k-25k, 0.4% for AGIs $25k-50k, 0.6% for AGIs $50k-75k, 0.4% for AGIs $75k-100k, 0.3% for AGIs over 100k)
Taxable dividends: $743 (reported on 20.3% of returns)
Here:
$743
State:
$5,394
(% of AGI for various income ranges: 3.7% for AGIs below $10k, 0.2% for AGIs $10k-25k, 0.1% for AGIs $25k-50k, 0.3% for AGIs $50k-75k, 1.0% for AGIs $75k-100k)
Profit/loss from business: +$3,077 (reported on 11.3% of returns)
Here:
+$3,077
State:
+$13,809
Total itemized deductions: $13,757 (21% of AGI, reported on 21.4% of returns)
Here:
$13,757
State:
$25,864
Here:
21.2% of AGI
State:
21.9% of AGI
Charity contributions deductions: $1,034 (1% of AGI, reported on 16.8% of returns)
Here:
$1,034
State:
$4,439
Here:
1.4% of AGI
State:
3.6% of AGI
Total tax: $3,928 (reported on 76.2% of returns)
12837:
$3,928
State:
$11,730
(% of AGI for various income ranges: 2.9% for AGIs below $10k, 4.5% for AGIs $10k-25k, 6.6% for AGIs $25k-50k, 8.1% for AGIs $50k-75k, 10.5% for AGIs $75k-100k, 15.4% for AGIs over 100k)
Earned income credit: $1,830 (reported on 13.6% of returns)
Here:
$1,830
State:
$1,757
Percentage of individuals using paid preparers for their 2004 taxes: 66.1%
Here:
66%
State:
67%
(% for various income ranges: 50.0% for AGIs below $10k, 69.2% for AGIs $10k-25k, 68.7% for AGIs $25k-50k, 71.2% for AGIs $50k-75k, 72.0% for AGIs $75k-100k, 84.6% for AGIs over 100k)
Household received Food Stamps/SNAP in the past 12 months: 84 Household did not receive Food Stamps/SNAP in the past 12 months: 263
Women who had a birth in the past 12 months: 2 (0 now married, 2 unmarried) Women who did not have a birth in the past 12 months: 222 (75 now married, 147 unmarried)
Housing units in zip code 12837 with a mortgage: 127 (39 second mortgage, 37 both second mortgage and home equity loan) Houses without a mortgage: 7
Median monthly owner costs for units with a mortgage: $1,567 Median monthly owner costs for units without a mortgage: $463
Residents with income below the poverty level in 2022:
This zip code:
20.1%
Whole state:
14.3%
Residents with income below 50% of the poverty level in 2022:
This zip code:
8.4%
Whole state:
6.8%
Median number of rooms in houses and condos:
Here:
6.0
State:
6.3
Median number of rooms in apartments:
Here:
6.9
State:
3.8
Notable locations in this zip code not listed on our city pages
In group quarters: 12 (-1 institutionalized population)
Size of family households: 85 2-persons, 93 3-persons, 43 4-persons, 8 5-persons
Size of nonfamily households: 97 1-person, 6 2-persons, 5 3-persons
63 married couples with children.
103 single-parent households (38 men, 65 women).
95.6% of residents of 12837 zip code speak English at home.
3.5% of residents speak other Indo-European language at home (3% very well, 83% well, 7% not well, 7% not at all).
0.5% of residents speak other language at home (100% very well).
Foreign born population: 15 (1.8%) (100.0% of them are naturalized citizens)
This zip code:
1.8%
Whole state:
22.7%
71%Sri Lanka
31%English
16%American
12%Scotch-Irish
10%Polish
5%Russian
4%Italian
3%Armenian
Year of entry for the foreign-born population
02010 or later
02000 to 2009
131990 to 1999
3Before 1990
Facilities with environmental interests located in this zip code:
HAMPTON RAIL SIDING (GOLF COURSE RD in HAMPTON, NY)
STATE MASTER (New York facility tracking) - National Pollutant Discharge Elimination System Permit National Pollutant Discharge Elimination System NON-MAJOR (Tracking pollutant discharge elimination systems) - permit Organizations: CLARENDON AND PITTSFORD RAILROAD COMPANY, CLARENDON & PITTSFORD RAILROAD (CONTACT/OWNER)
Alternative names: GOLF COURSE RD
Housing units lacking complete plumbing facilities: 1.9% Housing units lacking complete kitchen facilities: 3.6%
55.9%Fuel oil, kerosene, etc.
22.4%Bottled, tank, or LP gas
13.2%Wood
3.9%Utility gas
3.9%Electricity
0.9%No fuel used
0.6%Other fuel
Population in 1990: 419. Population change in the 1990s: +430 (+102.6%).
Place of birth for U.S.-born residents:
This state: 557
Northeast: 271
South: 15
78% of the 12837 zip code residents lived in the same house 5 years ago. Out of people who lived in different houses, 32% lived in this county. Out of people who lived in different counties, 50% lived in New York.
96% of the 12837 zip code residents lived in the same house 1 year ago. Out of people who lived in different houses, 8% moved from this county. Out of people who lived in different houses, 17% moved from different county within same state. Out of people who lived in different houses, 75% moved from different state.
Private vs. public school enrollment:
Students in private schools in grades 1 to 8 (elementary and middle school): 4
Here:
5.9%
New York:
15.6%
Students in private schools in grades 9 to 12 (high school):
Here:
0.0%
New York:
15.0%
Students in private undergraduate colleges: 10
Here:
39.9%
New York:
39.2%
Occupation by median earnings in the past 12 months ($)
120,420Business and financial operations occupations
81,611Construction and extraction occupations
80,196Education, training, and library occupations
71,126Installation, maintenance, and repair occupations
52,120Sales and related occupations
39,732Production occupations
Top industries in this zip code by the number of employees in 2005:
Mining: Dimension Stone Mining and Quarrying (5-9 employees: 1 establishment)
Construction: Plumbing, Heating, and Air-Conditioning Contractors (1-4: 1)
Accommodation and Food Services: Hotels (except Casino Hotels) and Motels (1-4: 1)
Accommodation and Food Services: Snack and Nonalcoholic Beverage Bars (1-4: 1)
People in group quarters in 2010:
9 people in group homes intended for adults
People in group quarters in 2000:
6 people in homes for the mentally retarded
Home Mortgage Disclosure Act Aggregated Statistics For Year 2009 (Based on 2 partial tracts)
A) FHA, FSA/RHS & VA Home Purchase Loans
B) Conventional Home Purchase Loans
C) Refinancings
D) Home Improvement Loans
F) Non-occupant Loans on < 5 Family Dwellings (A B C & D)
G) Loans On Manufactured Home Dwelling (A B C & D)
Number
Average Value
Number
Average Value
Number
Average Value
Number
Average Value
Number
Average Value
Number
Average Value
LOANS ORIGINATED
7
$107,280
3
$102,830
12
$125,623
4
$52,375
2
$170,505
1
$70,180
APPLICATIONS APPROVED, NOT ACCEPTED
0
$0
1
$93,020
2
$115,760
0
$0
0
$0
1
$71,410
APPLICATIONS DENIED
1
$53,920
1
$135,620
13
$105,291
4
$51,912
2
$65,240
1
$130,890
APPLICATIONS WITHDRAWN
0
$0
0
$0
4
$116,998
0
$0
0
$0
0
$0
FILES CLOSED FOR INCOMPLETENESS
0
$0
0
$0
2
$148,175
0
$0
0
$0
0
$0
Aggregated Statistics For Year 2008 (Based on 2 partial tracts)
A) FHA, FSA/RHS & VA Home Purchase Loans
B) Conventional Home Purchase Loans
C) Refinancings
D) Home Improvement Loans
F) Non-occupant Loans on < 5 Family Dwellings (A B C & D)
G) Loans On Manufactured Home Dwelling (A B C & D)
Number
Average Value
Number
Average Value
Number
Average Value
Number
Average Value
Number
Average Value
Number
Average Value
LOANS ORIGINATED
4
$113,705
5
$113,108
9
$112,756
7
$17,464
2
$70,180
1
$38,690
APPLICATIONS APPROVED, NOT ACCEPTED
0
$0
1
$138,500
2
$136,240
1
$38,070
1
$66,470
1
$72,030
APPLICATIONS DENIED
2
$104,445
4
$88,752
17
$102,549
10
$39,534
1
$72,030
4
$73,212
APPLICATIONS WITHDRAWN
1
$81,700
1
$105,990
8
$124,998
1
$71,620
0
$0
0
$0
FILES CLOSED FOR INCOMPLETENESS
0
$0
1
$216,910
2
$161,760
1
$21,200
1
$43,010
0
$0
Aggregated Statistics For Year 2007 (Based on 2 partial tracts)
A) FHA, FSA/RHS & VA Home Purchase Loans
B) Conventional Home Purchase Loans
C) Refinancings
D) Home Improvement Loans
F) Non-occupant Loans on < 5 Family Dwellings (A B C & D)
G) Loans On Manufactured Home Dwelling (A B C & D)
Number
Average Value
Number
Average Value
Number
Average Value
Number
Average Value
Number
Average Value
Number
Average Value
LOANS ORIGINATED
5
$113,108
9
$108,137
21
$95,648
8
$39,668
3
$91,377
3
$69,560
APPLICATIONS APPROVED, NOT ACCEPTED
0
$0
3
$113,670
4
$120,445
1
$91,580
1
$61,950
1
$98,780
APPLICATIONS DENIED
1
$81,500
6
$100,773
23
$138,566
19
$46,088
1
$88,910
5
$58,324
APPLICATIONS WITHDRAWN
1
$72,030
1
$103,310
12
$105,404
3
$98,167
0
$0
1
$53,710
FILES CLOSED FOR INCOMPLETENESS
0
$0
1
$59,060
2
$105,370
1
$66,880
0
$0
0
$0
Aggregated Statistics For Year 2006 (Based on 2 partial tracts)
A) FHA, FSA/RHS & VA Home Purchase Loans
B) Conventional Home Purchase Loans
C) Refinancings
D) Home Improvement Loans
F) Non-occupant Loans on < 5 Family Dwellings (A B C & D)
G) Loans On Manufactured Home Dwelling (A B C & D)
Number
Average Value
Number
Average Value
Number
Average Value
Number
Average Value
Number
Average Value
Number
Average Value
LOANS ORIGINATED
4
$102,128
13
$89,887
25
$96,314
10
$29,820
5
$81,662
2
$86,230
APPLICATIONS APPROVED, NOT ACCEPTED
0
$0
1
$117,310
6
$94,428
2
$28,090
0
$0
1
$69,150
APPLICATIONS DENIED
0
$0
5
$91,540
31
$97,191
18
$29,807
1
$145,500
5
$43,300
APPLICATIONS WITHDRAWN
0
$0
3
$90,003
17
$104,159
2
$83,660
1
$95,080
1
$60,090
FILES CLOSED FOR INCOMPLETENESS
0
$0
0
$0
6
$121,285
0
$0
0
$0
0
$0
Aggregated Statistics For Year 2005 (Based on 2 partial tracts)
A) FHA, FSA/RHS & VA Home Purchase Loans
B) Conventional Home Purchase Loans
C) Refinancings
D) Home Improvement Loans
F) Non-occupant Loans on < 5 Family Dwellings (A B C & D)
G) Loans On Manufactured Home Dwelling (A B C & D)
Number
Average Value
Number
Average Value
Number
Average Value
Number
Average Value
Number
Average Value
Number
Average Value
LOANS ORIGINATED
4
$112,160
17
$93,942
27
$80,834
10
$54,434
4
$88,598
2
$64,210
APPLICATIONS APPROVED, NOT ACCEPTED
0
$0
2
$51,140
6
$84,858
1
$26,750
1
$27,780
1
$71,820
APPLICATIONS DENIED
0
$0
5
$84,748
25
$76,270
14
$37,014
2
$54,230
3
$71,343
APPLICATIONS WITHDRAWN
0
$0
1
$171,020
15
$87,067
2
$80,160
1
$112,160
1
$86,020
FILES CLOSED FOR INCOMPLETENESS
0
$0
1
$80,260
3
$79,643
0
$0
0
$0
0
$0
Aggregated Statistics For Year 2004 (Based on 2 partial tracts)
A) FHA, FSA/RHS & VA Home Purchase Loans
B) Conventional Home Purchase Loans
C) Refinancings
D) Home Improvement Loans
F) Non-occupant Loans on < 5 Family Dwellings (A B C & D)
G) Loans On Manufactured Home Dwelling (A B C & D)
Number
Average Value
Number
Average Value
Number
Average Value
Number
Average Value
Number
Average Value
Number
Average Value
LOANS ORIGINATED
2
$100,225
18
$93,479
22
$79,673
7
$29,606
3
$90,140
2
$69,355
APPLICATIONS APPROVED, NOT ACCEPTED
0
$0
3
$85,200
5
$75,734
1
$35,190
0
$0
1
$50,630
APPLICATIONS DENIED
1
$125,330
4
$69,972
23
$77,971
7
$22,784
1
$54,950
3
$48,090
APPLICATIONS WITHDRAWN
0
$0
0
$0
12
$81,806
1
$38,900
0
$0
1
$67,090
FILES CLOSED FOR INCOMPLETENESS
0
$0
1
$107,630
2
$81,495
0
$0
0
$0
0
$0
Aggregated Statistics For Year 2003 (Based on 2 partial tracts)
A) FHA, FSA/RHS & VA Home Purchase Loans
B) Conventional Home Purchase Loans
C) Refinancings
D) Home Improvement Loans
F) Non-occupant Loans on < 5 Family Dwellings (A B C & D)
Number
Average Value
Number
Average Value
Number
Average Value
Number
Average Value
Number
Average Value
LOANS ORIGINATED
4
$78,615
12
$75,597
30
$70,260
3
$18,110
3
$78,340
APPLICATIONS APPROVED, NOT ACCEPTED
0
$0
1
$113,400
6
$74,328
1
$26,960
0
$0
APPLICATIONS DENIED
0
$0
3
$82,527
21
$71,628
3
$15,093
1
$77,380
APPLICATIONS WITHDRAWN
1
$69,560
1
$45,480
14
$81,364
1
$14,820
2
$64,725
FILES CLOSED FOR INCOMPLETENESS
0
$0
0
$0
1
$77,380
0
$0
0
$0
Aggregated Statistics For Year 2002 (Based on 2 partial tracts)
A) FHA, FSA/RHS & VA Home Purchase Loans
B) Conventional Home Purchase Loans
C) Refinancings
D) Home Improvement Loans
F) Non-occupant Loans on < 5 Family Dwellings (A B C & D)
Number
Average Value
Number
Average Value
Number
Average Value
Number
Average Value
Number
Average Value
LOANS ORIGINATED
3
$55,290
11
$75,735
19
$69,235
4
$10,032
2
$64,725
APPLICATIONS APPROVED, NOT ACCEPTED
0
$0
1
$58,040
3
$86,847
1
$31,280
0
$0
APPLICATIONS DENIED
0
$0
2
$41,880
19
$69,225
5
$9,178
0
$0
APPLICATIONS WITHDRAWN
0
$0
2
$66,780
10
$65,239
1
$36,220
0
$0
FILES CLOSED FOR INCOMPLETENESS
0
$0
1
$37,460
1
$78,410
0
$0
0
$0
Aggregated Statistics For Year 2001 (Based on 2 partial tracts)
A) FHA, FSA/RHS & VA Home Purchase Loans
B) Conventional Home Purchase Loans
C) Refinancings
D) Home Improvement Loans
F) Non-occupant Loans on < 5 Family Dwellings (A B C & D)
Number
Average Value
Number
Average Value
Number
Average Value
Number
Average Value
Number
Average Value
LOANS ORIGINATED
3
$78,203
8
$71,619
16
$60,724
6
$13,377
1
$71,820
APPLICATIONS APPROVED, NOT ACCEPTED
0
$0
2
$43,320
5
$62,934
1
$18,520
1
$32,310
APPLICATIONS DENIED
0
$0
5
$53,878
17
$65,009
7
$15,700
1
$81,910
APPLICATIONS WITHDRAWN
0
$0
1
$71,620
8
$64,055
2
$15,745
0
$0
FILES CLOSED FOR INCOMPLETENESS
0
$0
0
$0
2
$56,595
0
$0
0
$0
Aggregated Statistics For Year 2000 (Based on 2 partial tracts)
A) FHA, FSA/RHS & VA Home Purchase Loans
B) Conventional Home Purchase Loans
C) Refinancings
D) Home Improvement Loans
F) Non-occupant Loans on < 5 Family Dwellings (A B C & D)
Number
Average Value
Number
Average Value
Number
Average Value
Number
Average Value
Number
Average Value
LOANS ORIGINATED
4
$70,075
8
$76,042
9
$65,628
3
$16,740
2
$80,365
APPLICATIONS APPROVED, NOT ACCEPTED
0
$0
2
$97,860
4
$70,538
2
$20,065
0
$0
APPLICATIONS DENIED
0
$0
9
$49,552
16
$54,498
5
$12,224
3
$74,430
APPLICATIONS WITHDRAWN
1
$56,390
1
$72,240
7
$72,206
1
$29,220
0
$0
FILES CLOSED FOR INCOMPLETENESS
0
$0
1
$56,590
3
$59,887
0
$0
0
$0
Aggregated Statistics For Year 1999 (Based on 2 partial tracts)
A) FHA, FSA/RHS & VA Home Purchase Loans
B) Conventional Home Purchase Loans
C) Refinancings
D) Home Improvement Loans
F) Non-occupant Loans on < 5 Family Dwellings (A B C & D)


 Nearest zip codes: 12849, 05774, 05764, 05775, 12887, 05757.


