Estimated zip code population in 2022: 3,079 Zip code population in 2010: 3,294 Zip code population in 2000: 3,695
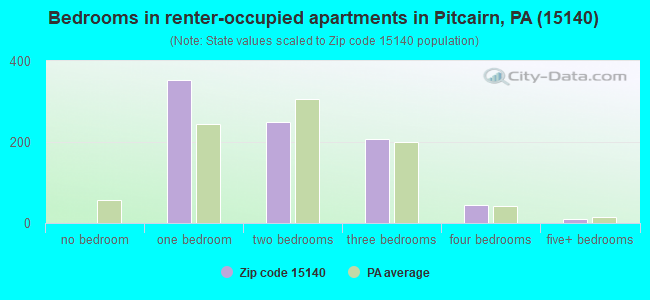
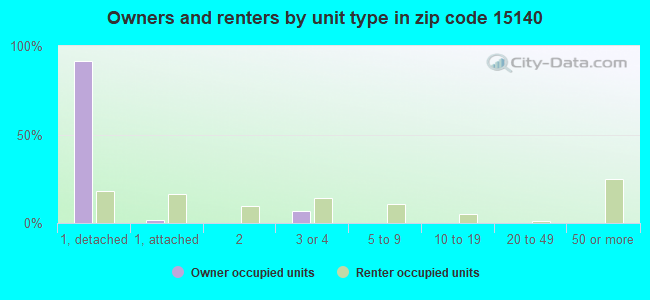
Houses and condos: 1,667 Renter-occupied apartments: 868
% of renters here:
62%
State:
31%
March 2022 cost of living index in zip code 15140: 91.8 (less than average, U.S. average is 100)
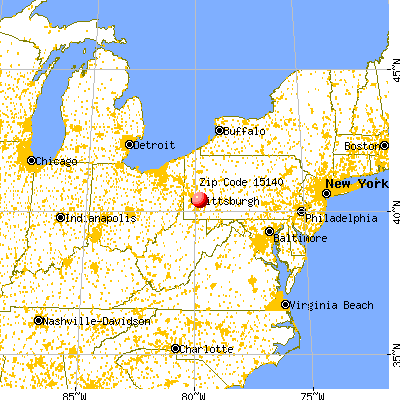
Land area: 0.5 sq. mi. Water area: 0.0 sq. mi.
Population density: 6,096 people per square mile
(high).
OSM Map
General Map
Google Map
MSN Map
OSM Map
General Map
Google Map
MSN Map
OSM Map
General Map
Google Map
MSN Map
OSM Map
General Map
Google Map
MSN Map
Please wait while loading the map...
Real estate property taxes paid for housing units in 2022:
This zip code:
1.5% ($1,071)
Pennsylvania:
1.3% ($3,094)
Median real estate property taxes paid for housing units with mortgages in 2022: $804 (0.9%) Median real estate property taxes paid for housing units with no mortgage in 2022: $1,364 (2.0%)
Business Search- 14 Million verified businesses
Males: 1,481
(48.1%)
Females: 1,598
(51.9%)
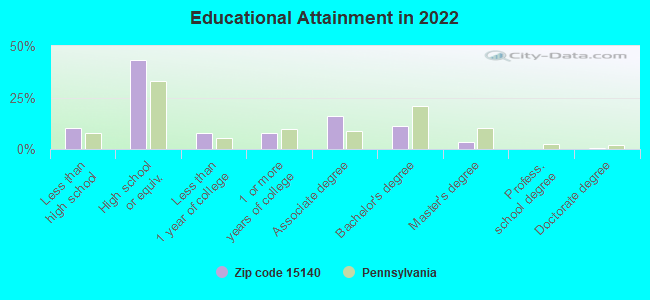
For population 25 years and over in 15140:
High school or higher: 88.8%
Bachelor's degree or higher: 14.6%
Graduate or professional degree: 3.7%
Unemployed: 9.0%
Mean travel time to work (commute): 25.8 minutes
For population 15 years and over in 15140:
Never married: 46.1%
Now married: 32.0%
Separated: 1.2%
Widowed: 10.3%
Divorced: 10.3%
Zip code 15140 compared to state average:
Median household income below state average.
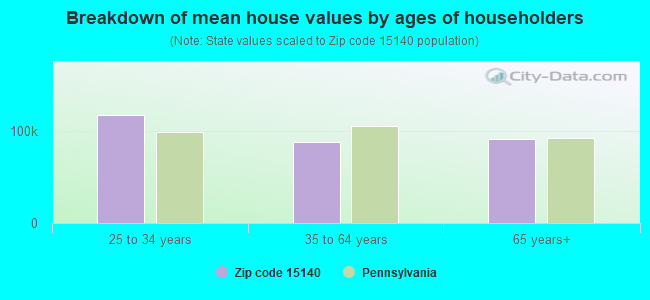
Median house value significantly below state average.
Unemployed percentage above state average.
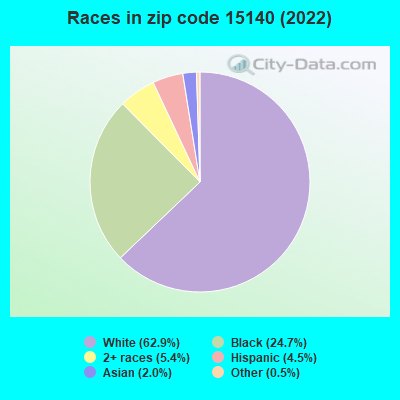
Black race population percentage above state average.
Hispanic race population percentage below state average.
Renting percentage above state average.
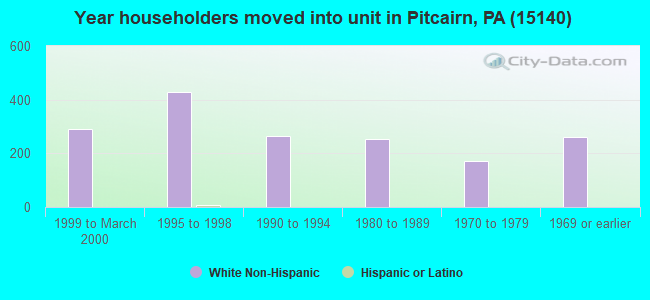
Length of stay since moving in significantly above state average.
Number of rooms per house below state average.
Number of college students below state average.
Percentage of population with a bachelor's degree or higher significantly below state average.
Averages for the 2020 tax year for zip code 15140, filed in 2021:
Average Adjusted Gross Income (AGI) in 2020: $36,001 (Individual Income Tax Returns)
Here:
$36,001
State:
$75,707
Salary/wage: $31,692 (reported on 82.6% of returns)
Here:
$31,692
State:
$62,806
(% of AGI for various income ranges: 1016.0% for AGIs below $25k, 3225.1% for AGIs $25k-50k, 6406.2% for AGIs $50k-75k, 10002.0% for AGIs $75k-100k, 14100.0% for AGIs $100k-200k)
Taxable interest for individuals: $488 (reported on 17.4% of returns)
This zip code:
$488
Pennsylvania:
$1,633
(% of AGI for various income ranges: 6.2% for AGIs below $25k, 3.0% for AGIs $25k-50k, 20.0% for AGIs $50k-75k, 40.0% for AGIs $75k-100k, 82.5% for AGIs $100k-200k)
Ordinary dividends: $1,242 (reported on 8.3% of returns)
Here:
$1,242
State:
$7,382
(% of AGI for various income ranges: 9.2% for AGIs below $25k, 8.8% for AGIs $25k-50k, 134.0% for AGIs $75k-100k)
Net capital gain/loss in AGI: +$3,122 (reported on 6.2% of returns)
Here:
+$3,122
State:
+$23,522
(% of AGI for various income ranges: 5.8% for AGIs below $25k, 7.2% for AGIs $25k-50k, 444.0% for AGIs $75k-100k)
Profit/loss from business: +$4,436 (reported on 9.7% of returns)
Here:
+$4,436
State:
+$16,274
(% of AGI for various income ranges: 42.1% for AGIs below $25k, 63.5% for AGIs $25k-50k, 112.3% for AGIs $50k-75k)
Taxable individual retirement arrangement distribution: $14,590 (reported on 6.9% of returns)
15140:
$14,590
Pennsylvania:
$18,583
(% of AGI for various income ranges: 36.7% for AGIs below $25k, 80.9% for AGIs $25k-50k, 719.2% for AGIs $50k-75k)
Earned income credit: $2,542 (reported on 26.4% of returns)
Here:
$2,542
State:
$2,100
(% of AGI for various income ranges: 122.3% for AGIs below $25k, 88.1% for AGIs $25k-50k)
Percentage of individuals using paid preparers for their 2020 taxes: 91.7%
Here:
92%
State:
92%
(% for various income ranges: 93.3% for AGIs below $25k, 92.2% for AGIs $25k-50k, 88.9% for AGIs $50k-75k, 87.5% for AGIs $75k-100k, 85.7% for AGIs $100k-200k)
Averages for the 2012 tax year for zip code 15140, filed in 2013:
Average Adjusted Gross Income (AGI) in 2012: $30,028 (Individual Income Tax Returns)
Here:
$30,028
State:
$61,346
Salary/wage: $28,991 (reported on 84.5% of returns)
Here:
$28,991
State:
$51,902
(% of AGI for various income ranges: 77.6% for AGIs below $25k, 86.6% for AGIs $25k-50k, 82.3% for AGIs $50k-75k, 81.0% for AGIs $75k-100k, 74.3% for AGIs $100k-200k)
Taxable interest for individuals: $527 (reported on 19.4% of returns)
This zip code:
$527
Pennsylvania:
$1,588
(% of AGI for various income ranges: 0.8% for AGIs below $25k, 0.2% for AGIs $25k-50k, 0.2% for AGIs $50k-75k, 0.3% for AGIs $75k-100k, 0.2% for AGIs $100k-200k)
Ordinary dividends: $1,136 (reported on 9.0% of returns)
Here:
$1,136
State:
$5,827
(% of AGI for various income ranges: 0.8% for AGIs below $25k, 0.2% for AGIs $25k-50k, 0.2% for AGIs $50k-75k, 0.5% for AGIs $75k-100k)
Profit/loss from business: +$5,885 (reported on 8.4% of returns)
Here:
+$5,885
State:
+$16,268
(% of AGI for various income ranges: 4.8% for AGIs below $25k, 1.0% for AGIs $25k-50k, 1.3% for AGIs $50k-75k)
Taxable individual retirement arrangement distribution: $6,400 (reported on 8.4% of returns)
15140:
$6,400
Pennsylvania:
$14,550
(% of AGI for various income ranges: 2.7% for AGIs below $25k, 1.4% for AGIs $25k-50k, 3.3% for AGIs $50k-75k)
Total itemized deductions: $12,421 (22% of AGI, reported on 9.0% of returns)
Here:
$12,421
State:
$23,538
Here:
22.4% of AGI
State:
18.4% of AGI
(% of AGI for various income ranges: 4.2% for AGIs $25k-50k, 4.4% for AGIs $50k-75k, 10.2% for AGIs $75k-100k)
Charity contributions: $2,989 (reported on 5.8% of returns)
Here:
$2,989
State:
$4,025
(% of AGI for various income ranges: 0.4% for AGIs $25k-50k, 0.6% for AGIs $50k-75k, 2.2% for AGIs $75k-100k)
Taxes paid: $4,138 (reported on 8.4% of returns)
15140:
$4,138
State:
$9,982
(% of AGI for various income ranges: 1.2% for AGIs $25k-50k, 1.3% for AGIs $50k-75k, 3.4% for AGIs $75k-100k)
Earned income credit: $2,157 (reported on 27.1% of returns)
Here:
$2,157
State:
$2,106
(% of AGI for various income ranges: 7.2% for AGIs below $25k, 1.1% for AGIs $25k-50k)
Percentage of individuals using paid preparers for their 2012 taxes: 35.5%
Here:
35%
State:
53%
(% for various income ranges: 33.3% for AGIs below $25k, 36.6% for AGIs $25k-50k, 38.9% for AGIs $50k-75k, 37.5% for AGIs $75k-100k, 50.0% for AGIs $100k-200k)
Averages for the 2004 tax year for zip code 15140, filed in 2005:
Average Adjusted Gross Income (AGI) in 2004: $27,097 (Individual Income Tax Returns)
Here:
$27,097
State:
$48,049
Salary/wage: $26,567 (reported on 85.5% of returns)
Here:
$26,567
State:
$42,646
(% of AGI for various income ranges: 87.6% for AGIs below $10k, 79.4% for AGIs $10k-25k, 85.3% for AGIs $25k-50k, 85.1% for AGIs $50k-75k, 85.2% for AGIs $75k-100k, 82.1% for AGIs over 100k)
Taxable interest for individuals: $1,039 (reported on 31.2% of returns)
This zip code:
$1,039
Pennsylvania:
$1,657
(% of AGI for various income ranges: 3.8% for AGIs below $10k, 2.5% for AGIs $10k-25k, 0.8% for AGIs $25k-50k, 0.5% for AGIs $50k-75k, 0.6% for AGIs $75k-100k, 0.5% for AGIs over 100k)
Taxable dividends: $1,089 (reported on 14.9% of returns)
Here:
$1,089
State:
$3,566
(% of AGI for various income ranges: 1.3% for AGIs below $10k, 0.6% for AGIs $10k-25k, 0.7% for AGIs $25k-50k, 0.6% for AGIs $50k-75k, 0.1% for AGIs $75k-100k, 0.4% for AGIs over 100k)
Net capital gain/loss: +$258 (reported on 9.2% of returns)
Here:
+$258
State:
+$9,716
(% of AGI for various income ranges: -0.8% for AGIs below $10k, 0.3% for AGIs $10k-25k, 0.1% for AGIs $25k-50k, 0.1% for AGIs $50k-75k, 0.2% for AGIs $75k-100k)
Profit/loss from business: +$6,331 (reported on 7.7% of returns)
Here:
+$6,331
State:
+$14,267
(% of AGI for various income ranges: 4.9% for AGIs below $10k, 2.5% for AGIs $10k-25k, 1.9% for AGIs $25k-50k, 1.8% for AGIs $50k-75k)
IRA payment deduction: $2,931 (reported on 1.8% of returns)
15140:
$2,931
Pennsylvania:
$2,903
Total itemized deductions: $11,886 (21% of AGI, reported on 10.1% of returns)
Here:
$11,886
State:
$18,804
Here:
21.2% of AGI
State:
19.5% of AGI
(% of AGI for various income ranges: 3.8% for AGIs $10k-25k, 3.5% for AGIs $25k-50k, 5.3% for AGIs $50k-75k, 5.4% for AGIs $75k-100k, 9.5% for AGIs over 100k)
Charity contributions deductions: $1,667 (3% of AGI, reported on 8.4% of returns)
Here:
$1,667
State:
$3,337
Here:
3.0% of AGI
State:
3.3% of AGI
(% of AGI for various income ranges: 0.3% for AGIs $10k-25k, 0.4% for AGIs $25k-50k, 0.6% for AGIs $50k-75k, 0.7% for AGIs $75k-100k, 1.4% for AGIs over 100k)
Total tax: $3,120 (reported on 68.2% of returns)
15140:
$3,120
State:
$8,008
(% of AGI for various income ranges: 1.7% for AGIs below $10k, 4.1% for AGIs $10k-25k, 7.1% for AGIs $25k-50k, 8.9% for AGIs $50k-75k, 11.8% for AGIs $75k-100k, 17.8% for AGIs over 100k)
Earned income credit: $1,621 (reported on 19.4% of returns)
Here:
$1,621
State:
$1,643
Percentage of individuals using paid preparers for their 2004 taxes: 46.7%
Here:
47%
State:
56%
(% for various income ranges: 41.5% for AGIs below $10k, 46.2% for AGIs $10k-25k, 50.8% for AGIs $25k-50k, 48.0% for AGIs $50k-75k, 50.9% for AGIs $75k-100k, 60.0% for AGIs over 100k)
Household received Food Stamps/SNAP in the past 12 months: 514 Household did not receive Food Stamps/SNAP in the past 12 months: 910
Women who had a birth in the past 12 months: 25 (10 now married, 13 unmarried) Women who did not have a birth in the past 12 months: 561 (135 now married, 428 unmarried)
Housing units in zip code 15140 with a mortgage: 267 Houses without a mortgage: 9
Median monthly owner costs for units with a mortgage: $869 Median monthly owner costs for units without a mortgage: $483
Residents with income below the poverty level in 2022:
This zip code:
19.1%
Whole state:
11.8%
Residents with income below 50% of the poverty level in 2022:
This zip code:
12.2%
Whole state:
6.1%
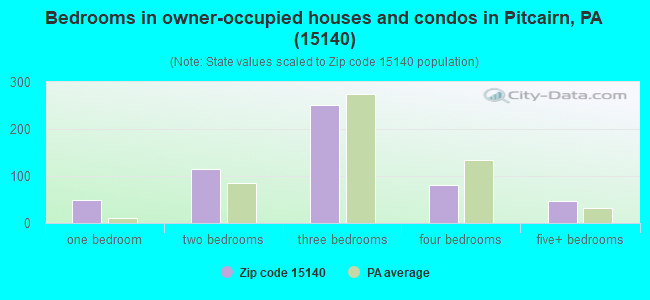
Median number of rooms in houses and condos:
Here:
6.1
State:
6.8
Median number of rooms in apartments:
Here:
4.3
State:
4.3
Notable locations in this zip code not listed on our city pages
Notable locations in zip code 15140: Pitcairn Borough Hall (A), Pitcairn Elementary School Library (B), Pitcairn Police Department (C), Pitcairn Hose Company No 1 Station 229 (D), Pitcairn Relief Fire Company 2 Station 230 (E). Display/hide their locations on the map
Churches in zip code 15140 include: The Presbyterian Church of Pitcairn (A), Pitcairn Assembly of God Church (B), Highland Avenue United Methodist Church (C), Center Avenue United Methodist Church (D). Display/hide their locations on the map
Size of family households: 218 2-persons, 221 3-persons, 174 4-persons, 88 5-persons
Size of nonfamily households: 606 1-person, 95 2-persons
238 married couples with children.
441 single-parent households (138 men, 303 women).
93.6% of residents of 15140 zip code speak English at home.
2.6% of residents speak Spanish at home (65% very well, 35% well).
1.9% of residents speak other Indo-European language at home (80% very well, 20% well).
1.3% of residents speak Asian or Pacific Island language at home (62% very well, 38% not well).
Foreign born population: 156 (5.1%) (63.0% of them are naturalized citizens)
This zip code:
5.1%
Whole state:
7.5%
15%Malaysia
13%Austria
10%Egypt
7%Taiwan
6%Honduras
4%Greece
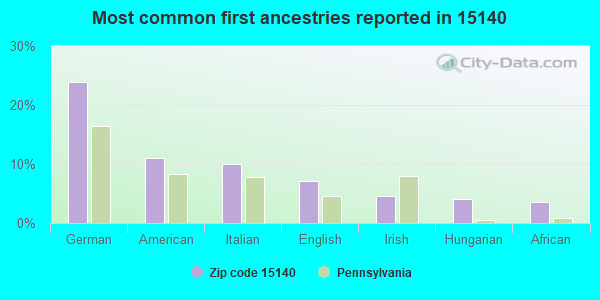
24%German
11%American
10%Italian
7%English
5%Irish
4%Hungarian
3%African
Year of entry for the foreign-born population
582010 or later
782000 to 2009
01990 to 1999
49Before 1990
Housing units lacking complete plumbing facilities: 2.6%
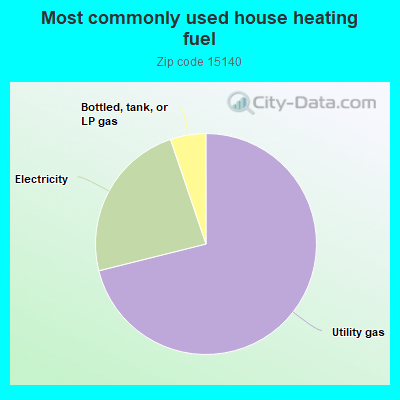
71.1%Utility gas
23.7%Electricity
5.2%Bottled, tank, or LP gas
Population in 1990: 4,083.
Place of birth for U.S.-born residents:
This state: 2,563
Northeast: 24
Midwest: 18
South: 184
West: 85
63% of the 15140 zip code residents lived in the same house 5 years ago. Out of people who lived in different houses, 81% lived in this county. Out of people who lived in different counties, 50% lived in Pennsylvania.
87% of the 15140 zip code residents lived in the same house 1 year ago. Out of people who lived in different houses, 72% moved from this county. Out of people who lived in different houses, 14% moved from different county within same state. Out of people who lived in different houses, 11% moved from different state.
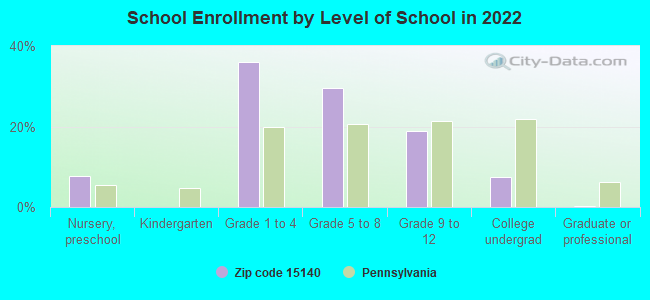
Private vs. public school enrollment:
Students in private schools in grades 1 to 8 (elementary and middle school): 9
Here:
2.5%
Pennsylvania:
15.7%
Students in private schools in grades 9 to 12 (high school): 6
Here:
5.5%
Pennsylvania:
13.4%
Students in private undergraduate colleges: 5
Here:
10.9%
Pennsylvania:
39.8%
Occupation by median earnings in the past 12 months ($)
50,014Management occupations
42,876Construction and extraction occupations
41,903Office and administrative support occupations
34,690Sales and related occupations
27,162Building and grounds cleaning and maintenance occupations
26,498Transportation occupations
Top industries in this zip code by the number of employees in 2005:
Administrative and Support and Waste Management and Remediation Services: Janitorial Services (250-499 employees: 1 establishment)
Health Care and Social Assistance: Diagnostic Imaging Centers (20-49: 1)
Professional, Scientific, and Technical Services: Testing Laboratories (10-19: 1)
Other Services (except Public Administration): Industrial Launderers (10-19: 1)
Construction: Plumbing, Heating, and Air-Conditioning Contractors (5-9: 1, 1-4: 2)
Other Services (except Public Administration): Religious Organizations (1-4: 5)
2005 - 2018 National Fire Incident Reporting System (NFIRS) incidents
Based on the data from the years 2005 - 2018 the average number of fire incidents per year is 16. The highest number of fire incidents - 58 took place in 2018, and the least - 2 in 2005. The data has a rising trend.
When looking into fire subcategories, the most reports belonged to: Structure Fires (80.0%), and Other (12.3%).
Fire incident types reported to NFIRS in Zip Code 15140


 Nearest zip codes: 15148, 15146, 15035, 15137, 15145, 15085.


 Based on the data from the years 2005 - 2018 the average number of fire incidents per year is 16. The highest number of fire incidents - 58 took place in 2018, and the least - 2 in 2005. The data has a rising trend.
 When looking into fire subcategories, the most reports belonged to: Structure Fires (80.0%), and Other (12.3%).