Estimated zip code population in 2022: 1,507 Zip code population in 2010: 1,737 Zip code population in 2000: 1,966
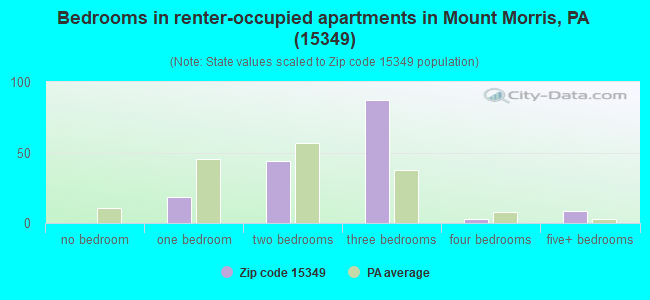
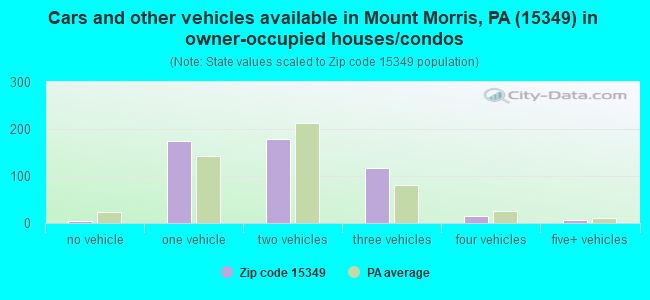
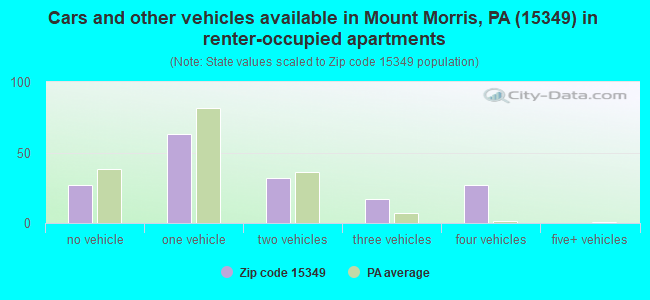
Houses and condos: 813 Renter-occupied apartments: 165
% of renters here:
25%
State:
31%
March 2022 cost of living index in zip code 15349: 91.5 (less than average, U.S. average is 100)
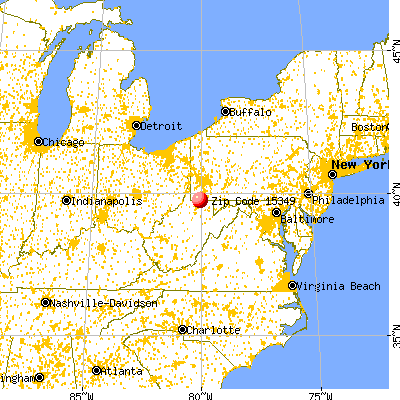
Land area: 38.6 sq. mi. Water area: 0.0 sq. mi.
Population density: 39 people per square mile
(very low).
OSM Map
General Map
Google Map
MSN Map
OSM Map
General Map
Google Map
MSN Map
OSM Map
General Map
Google Map
MSN Map
OSM Map
General Map
Google Map
MSN Map
Please wait while loading the map...
Real estate property taxes paid for housing units in 2022:
This zip code:
0.9% ($1,764)
Pennsylvania:
1.3% ($3,094)
Median real estate property taxes paid for housing units with mortgages in 2022: $2,039 (1.2%) Median real estate property taxes paid for housing units with no mortgage in 2022: $1,594 (0.7%)
Business Search- 14 Million verified businesses
Males: 792
(52.6%)
Females: 714
(47.4%)
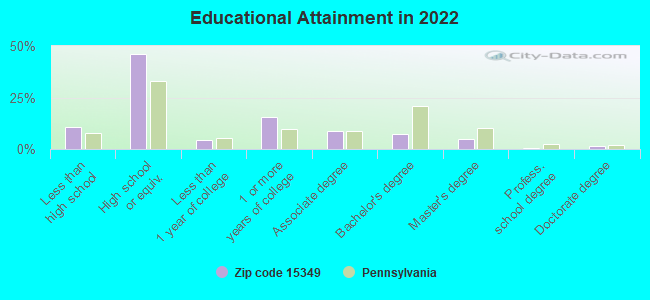
For population 25 years and over in 15349:
High school or higher: 88.7%
Bachelor's degree or higher: 14.4%
Graduate or professional degree: 7.1%
Unemployed: 2.4%
Mean travel time to work (commute): 33.8 minutes
For population 15 years and over in 15349:
Never married: 29.1%
Now married: 51.7%
Separated: 1.0%
Widowed: 5.3%
Divorced: 12.8%
Zip code 15349 compared to state average:
Unemployed percentage below state average.
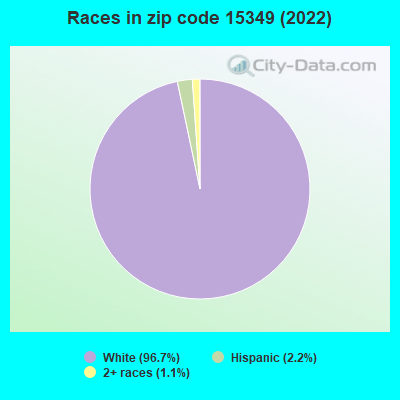
Black race population percentage significantly below state average.
Hispanic race population percentage significantly below state average.
Median age above state average.
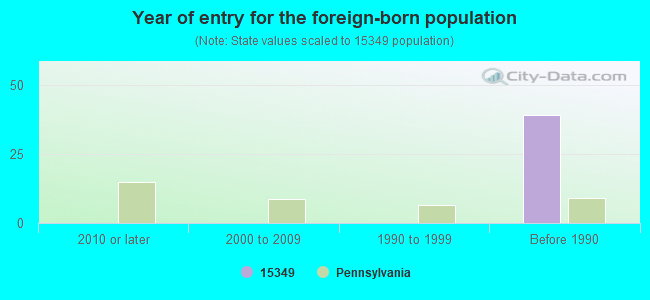
Foreign-born population percentage significantly below state average.
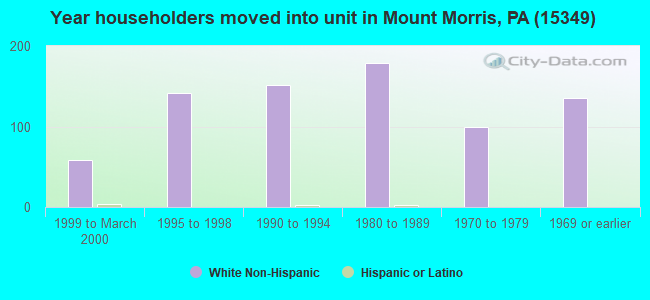
Length of stay since moving in significantly above state average.
Percentage of population with a bachelor's degree or higher significantly below state average.
Estimated median house/condo value in 2022: $207,405
15349:
$207,405
Pennsylvania:
$245,500
According to our research of Pennsylvania and other state lists, there were 3 registered sex offenders living in 15349 zip code as of June 15, 2024. The ratio of all residents to sex offenders in zip code 15349 is 610 to 1. The ratio of registered sex offenders to all residents in this zip code is near the state average.
Median resident age:
This zip code:
45.9 years
Pennsylvania median age:
40.9 years
Average household size:
This zip code:
2.3 people
Pennsylvania:
2.4 people
Averages for the 2020 tax year for zip code 15349, filed in 2021:
Average Adjusted Gross Income (AGI) in 2020: $64,741 (Individual Income Tax Returns)
Here:
$64,741
State:
$75,707
Salary/wage: $54,195 (reported on 78.4% of returns)
Here:
$54,195
State:
$62,806
(% of AGI for various income ranges: 1021.2% for AGIs below $25k, 3343.3% for AGIs $25k-50k, 6021.4% for AGIs $50k-75k, 9301.7% for AGIs $75k-100k, 13011.3% for AGIs $100k-200k)
Taxable interest for individuals: $1,161 (reported on 37.8% of returns)
This zip code:
$1,161
Pennsylvania:
$1,633
(% of AGI for various income ranges: 10.6% for AGIs below $25k, 31.3% for AGIs $25k-50k, 77.1% for AGIs $50k-75k, 178.3% for AGIs $75k-100k, 125.0% for AGIs $100k-200k)
Ordinary dividends: $3,950 (reported on 16.2% of returns)
Here:
$3,950
State:
$7,382
(% of AGI for various income ranges: 15.0% for AGIs below $25k, 28.0% for AGIs $25k-50k, 144.3% for AGIs $50k-75k, 176.7% for AGIs $75k-100k, 251.3% for AGIs $100k-200k)
Net capital gain/loss in AGI: +$4,600 (reported on 13.5% of returns)
Here:
+$4,600
State:
+$23,522
(% of AGI for various income ranges: 45.3% for AGIs $25k-50k, 25.0% for AGIs $75k-100k, 471.3% for AGIs $100k-200k)
Profit/loss from business: +$6,762 (reported on 10.8% of returns)
Here:
+$6,762
State:
+$16,274
(% of AGI for various income ranges: 146.9% for AGIs below $25k, 38.7% for AGIs $25k-50k, 310.0% for AGIs $100k-200k)
Taxable individual retirement arrangement distribution: $19,989 (reported on 12.2% of returns)
15349:
$19,989
Pennsylvania:
$18,583
(% of AGI for various income ranges: 156.2% for AGIs below $25k, 1098.6% for AGIs $50k-75k, 975.0% for AGIs $100k-200k)
Total itemized deductions: $31,500 (reported on 2.7% of returns)
Here:
$31,500
State:
$34,850
(% of AGI for various income ranges: 900.0% for AGIs $50k-75k)
Taxes paid: $8,700 (reported on 2.7% of returns)
15349:
$8,700
State:
$8,200
(% of AGI for various income ranges: 248.6% for AGIs $50k-75k)
Earned income credit: $1,900 (reported on 13.5% of returns)
Here:
$1,900
State:
$2,100
(% of AGI for various income ranges: 74.4% for AGIs below $25k, 47.3% for AGIs $25k-50k)
Percentage of individuals using paid preparers for their 2020 taxes: 93.2%
Here:
93%
State:
92%
(% for various income ranges: 95.5% for AGIs below $25k, 94.4% for AGIs $25k-50k, 90.9% for AGIs $50k-75k, 90.0% for AGIs $75k-100k, 109.1% for AGIs $100k-200k, 0.0% for AGIs over 200k)
Averages for the 2012 tax year for zip code 15349, filed in 2013:
Average Adjusted Gross Income (AGI) in 2012: $55,402 (Individual Income Tax Returns)
Here:
$55,402
State:
$61,346
Salary/wage: $48,849 (reported on 81.2% of returns)
Here:
$48,849
State:
$51,902
(% of AGI for various income ranges: 68.7% for AGIs below $25k, 75.2% for AGIs $25k-50k, 73.1% for AGIs $50k-75k, 79.6% for AGIs $75k-100k, 66.8% for AGIs $100k-200k)
Taxable interest for individuals: $1,403 (reported on 36.2% of returns)
This zip code:
$1,403
Pennsylvania:
$1,588
(% of AGI for various income ranges: 1.9% for AGIs below $25k, 0.9% for AGIs $25k-50k, 0.9% for AGIs $50k-75k, 0.1% for AGIs $75k-100k, 1.1% for AGIs $100k-200k)
Ordinary dividends: $2,807 (reported on 17.5% of returns)
Here:
$2,807
State:
$5,827
(% of AGI for various income ranges: 1.9% for AGIs below $25k, 0.4% for AGIs $50k-75k, 0.1% for AGIs $75k-100k, 1.6% for AGIs $100k-200k)
Net capital gain/loss in AGI: +$3,911 (reported on 11.2% of returns)
Here:
+$3,911
State:
+$14,495
(% of AGI for various income ranges: 0.2% for AGIs below $25k, 0.3% for AGIs $50k-75k, 1.8% for AGIs $100k-200k)
Profit/loss from business: +$11,878 (reported on 11.2% of returns)
Here:
+$11,878
State:
+$16,268
(% of AGI for various income ranges: 5.6% for AGIs below $25k, 3.5% for AGIs $50k-75k, 7.5% for AGIs $75k-100k)
Taxable individual retirement arrangement distribution: $12,238 (reported on 10.0% of returns)
15349:
$12,238
Pennsylvania:
$14,550
Total itemized deductions: $18,453 (16% of AGI, reported on 18.8% of returns)
Here:
$18,453
State:
$23,538
Here:
16.2% of AGI
State:
18.4% of AGI
(% of AGI for various income ranges: 8.3% for AGIs below $25k, 5.8% for AGIs $50k-75k, 5.6% for AGIs $75k-100k, 8.7% for AGIs $100k-200k)
Charity contributions: $4,340 (reported on 12.5% of returns)
Here:
$4,340
State:
$4,025
Taxes paid: $8,320 (reported on 18.8% of returns)
15349:
$8,320
State:
$9,982
(% of AGI for various income ranges: 2.8% for AGIs below $25k, 1.8% for AGIs $50k-75k, 2.2% for AGIs $75k-100k, 4.6% for AGIs $100k-200k)
Earned income credit: $1,875 (reported on 15.0% of returns)
Here:
$1,875
State:
$2,106
(% of AGI for various income ranges: 4.9% for AGIs below $25k, 0.8% for AGIs $25k-50k)
Percentage of individuals using paid preparers for their 2012 taxes: 52.5%
Here:
52%
State:
53%
(% for various income ranges: 42.9% for AGIs below $25k, 50.0% for AGIs $25k-50k, 50.0% for AGIs $50k-75k, 66.7% for AGIs $75k-100k, 72.7% for AGIs $100k-200k)
Averages for the 2004 tax year for zip code 15349, filed in 2005:
Average Adjusted Gross Income (AGI) in 2004: $39,715 (Individual Income Tax Returns)
Here:
$39,715
State:
$48,049
Salary/wage: $35,377 (reported on 83.3% of returns)
Here:
$35,377
State:
$42,646
(% of AGI for various income ranges: 79.6% for AGIs below $10k, 70.7% for AGIs $10k-25k, 81.1% for AGIs $25k-50k, 85.6% for AGIs $50k-75k, 74.2% for AGIs $75k-100k, 53.1% for AGIs over 100k)
Taxable interest for individuals: $1,158 (reported on 41.9% of returns)
This zip code:
$1,158
Pennsylvania:
$1,657
(% of AGI for various income ranges: 4.3% for AGIs below $10k, 2.3% for AGIs $10k-25k, 1.2% for AGIs $25k-50k, 0.7% for AGIs $50k-75k, 0.4% for AGIs $75k-100k, 1.6% for AGIs over 100k)
Taxable dividends: $1,188 (reported on 18.3% of returns)
Here:
$1,188
State:
$3,566
(% of AGI for various income ranges: 0.7% for AGIs below $10k, 1.5% for AGIs $10k-25k, 0.4% for AGIs $25k-50k, 0.2% for AGIs $50k-75k, 0.3% for AGIs $75k-100k, 0.8% for AGIs over 100k)
Net capital gain/loss: +$1,753 (reported on 11.9% of returns)
Here:
+$1,753
State:
+$9,716
(% of AGI for various income ranges: 1.0% for AGIs $10k-25k, 0.1% for AGIs $25k-50k, 0.3% for AGIs $50k-75k, 1.3% for AGIs over 100k)
Profit/loss from business: +$8,174 (reported on 11.3% of returns)
Here:
+$8,174
State:
+$14,267
(% of AGI for various income ranges: -4.6% for AGIs below $10k, 4.3% for AGIs $10k-25k, 3.5% for AGIs $25k-50k, 1.6% for AGIs $50k-75k, 3.2% for AGIs over 100k)
IRA payment deduction: $2,429 (reported on 1.7% of returns)
15349:
$2,429
Pennsylvania:
$2,903
Total itemized deductions: $14,680 (17% of AGI, reported on 18.5% of returns)
Here:
$14,680
State:
$18,804
Here:
17.2% of AGI
State:
19.5% of AGI
(% of AGI for various income ranges: 3.8% for AGIs $10k-25k, 4.5% for AGIs $25k-50k, 7.3% for AGIs $50k-75k, 9.0% for AGIs $75k-100k, 9.5% for AGIs over 100k)
Charity contributions deductions: $2,735 (4% of AGI, reported on 14.4% of returns)
Here:
$2,735
State:
$3,337
Here:
3.7% of AGI
State:
3.3% of AGI
(% of AGI for various income ranges: 3.9% for AGIs below $10k, 1.1% for AGIs $25k-50k, 0.9% for AGIs $50k-75k, 0.8% for AGIs $75k-100k, 1.3% for AGIs over 100k)
Total tax: $5,639 (reported on 74.7% of returns)
15349:
$5,639
State:
$8,008
(% of AGI for various income ranges: 1.0% for AGIs below $10k, 3.6% for AGIs $10k-25k, 6.8% for AGIs $25k-50k, 9.4% for AGIs $50k-75k, 11.0% for AGIs $75k-100k, 20.7% for AGIs over 100k)
Earned income credit: $1,714 (reported on 15.5% of returns)
Here:
$1,714
State:
$1,643
Percentage of individuals using paid preparers for their 2004 taxes: 55.6%
Here:
56%
State:
56%
(% for various income ranges: 44.5% for AGIs below $10k, 54.9% for AGIs $10k-25k, 56.0% for AGIs $25k-50k, 61.4% for AGIs $50k-75k, 63.5% for AGIs $75k-100k, 69.4% for AGIs over 100k)
Likely homosexual households (counted as self-reported same-sex unmarried-partner households)
Lesbian couples: 0.0% of all households
Gay men: 1.3% of all households
Household received Food Stamps/SNAP in the past 12 months: 99 Household did not receive Food Stamps/SNAP in the past 12 months: 563
Women who had a birth in the past 12 months: 4 (0 now married, 3 unmarried) Women who did not have a birth in the past 12 months: 346 (169 now married, 175 unmarried)
Housing units in zip code 15349 with a mortgage: 198 (16 second mortgage, 16 both second mortgage and home equity loan) Median monthly owner costs for units with a mortgage: $1,135 Median monthly owner costs for units without a mortgage: $472
Residents with income below the poverty level in 2022:
This zip code:
11.4%
Whole state:
11.8%
Residents with income below 50% of the poverty level in 2022:
This zip code:
9.6%
Whole state:
6.1%
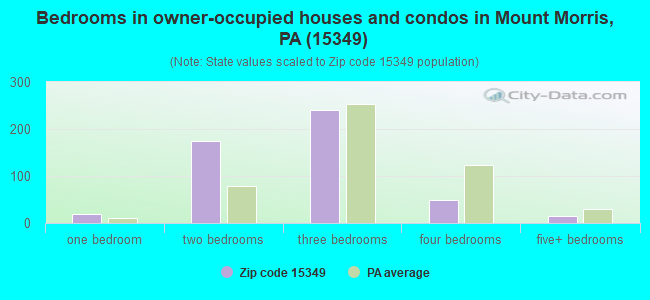
Median number of rooms in houses and condos:
Here:
6.2
State:
6.8
Median number of rooms in apartments:
Here:
6.7
State:
4.3
Notable locations in this zip code not listed on our city pages
Streams, rivers, and creeks: Shannon Run (A), Hobbs Run (B), Glade Run (C), Fox Run (D), Meadow Run (E), Woods Run (F), Calvin Run (G), Dooley Run (H), Watkins Run (I). Display/hide their locations on the map
Size of family households: 196 2-persons, 76 3-persons, 127 4-persons, 19 5-persons
Size of nonfamily households: 217 1-person, 22 2-persons
134 married couples with children.
60 single-parent households (56 men, 4 women).
97.4% of residents of 15349 zip code speak English at home.
1.2% of residents speak Spanish at home (100% very well).
0.6% of residents speak other Indo-European language at home (100% well).
0.2% of residents speak Asian or Pacific Island language at home (100% very well).
Foreign born population: 0 (0.0%)
:
0.0%
Whole state:
7.5%
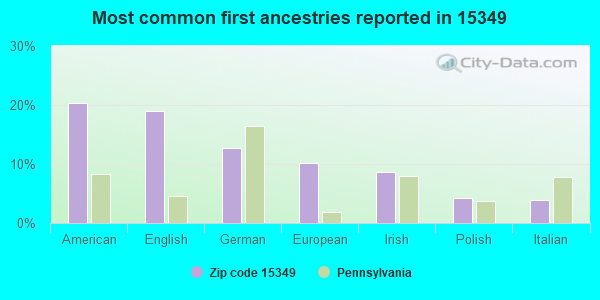
20%American
19%English
13%German
10%European
9%Irish
4%Polish
4%Italian
Year of entry for the foreign-born population
02010 or later
02000 to 2009
01990 to 1999
39Before 1990
Facilities with environmental interests located in this zip code:
ARRISON HB WV (RTE 19 in MT MORRIS, PA)
STATE MASTER (Pennsylvania database) - RCRIS-PAD045866431, HAZARDOUS WASTE PROGRAM Small Quantity Generators, between 100 kg and 1000 kg of hazardous waste/month (Resource Conservation and Recovery Act (tracking hazardous waste)) - notification Organizations: OPERNAME (CONTACT/OPERATOR)
, ARRISON H B OF WV INC (CONTACT/OWNER)
Alternative names: ARRISON H B OF WV INC, ARRISON H B WV
Housing units lacking complete plumbing facilities: 4.5% Housing units lacking complete kitchen facilities: 4.6%
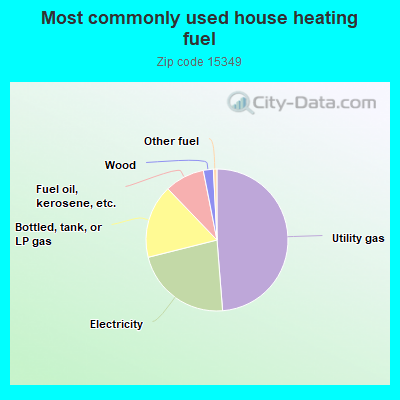
48.9%Utility gas
22.4%Electricity
16.8%Bottled, tank, or LP gas
9.1%Fuel oil, kerosene, etc.
2.3%Wood
0.8%Other fuel
Population in 1990: 1,719. Population change in the 1990s: +247 (+14.4%).
Place of birth for U.S.-born residents:
This state: 850
Northeast: 1
Midwest: 35
South: 553
West: 29
73% of the 15349 zip code residents lived in the same house 5 years ago. Out of people who lived in different houses, 53% lived in this county. Out of people who lived in different counties, 50% lived in Pennsylvania.
90% of the 15349 zip code residents lived in the same house 1 year ago. Out of people who lived in different houses, 77% moved from this county. Out of people who lived in different houses, 11% moved from different county within same state. Out of people who lived in different houses, 5% moved from different state. Out of people who lived in different houses, 5% moved from abroad.
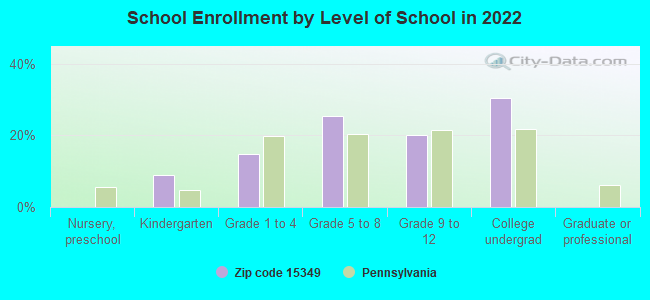
Private vs. public school enrollment:
Students in private schools in grades 1 to 8 (elementary and middle school):
Here:
0.0%
Pennsylvania:
15.7%
Students in private schools in grades 9 to 12 (high school):
Here:
0.0%
Pennsylvania:
13.4%
Students in private undergraduate colleges: 11
Here:
17.2%
Pennsylvania:
39.8%
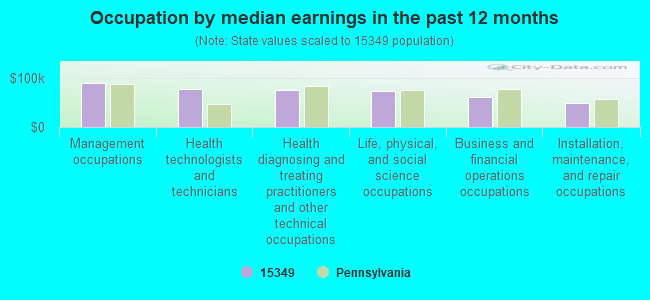
Occupation by median earnings in the past 12 months ($)
89,646Management occupations
78,353Health technologists and technicians
75,735Health diagnosing and treating practitioners and other technical occupations
73,425Life, physical, and social science occupations
60,285Business and financial operations occupations
49,105Installation, maintenance, and repair occupations
Top industries in this zip code by the number of employees in 2005:
Construction: Site Preparation Contractors (100-249 employees: 1 establishment)
Wholesale Trade: Tobacco and Tobacco Product Merchant Wholesalers (50-99: 1)
Administrative and Support and Waste Management and Remediation Services: All Other Support Services (20-49: 1)
Accommodation and Food Services: Full-Service Restaurants (10-19: 1, 5-9: 1)
Wholesale Trade: Construction and Mining (except Oil Well) Machinery and Equipment Merchant Wholesalers (10-19: 1)
People in group quarters in 2000:
5 people in other noninstitutional group quarters
Fatal accident statistics in 2013:
Fatal accident count: 1
Vehicles involved in fatal accidents: 1
Fatal accidents caused by drunken drivers: 0
Fatalities: 1
Persons involved in fatal accidents: 1
Pedestrians involved in fatal accidents: 0
2003 - 2017 National Fire Incident Reporting System (NFIRS) incidents
According to the data from the years 2003 - 2017 the average number of fire incidents per year is 9. The highest number of reported fire incidents - 26 took place in 2003, and the least - 0 in 2008. The data has a declining trend.
When looking into fire subcategories, the most reports belonged to: Structure Fires (49.2%), and Mobile Property/Vehicle Fires (21.9%).
Fire incident types reported to NFIRS in Zip Code 15349


 Nearest zip codes: 26541, 15338, 15315, 15362, 15334, 15327.


 According to the data from the years 2003 - 2017 the average number of fire incidents per year is 9. The highest number of reported fire incidents - 26 took place in 2003, and the least - 0 in 2008. The data has a declining trend.
 When looking into fire subcategories, the most reports belonged to: Structure Fires (49.2%), and Mobile Property/Vehicle Fires (21.9%).