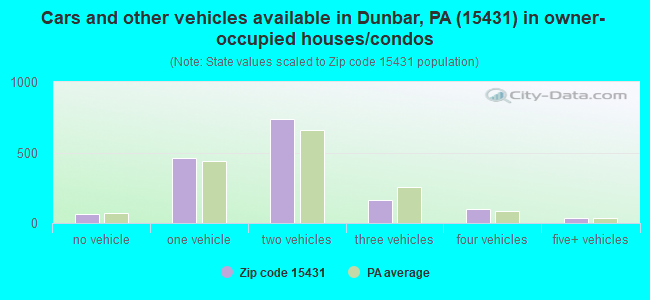
Estimated zip code population in 2022: 4,260 Zip code population in 2010: 4,744 Zip code population in 2000: 5,386
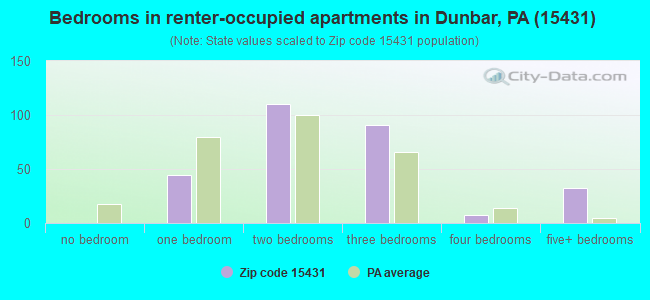
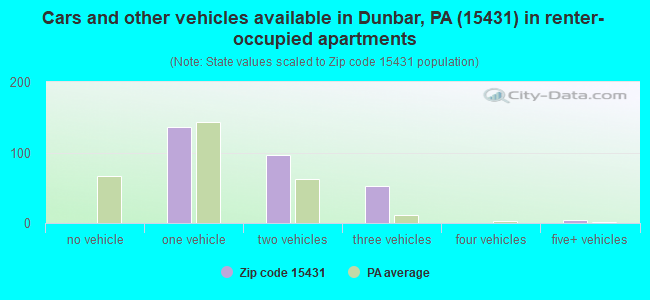
Houses and condos: 2,146 Renter-occupied apartments: 288
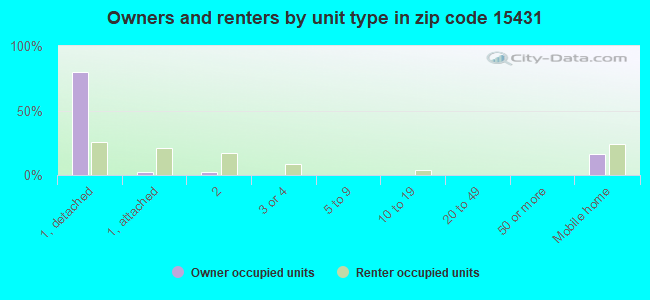
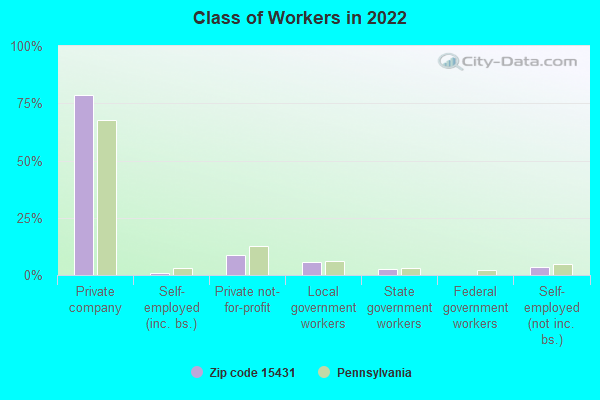
% of renters here:
16%
State:
31%
March 2022 cost of living index in zip code 15431: 87.2 (less than average, U.S. average is 100)
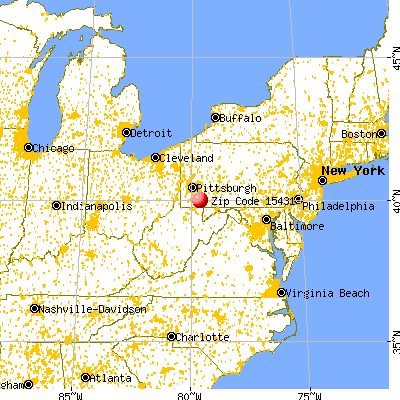
Land area: 48.9 sq. mi. Water area: 0.3 sq. mi.
Population density: 87 people per square mile
(very low).
OSM Map
General Map
Google Map
MSN Map
OSM Map
General Map
Google Map
MSN Map
OSM Map
General Map
Google Map
MSN Map
OSM Map
General Map
Google Map
MSN Map
Please wait while loading the map...
Real estate property taxes paid for housing units in 2022:
This zip code:
1.1% ($1,242)
Pennsylvania:
1.3% ($3,094)
Median real estate property taxes paid for housing units with mortgages in 2022: $1,321 (0.9%) Median real estate property taxes paid for housing units with no mortgage in 2022: $1,179 (1.2%)
Estimated median house/condo value in 2022: $113,633
15431:
$113,633
Pennsylvania:
$245,500
According to our research of Pennsylvania and other state lists, there were 6 registered sex offenders living in 15431 zip code as of June 16, 2024. The ratio of all residents to sex offenders in zip code 15431 is 650 to 1. The ratio of registered sex offenders to all residents in this zip code is near the state average.
Median resident age:
This zip code:
47.7 years
Pennsylvania median age:
40.9 years
Average household size:
This zip code:
2.3 people
Pennsylvania:
2.4 people
Averages for the 2020 tax year for zip code 15431, filed in 2021:
Average Adjusted Gross Income (AGI) in 2020: $50,714 (Individual Income Tax Returns)
Here:
$50,714
State:
$75,707
Salary/wage: $45,069 (reported on 82.0% of returns)
Here:
$45,069
State:
$62,806
(% of AGI for various income ranges: 1023.6% for AGIs below $25k, 3096.5% for AGIs $25k-50k, 5793.5% for AGIs $50k-75k, 8492.5% for AGIs $75k-100k, 14552.5% for AGIs $100k-200k)
Taxable interest for individuals: $608 (reported on 24.3% of returns)
This zip code:
$608
Pennsylvania:
$1,633
(% of AGI for various income ranges: 10.8% for AGIs below $25k, 10.4% for AGIs $25k-50k, 20.8% for AGIs $50k-75k, 22.5% for AGIs $75k-100k, 66.2% for AGIs $100k-200k)
Ordinary dividends: $1,781 (reported on 12.6% of returns)
Here:
$1,781
State:
$7,382
(% of AGI for various income ranges: 8.1% for AGIs below $25k, 11.6% for AGIs $25k-50k, 17.7% for AGIs $50k-75k, 9.4% for AGIs $75k-100k, 188.8% for AGIs $100k-200k)
Net capital gain/loss in AGI: +$6,883 (reported on 8.7% of returns)
Here:
+$6,883
State:
+$23,522
(% of AGI for various income ranges: 5.5% for AGIs below $25k, 25.9% for AGIs $25k-50k, 17.7% for AGIs $50k-75k, 19.4% for AGIs $75k-100k, 628.8% for AGIs $100k-200k)
Profit/loss from business: +$7,844 (reported on 8.7% of returns)
Here:
+$7,844
State:
+$16,274
(% of AGI for various income ranges: 62.3% for AGIs below $25k, 81.0% for AGIs $25k-50k, 53.8% for AGIs $50k-75k, 178.8% for AGIs $75k-100k, 161.9% for AGIs $100k-200k)
Taxable individual retirement arrangement distribution: $10,339 (reported on 8.7% of returns)
15431:
$10,339
Pennsylvania:
$18,583
(% of AGI for various income ranges: 57.9% for AGIs below $25k, 70.8% for AGIs $25k-50k, 165.8% for AGIs $50k-75k, 162.5% for AGIs $75k-100k, 322.5% for AGIs $100k-200k)
Total itemized deductions: $32,400 (reported on 1.0% of returns)
Here:
$32,400
State:
$34,850
(% of AGI for various income ranges: 122.3% for AGIs below $25k)
Earned income credit: $2,054 (reported on 17.0% of returns)
Here:
$2,054
State:
$2,100
(% of AGI for various income ranges: 78.7% for AGIs below $25k, 61.6% for AGIs $25k-50k)
Percentage of individuals using paid preparers for their 2020 taxes: 95.6%
Here:
96%
State:
92%
(% for various income ranges: 94.4% for AGIs below $25k, 96.6% for AGIs $25k-50k, 96.9% for AGIs $50k-75k, 95.0% for AGIs $75k-100k, 95.5% for AGIs $100k-200k, 100.0% for AGIs over 200k)
Averages for the 2012 tax year for zip code 15431, filed in 2013:
Average Adjusted Gross Income (AGI) in 2012: $41,937 (Individual Income Tax Returns)
Here:
$41,937
State:
$61,346
Salary/wage: $37,664 (reported on 84.7% of returns)
Here:
$37,664
State:
$51,902
(% of AGI for various income ranges: 74.7% for AGIs below $25k, 78.8% for AGIs $25k-50k, 80.7% for AGIs $50k-75k, 81.0% for AGIs $75k-100k, 66.0% for AGIs $100k-200k)
Taxable interest for individuals: $567 (reported on 27.3% of returns)
This zip code:
$567
Pennsylvania:
$1,588
(% of AGI for various income ranges: 0.7% for AGIs below $25k, 0.4% for AGIs $25k-50k, 0.3% for AGIs $50k-75k, 0.4% for AGIs $75k-100k, 0.3% for AGIs $100k-200k)
Ordinary dividends: $1,191 (reported on 15.8% of returns)
Here:
$1,191
State:
$5,827
(% of AGI for various income ranges: 0.8% for AGIs below $25k, 0.5% for AGIs $25k-50k, 0.3% for AGIs $50k-75k, 0.4% for AGIs $75k-100k, 0.5% for AGIs $100k-200k)
Net capital gain/loss in AGI: +$1,006 (reported on 8.1% of returns)
Here:
+$1,006
State:
+$14,495
(% of AGI for various income ranges: 0.6% for AGIs $50k-75k, 0.4% for AGIs $75k-100k)
Profit/loss from business: +$10,294 (reported on 8.6% of returns)
Here:
+$10,294
State:
+$16,268
(% of AGI for various income ranges: 3.3% for AGIs below $25k, 2.0% for AGIs $25k-50k, 1.4% for AGIs $50k-75k, 4.9% for AGIs $75k-100k)
Taxable individual retirement arrangement distribution: $8,719 (reported on 10.0% of returns)
15431:
$8,719
Pennsylvania:
$14,550
(% of AGI for various income ranges: 2.5% for AGIs below $25k, 1.9% for AGIs $25k-50k, 1.8% for AGIs $50k-75k, 4.9% for AGIs $75k-100k)
Total itemized deductions: $16,733 (19% of AGI, reported on 11.5% of returns)
Here:
$16,733
State:
$23,538
Here:
19.2% of AGI
State:
18.4% of AGI
(% of AGI for various income ranges: 4.0% for AGIs $25k-50k, 5.2% for AGIs $50k-75k, 4.1% for AGIs $75k-100k, 7.5% for AGIs $100k-200k)
Charity contributions: $2,394 (reported on 8.1% of returns)
Here:
$2,394
State:
$4,025
(% of AGI for various income ranges: 0.4% for AGIs $25k-50k, 0.4% for AGIs $50k-75k, 0.5% for AGIs $75k-100k, 0.8% for AGIs $100k-200k)
Taxes paid: $5,038 (reported on 11.5% of returns)
15431:
$5,038
State:
$9,982
(% of AGI for various income ranges: 0.8% for AGIs $25k-50k, 1.3% for AGIs $50k-75k, 1.3% for AGIs $75k-100k, 2.9% for AGIs $100k-200k)
Earned income credit: $2,067 (reported on 20.1% of returns)
Here:
$2,067
State:
$2,106
(% of AGI for various income ranges: 5.8% for AGIs below $25k, 1.0% for AGIs $25k-50k)
Percentage of individuals using paid preparers for their 2012 taxes: 59.3%
Here:
59%
State:
53%
(% for various income ranges: 54.3% for AGIs below $25k, 56.9% for AGIs $25k-50k, 65.6% for AGIs $50k-75k, 73.7% for AGIs $75k-100k, 69.2% for AGIs $100k-200k)
Averages for the 2004 tax year for zip code 15431, filed in 2005:
Average Adjusted Gross Income (AGI) in 2004: $29,329 (Individual Income Tax Returns)
Here:
$29,329
State:
$48,049
Salary/wage: $27,697 (reported on 85.7% of returns)
Here:
$27,697
State:
$42,646
(% of AGI for various income ranges: 106.3% for AGIs below $10k, 75.5% for AGIs $10k-25k, 83.1% for AGIs $25k-50k, 83.6% for AGIs $50k-75k, 85.7% for AGIs $75k-100k, 61.4% for AGIs over 100k)
Taxable interest for individuals: $996 (reported on 36.5% of returns)
This zip code:
$996
Pennsylvania:
$1,657
(% of AGI for various income ranges: 4.6% for AGIs below $10k, 1.9% for AGIs $10k-25k, 1.0% for AGIs $25k-50k, 1.2% for AGIs $50k-75k, 0.6% for AGIs $75k-100k, 0.6% for AGIs over 100k)
Taxable dividends: $932 (reported on 14.5% of returns)
Here:
$932
State:
$3,566
(% of AGI for various income ranges: 4.1% for AGIs below $10k, 0.5% for AGIs $10k-25k, 0.2% for AGIs $25k-50k, 0.1% for AGIs $50k-75k, 0.2% for AGIs $75k-100k, 1.2% for AGIs over 100k)
Net capital gain/loss: +$1,649 (reported on 8.7% of returns)
Here:
+$1,649
State:
+$9,716
(% of AGI for various income ranges: 1.0% for AGIs below $10k, 0.1% for AGIs $10k-25k, 0.2% for AGIs $25k-50k, 1.1% for AGIs $50k-75k, 0.5% for AGIs $75k-100k, 0.1% for AGIs over 100k)
Profit/loss from business: +$5,061 (reported on 10.0% of returns)
Here:
+$5,061
State:
+$14,267
(% of AGI for various income ranges: 0.2% for AGIs below $10k, 4.9% for AGIs $10k-25k, 1.7% for AGIs $25k-50k, 1.2% for AGIs $50k-75k)
IRA payment deduction: $2,644 (reported on 2.8% of returns)
15431:
$2,644
Pennsylvania:
$2,903
Total itemized deductions: $13,174 (21% of AGI, reported on 9.2% of returns)
Here:
$13,174
State:
$18,804
Here:
20.5% of AGI
State:
19.5% of AGI
(% of AGI for various income ranges: 2.2% for AGIs $10k-25k, 3.0% for AGIs $25k-50k, 5.1% for AGIs $50k-75k, 5.4% for AGIs $75k-100k, 9.1% for AGIs over 100k)
Charity contributions deductions: $1,955 (3% of AGI, reported on 7.3% of returns)
Here:
$1,955
State:
$3,337
Here:
2.8% of AGI
State:
3.3% of AGI
(% of AGI for various income ranges: 0.3% for AGIs $10k-25k, 0.2% for AGIs $25k-50k, 0.4% for AGIs $50k-75k, 1.0% for AGIs $75k-100k, 1.5% for AGIs over 100k)
Total tax: $3,489 (reported on 67.5% of returns)
15431:
$3,489
State:
$8,008
(% of AGI for various income ranges: 2.0% for AGIs below $10k, 3.7% for AGIs $10k-25k, 6.3% for AGIs $25k-50k, 9.2% for AGIs $50k-75k, 11.3% for AGIs $75k-100k, 17.6% for AGIs over 100k)
Earned income credit: $1,683 (reported on 21.4% of returns)
Here:
$1,683
State:
$1,643
Percentage of individuals using paid preparers for their 2004 taxes: 58.3%
Here:
58%
State:
56%
(% for various income ranges: 50.2% for AGIs below $10k, 56.7% for AGIs $10k-25k, 61.1% for AGIs $25k-50k, 68.6% for AGIs $50k-75k, 54.4% for AGIs $75k-100k, 87.5% for AGIs over 100k)
Likely homosexual households (counted as self-reported same-sex unmarried-partner households)
Lesbian couples: 0.6% of all households
Gay men: 0.2% of all households
Household received Food Stamps/SNAP in the past 12 months: 557 Household did not receive Food Stamps/SNAP in the past 12 months: 1,297
Women who had a birth in the past 12 months: 40 (20 now married, 18 unmarried) Women who did not have a birth in the past 12 months: 734 (289 now married, 444 unmarried)
Housing units in zip code 15431 with a mortgage: 653 (44 second mortgage, 33 both second mortgage and home equity loan) Houses without a mortgage: 53
Median monthly owner costs for units with a mortgage: $919 Median monthly owner costs for units without a mortgage: $460
Residents with income below the poverty level in 2022:
This zip code:
12.6%
Whole state:
11.8%
Residents with income below 50% of the poverty level in 2022:
This zip code:
8.4%
Whole state:
6.1%
Median number of rooms in houses and condos:
Here:
5.8
State:
6.8
Median number of rooms in apartments:
Here:
5.6
State:
4.3
Notable locations in this zip code not listed on our city pages
Notable locations in zip code 15431: Camp Carmel (A), Hill Farm (B), Dunbar Borough Volunteer Fire Department Station 12 (C), Morrell Volunteer Fire Department Station 24 (D), Monarch Volunteer Fire Company Station 28 (E). Display/hide their locations on the map
Streams, rivers, and creeks: Johnson Run (A), Irishtown Run (B), Tucker Run (C), Morgan Run (D), Glade Run (E), Gist Run (F), Ferguson Run (G), Elk Rock Run (H), Limestone Run (I). Display/hide their locations on the map
425 married couples with children.
183 single-parent households (53 men, 130 women).
98.3% of residents of 15431 zip code speak English at home.
1.1% of residents speak other Indo-European language at home (91% very well, 9% well).
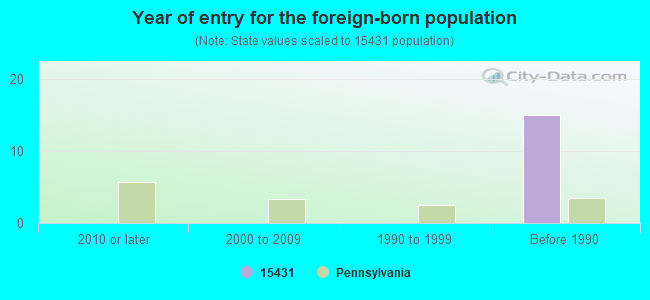
Foreign born population: 10 (0.2%) (100.0% of them are naturalized citizens)
This zip code:
0.2%
Whole state:
7.5%
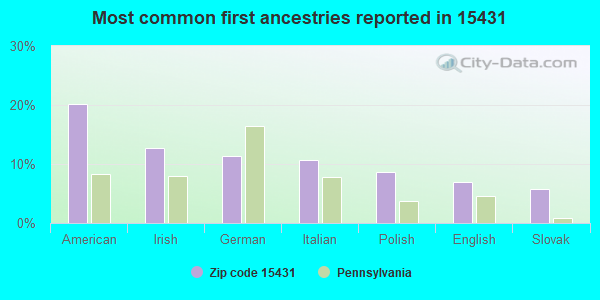
130%Bulgaria
20%American
13%Irish
11%German
11%Italian
9%Polish
7%English
6%Slovak
Year of entry for the foreign-born population
02010 or later
02000 to 2009
01990 to 1999
15Before 1990
Facilities with environmental interests located in this zip code:
ACTION OIL (111 WOODVALE ST in DUNBAR, PA)
STATE MASTER (Pennsylvania database) - RCRIS-PAD987395878, HAZARDOUS WASTE PROGRAM Conditionally Exempt Small Quantity Generators, less than 100 kg/month of hazardous waste (Resource Conservation and Recovery Act (tracking hazardous waste)) - notification Organizations: CROCETTI EMIDIO (CONTACT/OWNER)
APOSTOLIC CHRISTIAN ACADEMY (RD 1 in DUNBAR, PA)
(Integrated Compliance Information System) - ICIS-03-1989-0847, FORMAL ENFORCEMENT ACTION COMPLIANCE ACTIVITY (Tracking inspections of insecticide, fungicide, and rodenticide, and toxic substances)
BELLS PAINT & BODY (119 NORTH BELL DRIVE in DUNBAR, PA)
Conditionally Exempt Small Quantity Generators, less than 100 kg/month of hazardous waste (Resource Conservation and Recovery Act (tracking hazardous waste)) - notification Organizations: JOHN BELL (CONTACT/OWNER)
Alternative names: BELLS PAINT BODY
Housing units lacking complete plumbing facilities: 7.1% Housing units lacking complete kitchen facilities: 5.2%
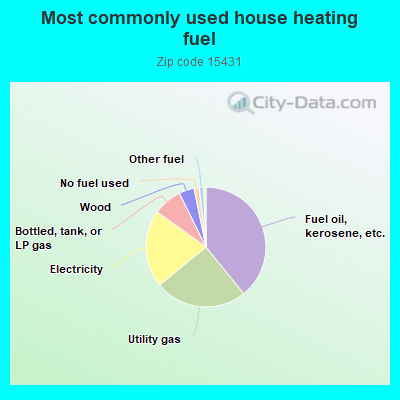
39.3%Fuel oil, kerosene, etc.
25.0%Utility gas
20.9%Electricity
7.8%Bottled, tank, or LP gas
4.1%Wood
1.4%No fuel used
1.2%Other fuel
0.6%Coal or coke
Population in 1990: 2,947. Population change in the 1990s: +2,439 (+82.8%).
Place of birth for U.S.-born residents:
This state: 3,848
Northeast: 53
Midwest: 50
South: 223
West: 33
78% of the 15431 zip code residents lived in the same house 5 years ago. Out of people who lived in different houses, 78% lived in this county. Out of people who lived in different counties, 50% lived in Pennsylvania.
92% of the 15431 zip code residents lived in the same house 1 year ago. Out of people who lived in different houses, 76% moved from this county. Out of people who lived in different houses, 1% moved from different county within same state. Out of people who lived in different houses, 22% moved from different state.
Private vs. public school enrollment:
Students in private schools in grades 1 to 8 (elementary and middle school): 16
Here:
5.4%
Pennsylvania:
15.7%
Students in private schools in grades 9 to 12 (high school): 3
Here:
1.8%
Pennsylvania:
13.4%
Students in private undergraduate colleges: 7
Here:
10.7%
Pennsylvania:
39.8%
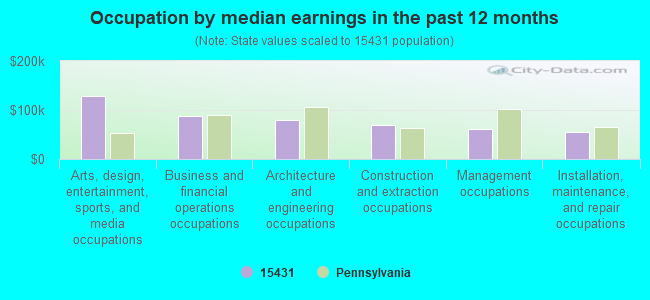
Occupation by median earnings in the past 12 months ($)
128,525Arts, design, entertainment, sports, and media occupations
88,227Business and financial operations occupations
78,775Architecture and engineering occupations
69,476Construction and extraction occupations
61,472Management occupations
54,334Installation, maintenance, and repair occupations
Companies with federal contracts located in this zip code:
D T CONSTRUCTION, INC. (RR 119 in DUNBAR, PA; small business) 8 employees, $850000 revenue. : $6,000 in 2 contractsfrom 2000 to 2001
$31,000 with National Park Service for Maintenance, Repair or Alteration of Real Property -- Other Non-Building Facilities. Signed on 2001-02-15. Completion date: 1999-09-15.
-$25,000 with Office of Surface Mining, Reclamation and Enforcement for Maintenance, Repair or Alteration of Real Property -- Restoration of real property. Signed on 2000-12-15. Completion date: 1998-06-15.
Top industries in this zip code by the number of employees in 2005:
Health Care and Social Assistance: All Other Outpatient Care Centers (50-99 employees: 1 establishment)
Construction: Water and Sewer Line and Related Structures Construction (20-49: 1)
Construction: New Single-Family Housing Construction (except Operative Builders) (10-19: 1, 1-4: 1)
Accommodation and Food Services: Full-Service Restaurants (5-9: 2, 1-4: 1)
Accommodation and Food Services: Limited-Service Restaurants (10-19: 1)
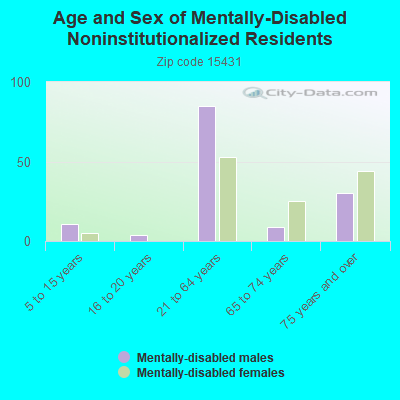
People in group quarters in 2010:
17 people in nursing facilities/skilled-nursing facilities
4 people in group homes intended for adults
People in group quarters in 2000:
12 people in nursing homes
12 people in homes for the mentally retarded
7 people in other noninstitutional group quarters
Fatal accident statistics in 2011:
Fatal accident count: 1
Vehicles involved in fatal accidents: 1
Fatal accidents caused by drunken drivers: 1
Fatalities: 1
Persons involved in fatal accidents: 1
Pedestrians involved in fatal accidents: 0
Home Mortgage Disclosure Act Aggregated Statistics For Year 2009 (Based on 2 full and 4 partial tracts)
A) FHA, FSA/RHS & VA Home Purchase Loans
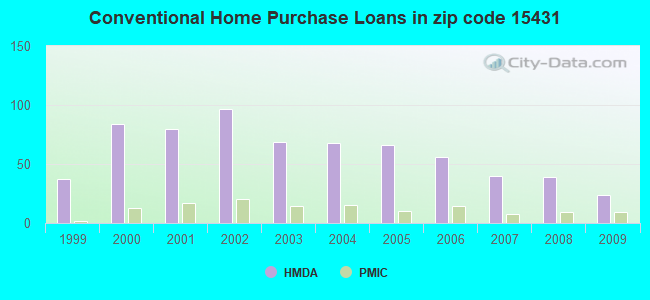
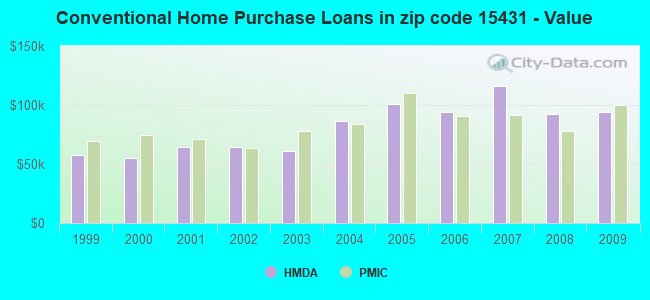
B) Conventional Home Purchase Loans
C) Refinancings
D) Home Improvement Loans
F) Non-occupant Loans on < 5 Family Dwellings (A B C & D)
G) Loans On Manufactured Home Dwelling (A B C & D)
Number
Average Value
Number
Average Value
Number
Average Value
Number
Average Value
Number
Average Value
Number
Average Value
LOANS ORIGINATED
27
$84,070
24
$94,222
81
$108,473
24
$30,875
8
$83,465
6
$72,367
APPLICATIONS APPROVED, NOT ACCEPTED
0
$0
1
$201,750
7
$89,349
6
$23,638
0
$0
1
$105,460
APPLICATIONS DENIED
3
$107,387
4
$77,000
42
$98,250
27
$27,899
7
$22,763
1
$27,620
APPLICATIONS WITHDRAWN
2
$48,885
3
$170,897
19
$93,553
2
$35,340
2
$58,505
3
$115,943
FILES CLOSED FOR INCOMPLETENESS
0
$0
2
$147,750
0
$0
0
$0
0
$0
0
$0
Aggregated Statistics For Year 2008 (Based on 2 full and 4 partial tracts)
A) FHA, FSA/RHS & VA Home Purchase Loans
B) Conventional Home Purchase Loans
C) Refinancings
D) Home Improvement Loans
F) Non-occupant Loans on < 5 Family Dwellings (A B C & D)
G) Loans On Manufactured Home Dwelling (A B C & D)
Number
Average Value
Number
Average Value
Number
Average Value
Number
Average Value
Number
Average Value
Number
Average Value
LOANS ORIGINATED
14
$96,318
39
$92,284
65
$88,740
38
$34,843
16
$42,256
5
$65,588
APPLICATIONS APPROVED, NOT ACCEPTED
4
$63,462
7
$47,343
6
$117,790
4
$15,658
0
$0
3
$46,030
APPLICATIONS DENIED
4
$66,790
12
$104,777
64
$81,133
40
$22,108
2
$46,375
5
$63,252
APPLICATIONS WITHDRAWN
2
$68,420
4
$49,932
18
$128,513
4
$62,968
2
$31,730
0
$0
FILES CLOSED FOR INCOMPLETENESS
0
$0
3
$61,047
4
$170,532
0
$0
0
$0
1
$136,470
Aggregated Statistics For Year 2007 (Based on 2 full and 4 partial tracts)
A) FHA, FSA/RHS & VA Home Purchase Loans
B) Conventional Home Purchase Loans
C) Refinancings
D) Home Improvement Loans
E) Loans on Dwellings For 5+ Families
F) Non-occupant Loans on < 5 Family Dwellings (A B C & D)
G) Loans On Manufactured Home Dwelling (A B C & D)
Number
Average Value
Number
Average Value
Number
Average Value
Number
Average Value
Number
Average Value
Number
Average Value
Number
Average Value
LOANS ORIGINATED
6
$101,077
40
$115,818
92
$84,602
54
$23,995
1
$376,640
11
$58,432
10
$66,297
APPLICATIONS APPROVED, NOT ACCEPTED
0
$0
14
$77,338
30
$69,664
11
$29,543
0
$0
4
$35,698
6
$72,253
APPLICATIONS DENIED
4
$95,865
29
$63,918
132
$77,775
47
$32,349
0
$0
7
$32,314
23
$44,315
APPLICATIONS WITHDRAWN
1
$100,710
6
$71,397
39
$67,301
2
$7,875
0
$0
0
$0
5
$58,672
FILES CLOSED FOR INCOMPLETENESS
0
$0
0
$0
4
$118,230
0
$0
0
$0
0
$0
0
$0
Aggregated Statistics For Year 2006 (Based on 2 full and 4 partial tracts)
A) FHA, FSA/RHS & VA Home Purchase Loans
B) Conventional Home Purchase Loans
C) Refinancings
D) Home Improvement Loans
F) Non-occupant Loans on < 5 Family Dwellings (A B C & D)
G) Loans On Manufactured Home Dwelling (A B C & D)
Number
Average Value
Number
Average Value
Number
Average Value
Number
Average Value
Number
Average Value
Number
Average Value
LOANS ORIGINATED
15
$81,323
56
$93,739
94
$64,539
75
$29,907
3
$34,457
16
$40,911
APPLICATIONS APPROVED, NOT ACCEPTED
0
$0
5
$75,216
29
$118,042
15
$57,417
0
$0
3
$73,970
APPLICATIONS DENIED
1
$24,810
29
$60,105
185
$72,317
60
$36,132
4
$55,035
31
$46,746
APPLICATIONS WITHDRAWN
0
$0
5
$143,578
56
$84,933
11
$32,371
0
$0
1
$132,930
FILES CLOSED FOR INCOMPLETENESS
0
$0
4
$239,958
14
$71,518
0
$0
0
$0
0
$0
Aggregated Statistics For Year 2005 (Based on 2 full and 4 partial tracts)
A) FHA, FSA/RHS & VA Home Purchase Loans
B) Conventional Home Purchase Loans
C) Refinancings
D) Home Improvement Loans
F) Non-occupant Loans on < 5 Family Dwellings (A B C & D)
G) Loans On Manufactured Home Dwelling (A B C & D)
Number
Average Value
Number
Average Value
Number
Average Value
Number
Average Value
Number
Average Value
Number
Average Value
LOANS ORIGINATED
7
$79,109
66
$100,825
114
$79,829
53
$32,503
9
$41,732
14
$69,527
APPLICATIONS APPROVED, NOT ACCEPTED
2
$38,670
15
$70,925
52
$71,296
6
$13,947
2
$51,040
3
$44,903
APPLICATIONS DENIED
2
$166,425
51
$62,267
195
$71,532
66
$25,898
9
$53,857
58
$49,221
APPLICATIONS WITHDRAWN
1
$83,300
6
$117,182
91
$84,523
15
$117,297
1
$57,650
8
$72,990
FILES CLOSED FOR INCOMPLETENESS
0
$0
2
$63,580
12
$91,622
0
$0
1
$54,940
0
$0
Aggregated Statistics For Year 2004 (Based on 2 full and 4 partial tracts)
A) FHA, FSA/RHS & VA Home Purchase Loans
B) Conventional Home Purchase Loans
C) Refinancings
D) Home Improvement Loans
F) Non-occupant Loans on < 5 Family Dwellings (A B C & D)
G) Loans On Manufactured Home Dwelling (A B C & D)
Number
Average Value
Number
Average Value
Number
Average Value
Number
Average Value
Number
Average Value
Number
Average Value
LOANS ORIGINATED
12
$59,341
68
$86,395
160
$68,476
52
$31,552
16
$73,397
12
$34,796
APPLICATIONS APPROVED, NOT ACCEPTED
0
$0
4
$69,008
41
$55,943
10
$25,239
0
$0
3
$45,970
APPLICATIONS DENIED
0
$0
30
$48,875
242
$65,712
53
$21,743
1
$50,160
35
$32,595
APPLICATIONS WITHDRAWN
0
$0
5
$74,622
75
$68,274
8
$57,195
4
$36,428
5
$75,564
FILES CLOSED FOR INCOMPLETENESS
0
$0
3
$114,767
25
$95,787
3
$17,430
2
$71,395
0
$0
Aggregated Statistics For Year 2003 (Based on 2 full and 4 partial tracts)
A) FHA, FSA/RHS & VA Home Purchase Loans
B) Conventional Home Purchase Loans
C) Refinancings
D) Home Improvement Loans
F) Non-occupant Loans on < 5 Family Dwellings (A B C & D)
Number
Average Value
Number
Average Value
Number
Average Value
Number
Average Value
Number
Average Value
LOANS ORIGINATED
4
$103,402
69
$61,345
253
$67,671
52
$31,549
15
$36,886
APPLICATIONS APPROVED, NOT ACCEPTED
1
$121,610
11
$28,961
87
$52,479
17
$33,519
2
$39,665
APPLICATIONS DENIED
7
$68,659
44
$50,347
226
$62,218
44
$19,621
8
$43,180
APPLICATIONS WITHDRAWN
0
$0
3
$44,443
117
$79,565
13
$9,515
3
$34,797
FILES CLOSED FOR INCOMPLETENESS
0
$0
0
$0
13
$75,502
1
$27,060
2
$64,455
Aggregated Statistics For Year 2002 (Based on 2 full and 4 partial tracts)
A) FHA, FSA/RHS & VA Home Purchase Loans
B) Conventional Home Purchase Loans
C) Refinancings
D) Home Improvement Loans
F) Non-occupant Loans on < 5 Family Dwellings (A B C & D)
Number
Average Value
Number
Average Value
Number
Average Value
Number
Average Value
Number
Average Value
LOANS ORIGINATED
9
$55,211
97
$64,564
188
$67,412
45
$19,285
4
$31,348
APPLICATIONS APPROVED, NOT ACCEPTED
0
$0
24
$36,623
88
$73,059
8
$39,305
0
$0
APPLICATIONS DENIED
4
$59,000
45
$34,059
194
$61,363
50
$20,616
10
$38,966
APPLICATIONS WITHDRAWN
0
$0
5
$43,276
145
$70,759
10
$5,574
1
$43,420
FILES CLOSED FOR INCOMPLETENESS
0
$0
9
$47,731
21
$103,684
0
$0
3
$151,540
Aggregated Statistics For Year 2001 (Based on 2 full and 4 partial tracts)
A) FHA, FSA/RHS & VA Home Purchase Loans
B) Conventional Home Purchase Loans
C) Refinancings
D) Home Improvement Loans
E) Loans on Dwellings For 5+ Families
F) Non-occupant Loans on < 5 Family Dwellings (A B C & D)
Number
Average Value
Number
Average Value
Number
Average Value
Number
Average Value
Number
Average Value
Number
Average Value
LOANS ORIGINATED
8
$71,990
80
$64,019
227
$56,360
111
$16,281
2
$1,189,920
9
$47,806
APPLICATIONS APPROVED, NOT ACCEPTED
0
$0
15
$60,999
109
$50,653
25
$22,056
0
$0
1
$28,360
APPLICATIONS DENIED
0
$0
89
$35,282
212
$49,527
119
$14,782
0
$0
13
$29,172
APPLICATIONS WITHDRAWN
0
$0
8
$68,971
77
$59,882
30
$16,932
0
$0
2
$17,725
FILES CLOSED FOR INCOMPLETENESS
0
$0
3
$151,483
23
$65,448
1
$7,930
0
$0
0
$0
Aggregated Statistics For Year 2000 (Based on 2 full and 4 partial tracts)
A) FHA, FSA/RHS & VA Home Purchase Loans
B) Conventional Home Purchase Loans
C) Refinancings
D) Home Improvement Loans
E) Loans on Dwellings For 5+ Families
F) Non-occupant Loans on < 5 Family Dwellings (A B C & D)
Number
Average Value
Number
Average Value
Number
Average Value
Number
Average Value
Number
Average Value
Number
Average Value
LOANS ORIGINATED
17
$45,600
84
$55,229
113
$49,442
58
$15,404
2
$28,755
4
$126,662
APPLICATIONS APPROVED, NOT ACCEPTED
0
$0
34
$40,989
45
$56,125
32
$14,653
0
$0
2
$21,815
APPLICATIONS DENIED
2
$50,570
127
$35,112
144
$46,557
59
$19,525
0
$0
7
$32,693
APPLICATIONS WITHDRAWN
1
$26,590
14
$56,708
53
$44,454
3
$27,443
0
$0
4
$48,092
FILES CLOSED FOR INCOMPLETENESS
0
$0
0
$0
7
$57,117
0
$0
0
$0
0
$0
Aggregated Statistics For Year 1999 (Based on 1 full and 2 partial tracts)
A) FHA, FSA/RHS & VA Home Purchase Loans
B) Conventional Home Purchase Loans
C) Refinancings
D) Home Improvement Loans
F) Non-occupant Loans on < 5 Family Dwellings (A B C & D)
2004 - 2018 National Fire Incident Reporting System (NFIRS) incidents
According to the data from the years 2004 - 2018 the average number of fire incidents per year is 14. The highest number of fires - 43 took place in 2011, and the least - 0 in 2012. The data has an increasing trend.
When looking into fire subcategories, the most reports belonged to: Structure Fires (44.1%), and Other (29.9%).
Fire incident types reported to NFIRS in Zip Code 15431


 Nearest zip codes: 15456, 15455, 15425, 15489, 15445, 15421.


 According to the data from the years 2004 - 2018 the average number of fire incidents per year is 14. The highest number of fires - 43 took place in 2011, and the least - 0 in 2012. The data has an increasing trend.
 When looking into fire subcategories, the most reports belonged to: Structure Fires (44.1%), and Other (29.9%).