Estimated zip code population in 2022: 2,268 Zip code population in 2010: 2,221 Zip code population in 2000: 2,430
Houses and condos: 984 Renter-occupied apartments: 129
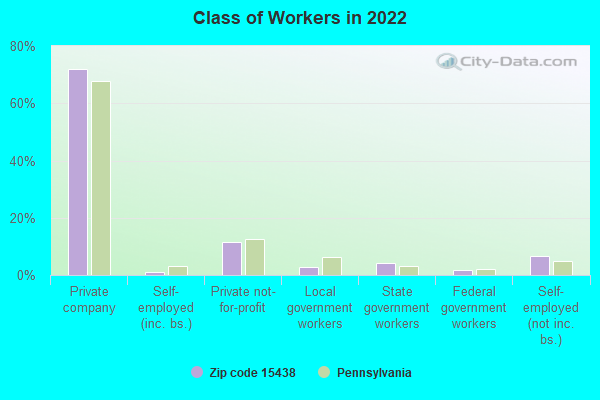
% of renters here:
14%
State:
31%
March 2022 cost of living index in zip code 15438: 87.0 (less than average, U.S. average is 100)
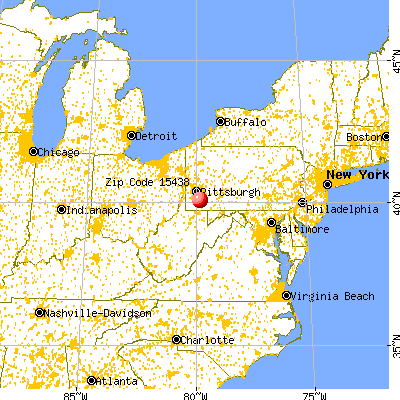
Land area: 11.5 sq. mi. Water area: 0.5 sq. mi.
Population density: 197 people per square mile
(very low).
OSM Map
General Map
Google Map
MSN Map
OSM Map
General Map
Google Map
MSN Map
OSM Map
General Map
Google Map
MSN Map
OSM Map
General Map
Google Map
MSN Map
Please wait while loading the map...
Real estate property taxes paid for housing units in 2022:
This zip code:
1.5% ($1,831)
Pennsylvania:
1.3% ($3,094)
Median real estate property taxes paid for housing units with mortgages in 2022: $1,871 (1.1%) Median real estate property taxes paid for housing units with no mortgage in 2022: $1,803 (1.7%)
Business Search- 14 Million verified businesses
Males: 1,174
(51.8%)
Females: 1,093
(48.2%)
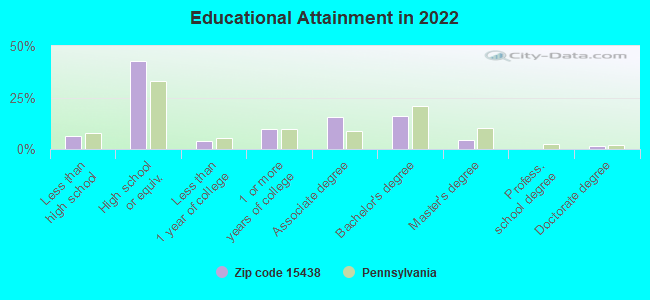
For population 25 years and over in 15438:
High school or higher: 92.4%
Bachelor's degree or higher: 21.7%
Graduate or professional degree: 5.7%
Unemployed: 5.0%
Mean travel time to work (commute): 30.5 minutes
For population 15 years and over in 15438:
Never married: 26.4%
Now married: 53.4%
Separated: 5.4%
Widowed: 5.5%
Divorced: 9.4%
Zip code 15438 compared to state average:
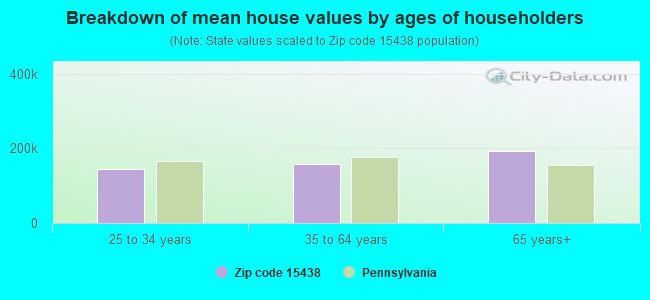
Median house value below state average.
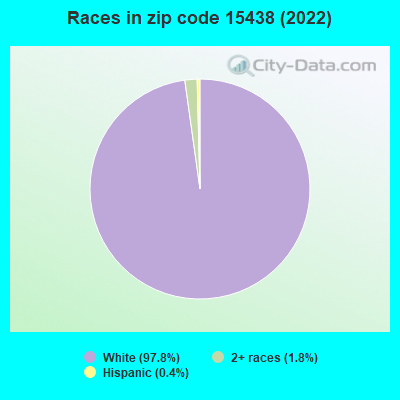
Black race population percentage significantly below state average.
Hispanic race population percentage significantly below state average.
Median age above state average.
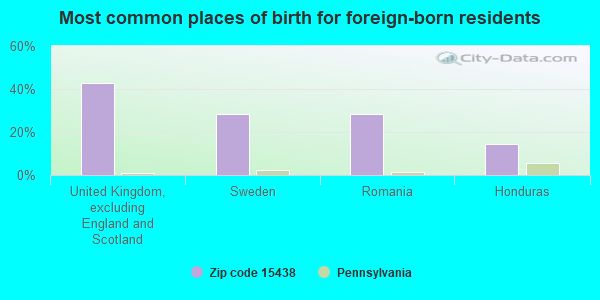
Foreign-born population percentage significantly below state average.
Renting percentage below state average.
Length of stay since moving in significantly above state average.
Number of college students significantly below state average.
Estimated median house/condo value in 2022: $126,006
15438:
$126,006
Pennsylvania:
$245,500
According to our research of Pennsylvania and other state lists, there was 1 registered sex offender living in 15438 zip code as of June 15, 2024. The ratio of all residents to sex offenders in zip code 15438 is 1,947 to 1. The ratio of registered sex offenders to all residents in this zip code is much lower than the state average.
Median resident age:
This zip code:
46.4 years
Pennsylvania median age:
40.9 years
Average household size:
This zip code:
2.4 people
Pennsylvania:
2.4 people
Averages for the 2020 tax year for zip code 15438, filed in 2021:
Average Adjusted Gross Income (AGI) in 2020: $56,034 (Individual Income Tax Returns)
Here:
$56,034
State:
$75,707
Salary/wage: $50,661 (reported on 76.7% of returns)
Here:
$50,661
State:
$62,806
(% of AGI for various income ranges: 988.7% for AGIs below $25k, 3092.5% for AGIs $25k-50k, 6043.3% for AGIs $50k-75k, 8303.8% for AGIs $75k-100k, 15971.8% for AGIs $100k-200k)
Taxable interest for individuals: $1,106 (reported on 30.1% of returns)
This zip code:
$1,106
Pennsylvania:
$1,633
(% of AGI for various income ranges: 31.2% for AGIs below $25k, 45.0% for AGIs $25k-50k, 13.3% for AGIs $50k-75k, 60.0% for AGIs $75k-100k, 103.6% for AGIs $100k-200k)
Ordinary dividends: $1,572 (reported on 17.5% of returns)
Here:
$1,572
State:
$7,382
(% of AGI for various income ranges: 10.4% for AGIs below $25k, 37.0% for AGIs $25k-50k, 28.3% for AGIs $50k-75k, 91.2% for AGIs $75k-100k, 70.0% for AGIs $100k-200k)
Net capital gain/loss in AGI: +$6,475 (reported on 11.7% of returns)
Here:
+$6,475
State:
+$23,522
(% of AGI for various income ranges: 22.0% for AGIs $25k-50k, 17.5% for AGIs $50k-75k, 158.8% for AGIs $75k-100k, 545.5% for AGIs $100k-200k)
Profit/loss from business: +$5,788 (reported on 7.8% of returns)
Here:
+$5,788
State:
+$16,274
(% of AGI for various income ranges: 25.0% for AGIs below $25k, 145.5% for AGIs $25k-50k, 140.0% for AGIs $75k-100k)
Taxable individual retirement arrangement distribution: $11,567 (reported on 11.7% of returns)
15438:
$11,567
Pennsylvania:
$18,583
(% of AGI for various income ranges: 61.3% for AGIs below $25k, 142.5% for AGIs $25k-50k, 494.2% for AGIs $50k-75k, 330.0% for AGIs $100k-200k)
Earned income credit: $1,823 (reported on 12.6% of returns)
Here:
$1,823
State:
$2,100
(% of AGI for various income ranges: 52.1% for AGIs below $25k, 56.0% for AGIs $25k-50k)
Percentage of individuals using paid preparers for their 2020 taxes: 91.3%
Here:
91%
State:
92%
(% for various income ranges: 91.2% for AGIs below $25k, 92.0% for AGIs $25k-50k, 88.2% for AGIs $50k-75k, 90.9% for AGIs $75k-100k, 93.8% for AGIs $100k-200k)
Averages for the 2012 tax year for zip code 15438, filed in 2013:
Average Adjusted Gross Income (AGI) in 2012: $48,273 (Individual Income Tax Returns)
Here:
$48,273
State:
$61,346
Salary/wage: $43,458 (reported on 79.8% of returns)
Here:
$43,458
State:
$51,902
(% of AGI for various income ranges: 60.7% for AGIs below $25k, 75.4% for AGIs $25k-50k, 74.6% for AGIs $50k-75k, 82.9% for AGIs $75k-100k, 65.0% for AGIs $100k-200k)
Taxable interest for individuals: $1,123 (reported on 37.5% of returns)
This zip code:
$1,123
Pennsylvania:
$1,588
(% of AGI for various income ranges: 2.1% for AGIs below $25k, 0.9% for AGIs $25k-50k, 1.0% for AGIs $50k-75k, 0.4% for AGIs $75k-100k, 0.7% for AGIs $100k-200k)
Ordinary dividends: $1,419 (reported on 20.2% of returns)
Here:
$1,419
State:
$5,827
(% of AGI for various income ranges: 1.4% for AGIs below $25k, 0.4% for AGIs $25k-50k, 0.6% for AGIs $50k-75k, 0.5% for AGIs $75k-100k, 0.5% for AGIs $100k-200k)
Net capital gain/loss in AGI: +$4,120 (reported on 9.6% of returns)
Here:
+$4,120
State:
+$14,495
(% of AGI for various income ranges: 0.2% for AGIs below $25k, 2.0% for AGIs $50k-75k, 1.2% for AGIs $100k-200k)
Profit/loss from business: +$6,664 (reported on 10.6% of returns)
Here:
+$6,664
State:
+$16,268
(% of AGI for various income ranges: 4.5% for AGIs below $25k, 3.2% for AGIs $25k-50k, 1.0% for AGIs $50k-75k, 1.2% for AGIs $75k-100k)
Taxable individual retirement arrangement distribution: $10,607 (reported on 13.5% of returns)
15438:
$10,607
Pennsylvania:
$14,550
(% of AGI for various income ranges: 5.2% for AGIs below $25k, 2.5% for AGIs $25k-50k, 3.9% for AGIs $50k-75k, 6.3% for AGIs $75k-100k)
Total itemized deductions: $18,140 (19% of AGI, reported on 19.2% of returns)
Here:
$18,140
State:
$23,538
Here:
19.1% of AGI
State:
18.4% of AGI
(% of AGI for various income ranges: 7.3% for AGIs $25k-50k, 7.1% for AGIs $50k-75k, 6.3% for AGIs $75k-100k, 10.0% for AGIs $100k-200k)
Charity contributions: $2,933 (reported on 14.4% of returns)
Here:
$2,933
State:
$4,025
(% of AGI for various income ranges: 0.6% for AGIs $25k-50k, 0.9% for AGIs $50k-75k, 0.9% for AGIs $75k-100k, 1.3% for AGIs $100k-200k)
Taxes paid: $6,305 (reported on 18.3% of returns)
15438:
$6,305
State:
$9,982
(% of AGI for various income ranges: 1.5% for AGIs $25k-50k, 2.0% for AGIs $50k-75k, 2.3% for AGIs $75k-100k, 3.9% for AGIs $100k-200k)
Earned income credit: $2,077 (reported on 12.5% of returns)
Here:
$2,077
State:
$2,106
(% of AGI for various income ranges: 3.9% for AGIs below $25k, 0.9% for AGIs $25k-50k)
Percentage of individuals using paid preparers for their 2012 taxes: 52.9%
Here:
53%
State:
53%
(% for various income ranges: 51.2% for AGIs below $25k, 48.0% for AGIs $25k-50k, 58.8% for AGIs $50k-75k, 54.5% for AGIs $75k-100k, 60.0% for AGIs $100k-200k)
Averages for the 2004 tax year for zip code 15438, filed in 2005:
Average Adjusted Gross Income (AGI) in 2004: $35,245 (Individual Income Tax Returns)
Here:
$35,245
State:
$48,049
Salary/wage: $34,585 (reported on 80.3% of returns)
Here:
$34,585
State:
$42,646
(% of AGI for various income ranges: 119.4% for AGIs below $10k, 64.6% for AGIs $10k-25k, 79.8% for AGIs $25k-50k, 82.6% for AGIs $50k-75k, 82.6% for AGIs $75k-100k, 73.2% for AGIs over 100k)
Taxable interest for individuals: $1,264 (reported on 51.7% of returns)
This zip code:
$1,264
Pennsylvania:
$1,657
(% of AGI for various income ranges: 12.1% for AGIs below $10k, 3.2% for AGIs $10k-25k, 2.5% for AGIs $25k-50k, 0.9% for AGIs $50k-75k, 1.2% for AGIs $75k-100k, 0.9% for AGIs over 100k)
Taxable dividends: $1,109 (reported on 24.2% of returns)
Here:
$1,109
State:
$3,566
(% of AGI for various income ranges: 3.0% for AGIs below $10k, 1.0% for AGIs $10k-25k, 0.5% for AGIs $25k-50k, 1.1% for AGIs $50k-75k, 0.5% for AGIs $75k-100k, 0.5% for AGIs over 100k)
Net capital gain/loss: +$707 (reported on 13.6% of returns)
Here:
+$707
State:
+$9,716
(% of AGI for various income ranges: -2.2% for AGIs below $10k, 0.4% for AGIs $10k-25k, 0.1% for AGIs $25k-50k, 0.5% for AGIs $50k-75k, 0.0% for AGIs $75k-100k, 0.7% for AGIs over 100k)
Profit/loss from business: +$3,705 (reported on 11.1% of returns)
Here:
+$3,705
State:
+$14,267
(% of AGI for various income ranges: 14.1% for AGIs below $10k, 4.0% for AGIs $10k-25k, 1.5% for AGIs $25k-50k, 0.5% for AGIs $50k-75k, -0.6% for AGIs $75k-100k)
IRA payment deduction: $3,259 (reported on 2.5% of returns)
15438:
$3,259
Pennsylvania:
$2,903
Total itemized deductions: $14,585 (21% of AGI, reported on 17.5% of returns)
Here:
$14,585
State:
$18,804
Here:
20.9% of AGI
State:
19.5% of AGI
(% of AGI for various income ranges: 4.0% for AGIs $10k-25k, 5.1% for AGIs $25k-50k, 6.9% for AGIs $50k-75k, 9.9% for AGIs $75k-100k, 12.4% for AGIs over 100k)
Charity contributions deductions: $2,269 (3% of AGI, reported on 15.5% of returns)
Here:
$2,269
State:
$3,337
Here:
3.2% of AGI
State:
3.3% of AGI
(% of AGI for various income ranges: 0.5% for AGIs $10k-25k, 0.6% for AGIs $25k-50k, 1.2% for AGIs $50k-75k, 1.2% for AGIs $75k-100k, 1.5% for AGIs over 100k)
Total tax: $4,310 (reported on 74.2% of returns)
15438:
$4,310
State:
$8,008
(% of AGI for various income ranges: 3.4% for AGIs below $10k, 4.2% for AGIs $10k-25k, 6.5% for AGIs $25k-50k, 8.8% for AGIs $50k-75k, 11.3% for AGIs $75k-100k, 16.5% for AGIs over 100k)
Earned income credit: $1,591 (reported on 12.4% of returns)
Here:
$1,591
State:
$1,643
Percentage of individuals using paid preparers for their 2004 taxes: 53.0%
Here:
53%
State:
56%
(% for various income ranges: 40.8% for AGIs below $10k, 50.9% for AGIs $10k-25k, 57.8% for AGIs $25k-50k, 55.2% for AGIs $50k-75k, 66.2% for AGIs $75k-100k, 73.2% for AGIs over 100k)
Household received Food Stamps/SNAP in the past 12 months: 255 Household did not receive Food Stamps/SNAP in the past 12 months: 659
Women who had a birth in the past 12 months: 31 (33 now married, 0 unmarried) Women who did not have a birth in the past 12 months: 358 (195 now married, 160 unmarried)
Housing units in zip code 15438 with a mortgage: 399 (37 second mortgage, 37 both second mortgage and home equity loan) Houses without a mortgage: 74
Median monthly owner costs for units with a mortgage: $1,158 Median monthly owner costs for units without a mortgage: $512
Residents with income below the poverty level in 2022:
This zip code:
15.7%
Whole state:
11.8%
Residents with income below 50% of the poverty level in 2022:
This zip code:
7.6%
Whole state:
6.1%
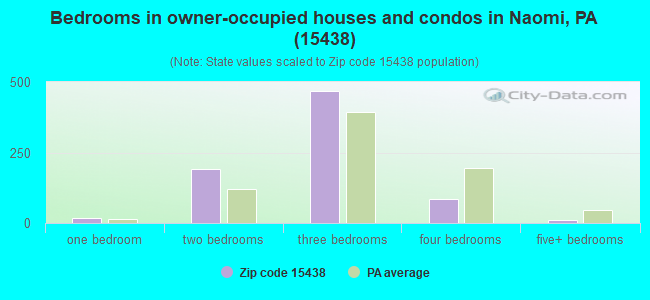
Median number of rooms in houses and condos:
Here:
6.1
State:
6.8
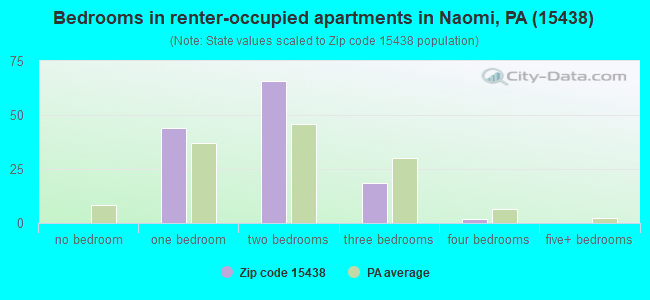
Median number of rooms in apartments:
Here:
4.3
State:
4.3
Notable locations in this zip code not listed on our city pages
Streams, rivers, and creeks: Lamb Lick Run (A), Mill Run (B), Downers Run (C), Lutz Run (D), Little Redstone Creek (E). Display/hide their locations on the map
In group quarters: 49 (-1 institutionalized population)
Size of family households: 299 2-persons, 135 3-persons, 147 4-persons, 14 5-persons, 20 6-persons, 18 7-or-more-persons
Size of nonfamily households: 234 1-person, 32 2-persons
273 married couples with children.
24 single-parent households (13 men, 11 women).
97.4% of residents of 15438 zip code speak English at home.
0.6% of residents speak Spanish at home (100% very well).
0.2% of residents speak other Indo-European language at home (100% very well).
0.8% of residents speak other language at home (100% very well).
Foreign born population: 7 (0.3%) (86.2% of them are naturalized citizens)
This zip code:
0.3%
Whole state:
7.5%
43%United Kingdom, excluding England and Scotland
29%Sweden
29%Romania
14%Honduras
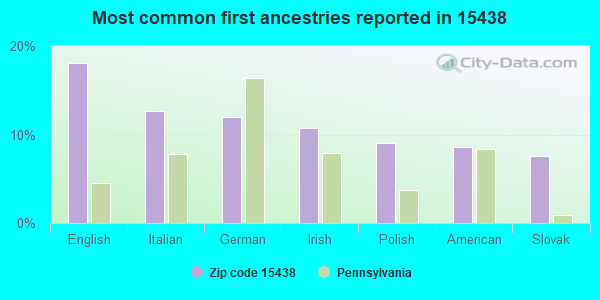
18%English
13%Italian
12%German
11%Irish
9%Polish
9%American
8%Slovak
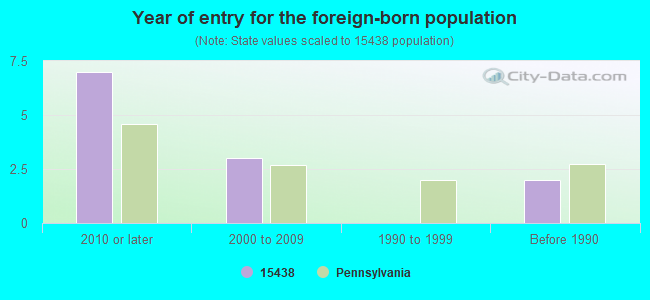
Year of entry for the foreign-born population
72010 or later
32000 to 2009
01990 to 1999
2Before 1990
Housing units lacking complete plumbing facilities: 3.7% Housing units lacking complete kitchen facilities: 1.2%
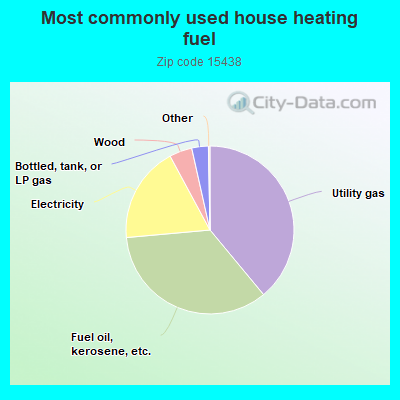
39.1%Utility gas
34.7%Fuel oil, kerosene, etc.
18.6%Electricity
4.4%Wood
3.2%Bottled, tank, or LP gas
Population in 1990: 921. Population change in the 1990s: +1,509 (+163.8%).
Place of birth for U.S.-born residents:
This state: 2,030
Northeast: 41
Midwest: 48
South: 93
West: 25
73% of the 15438 zip code residents lived in the same house 5 years ago. Out of people who lived in different houses, 47% lived in this county. Out of people who lived in different counties, 50% lived in Pennsylvania.
96% of the 15438 zip code residents lived in the same house 1 year ago. Out of people who lived in different houses, 25% moved from this county. Out of people who lived in different houses, 24% moved from different county within same state. Out of people who lived in different houses, 57% moved from different state.
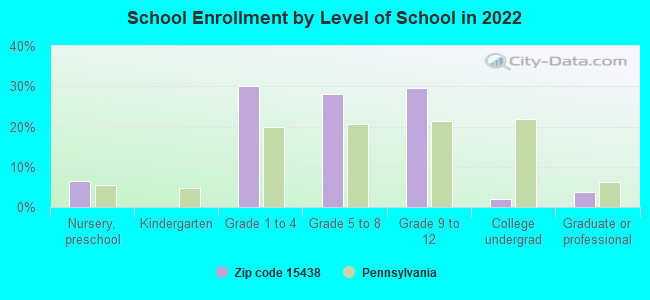
Private vs. public school enrollment:
Students in private schools in grades 1 to 8 (elementary and middle school):
Here:
0.0%
Pennsylvania:
15.7%
Students in private schools in grades 9 to 12 (high school):
Here:
0.0%
Pennsylvania:
13.4%
Students in private undergraduate colleges: 1
Here:
22.3%
Pennsylvania:
39.8%
Occupation by median earnings in the past 12 months ($)
99,564Construction and extraction occupations
85,925Computer and mathematical occupations
77,356Architecture and engineering occupations
76,899Installation, maintenance, and repair occupations
69,569Material moving occupations
62,789Education, training, and library occupations
Top industries in this zip code by the number of employees in 2005:
Health Care and Social Assistance: Homes for the Elderly (20-49 employees: 1 establishment)
Other Services (except Public Administration): Automotive Body, Paint, and Interior Repair and Maintenance (10-19: 1)
Other Services (except Public Administration): Labor Unions and Similar Labor Organizations (10-19: 1)
Accommodation and Food Services: Full-Service Restaurants (10-19: 1)
Health Care and Social Assistance: Offices of Physicians (except Mental Health Specialists) (5-9: 1)
Professional, Scientific, and Technical Services: Veterinary Services (5-9: 1)
Construction: New Single-Family Housing Construction (except Operative Builders) (1-4: 3)
People in group quarters in 2010:
50 people in nursing facilities/skilled-nursing facilities
People in group quarters in 2000:
70 people in other nonhousehold living situations
Fatal accident statistics in 2014:
Fatal accident count: 1
Vehicles involved in fatal accidents: 1
Fatal accidents caused by drunken drivers: 0
Fatalities: 1
Persons involved in fatal accidents: 1
Pedestrians involved in fatal accidents: 0
Home Mortgage Disclosure Act Aggregated Statistics For Year 2009 (Based on 4 partial tracts)
A) FHA, FSA/RHS & VA Home Purchase Loans
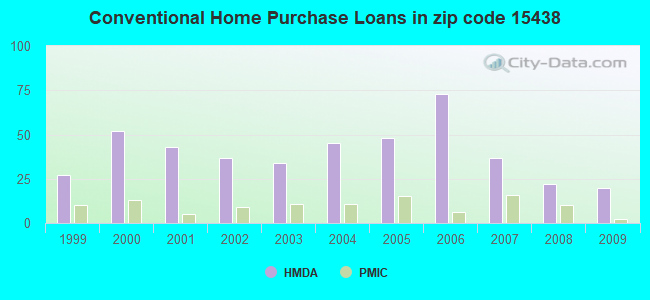
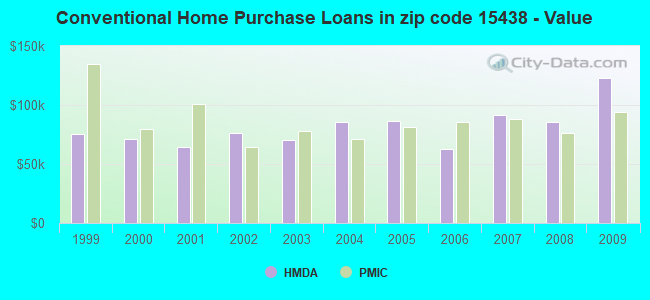
B) Conventional Home Purchase Loans
C) Refinancings
D) Home Improvement Loans
E) Loans on Dwellings For 5+ Families
F) Non-occupant Loans on < 5 Family Dwellings (A B C & D)
G) Loans On Manufactured Home Dwelling (A B C & D)
Number
Average Value
Number
Average Value
Number
Average Value
Number
Average Value
Number
Average Value
Number
Average Value
Number
Average Value
LOANS ORIGINATED
20
$85,258
20
$123,234
51
$116,546
18
$27,673
0
$0
6
$53,207
1
$108,140
APPLICATIONS APPROVED, NOT ACCEPTED
1
$85,020
1
$70,850
7
$91,763
2
$12,990
0
$0
0
$0
0
$0
APPLICATIONS DENIED
2
$102,335
4
$71,425
44
$102,473
7
$25,961
1
$106,270
4
$62,822
1
$28,340
APPLICATIONS WITHDRAWN
1
$40,880
3
$104,287
19
$108,735
2
$28,835
0
$0
1
$18,110
1
$184,220
FILES CLOSED FOR INCOMPLETENESS
0
$0
0
$0
6
$138,340
1
$196,720
0
$0
2
$140,190
0
$0
Aggregated Statistics For Year 2008 (Based on 4 partial tracts)
A) FHA, FSA/RHS & VA Home Purchase Loans
B) Conventional Home Purchase Loans
C) Refinancings
D) Home Improvement Loans
F) Non-occupant Loans on < 5 Family Dwellings (A B C & D)
G) Loans On Manufactured Home Dwelling (A B C & D)
Number
Average Value
Number
Average Value
Number
Average Value
Number
Average Value
Number
Average Value
Number
Average Value
LOANS ORIGINATED
16
$87,632
22
$85,722
46
$92,054
13
$38,098
9
$50,720
1
$118,210
APPLICATIONS APPROVED, NOT ACCEPTED
0
$0
4
$58,952
7
$53,790
5
$30,486
1
$16,480
2
$72,640
APPLICATIONS DENIED
1
$133,180
6
$68,682
64
$86,496
21
$50,013
1
$69,140
5
$72,798
APPLICATIONS WITHDRAWN
2
$110,600
5
$67,070
15
$120,921
1
$19,780
0
$0
0
$0
FILES CLOSED FOR INCOMPLETENESS
1
$64,550
1
$55,100
4
$114,748
1
$9,450
0
$0
0
$0
Aggregated Statistics For Year 2007 (Based on 4 partial tracts)
A) FHA, FSA/RHS & VA Home Purchase Loans
B) Conventional Home Purchase Loans
C) Refinancings
D) Home Improvement Loans
F) Non-occupant Loans on < 5 Family Dwellings (A B C & D)
G) Loans On Manufactured Home Dwelling (A B C & D)
Number
Average Value
Number
Average Value
Number
Average Value
Number
Average Value
Number
Average Value
Number
Average Value
LOANS ORIGINATED
8
$94,805
37
$91,150
64
$75,534
29
$35,764
10
$54,793
3
$41,393
APPLICATIONS APPROVED, NOT ACCEPTED
0
$0
6
$73,577
19
$112,136
5
$51,450
1
$107,680
1
$45,660
APPLICATIONS DENIED
1
$50,110
15
$62,303
91
$82,013
36
$32,436
6
$58,383
6
$56,700
APPLICATIONS WITHDRAWN
0
$0
5
$79,416
19
$76,672
2
$32,210
0
$0
0
$0
FILES CLOSED FOR INCOMPLETENESS
0
$0
1
$62,980
10
$92,238
1
$17,320
1
$163,740
0
$0
Aggregated Statistics For Year 2006 (Based on 4 partial tracts)
A) FHA, FSA/RHS & VA Home Purchase Loans
B) Conventional Home Purchase Loans
C) Refinancings
D) Home Improvement Loans
F) Non-occupant Loans on < 5 Family Dwellings (A B C & D)
G) Loans On Manufactured Home Dwelling (A B C & D)
Number
Average Value
Number
Average Value
Number
Average Value
Number
Average Value
Number
Average Value
Number
Average Value
LOANS ORIGINATED
6
$58,940
73
$62,639
94
$67,711
22
$23,048
6
$71,240
1
$158,920
APPLICATIONS APPROVED, NOT ACCEPTED
1
$28,350
15
$80,103
26
$66,532
4
$54,330
2
$29,125
0
$0
APPLICATIONS DENIED
0
$0
14
$65,649
95
$76,506
30
$33,139
3
$59,927
4
$75,050
APPLICATIONS WITHDRAWN
0
$0
7
$82,161
52
$80,129
3
$19,550
1
$7,870
0
$0
FILES CLOSED FOR INCOMPLETENESS
0
$0
2
$68,485
8
$75,816
1
$14,960
1
$62,980
0
$0
Aggregated Statistics For Year 2005 (Based on 4 partial tracts)
A) FHA, FSA/RHS & VA Home Purchase Loans
B) Conventional Home Purchase Loans
C) Refinancings
D) Home Improvement Loans
E) Loans on Dwellings For 5+ Families
F) Non-occupant Loans on < 5 Family Dwellings (A B C & D)
G) Loans On Manufactured Home Dwelling (A B C & D)
Number
Average Value
Number
Average Value
Number
Average Value
Number
Average Value
Number
Average Value
Number
Average Value
Number
Average Value
LOANS ORIGINATED
7
$63,703
48
$86,433
89
$69,381
30
$41,226
1
$70,850
7
$45,653
2
$39,565
APPLICATIONS APPROVED, NOT ACCEPTED
2
$32,975
5
$81,482
22
$74,853
4
$38,462
0
$0
0
$0
2
$66,910
APPLICATIONS DENIED
2
$68,730
17
$171,065
122
$80,843
19
$19,381
0
$0
7
$29,359
6
$65,438
APPLICATIONS WITHDRAWN
1
$85,800
11
$161,002
48
$94,685
8
$97,612
0
$0
3
$79,493
3
$75,060
FILES CLOSED FOR INCOMPLETENESS
1
$74,000
1
$79,130
11
$84,374
0
$0
0
$0
0
$0
1
$74,000
Aggregated Statistics For Year 2004 (Based on 4 partial tracts)
A) FHA, FSA/RHS & VA Home Purchase Loans
B) Conventional Home Purchase Loans
C) Refinancings
D) Home Improvement Loans
F) Non-occupant Loans on < 5 Family Dwellings (A B C & D)
G) Loans On Manufactured Home Dwelling (A B C & D)
Number
Average Value
Number
Average Value
Number
Average Value
Number
Average Value
Number
Average Value
Number
Average Value
LOANS ORIGINATED
9
$75,098
45
$85,561
107
$73,613
33
$29,646
8
$49,042
4
$42,555
APPLICATIONS APPROVED, NOT ACCEPTED
1
$52,090
9
$97,024
23
$78,810
11
$45,644
2
$49,100
3
$43,183
APPLICATIONS DENIED
1
$38,570
20
$79,800
119
$82,546
31
$22,376
12
$36,998
9
$65,386
APPLICATIONS WITHDRAWN
1
$48,020
9
$95,834
58
$89,156
4
$58,995
1
$78,720
1
$128,220
FILES CLOSED FOR INCOMPLETENESS
0
$0
0
$0
12
$65,716
2
$43,420
0
$0
0
$0
Aggregated Statistics For Year 2003 (Based on 4 partial tracts)
A) FHA, FSA/RHS & VA Home Purchase Loans
B) Conventional Home Purchase Loans
C) Refinancings
D) Home Improvement Loans
F) Non-occupant Loans on < 5 Family Dwellings (A B C & D)
Number
Average Value
Number
Average Value
Number
Average Value
Number
Average Value
Number
Average Value
LOANS ORIGINATED
10
$66,801
34
$70,614
149
$77,295
39
$28,630
7
$38,179
APPLICATIONS APPROVED, NOT ACCEPTED
1
$25,190
6
$106,770
37
$70,364
6
$40,558
1
$660
APPLICATIONS DENIED
1
$71,640
6
$42,068
151
$70,700
24
$20,625
8
$36,941
APPLICATIONS WITHDRAWN
0
$0
4
$66,975
45
$83,963
2
$53,925
1
$26,380
FILES CLOSED FOR INCOMPLETENESS
0
$0
0
$0
19
$93,755
0
$0
0
$0
Aggregated Statistics For Year 2002 (Based on 4 partial tracts)
A) FHA, FSA/RHS & VA Home Purchase Loans
B) Conventional Home Purchase Loans
C) Refinancings
D) Home Improvement Loans
F) Non-occupant Loans on < 5 Family Dwellings (A B C & D)
Number
Average Value
Number
Average Value
Number
Average Value
Number
Average Value
Number
Average Value
LOANS ORIGINATED
9
$61,166
37
$76,039
127
$66,106
21
$27,201
6
$48,438
APPLICATIONS APPROVED, NOT ACCEPTED
1
$11,210
7
$70,431
29
$75,152
2
$46,445
1
$71,640
APPLICATIONS DENIED
1
$83,990
14
$78,955
90
$66,032
18
$34,248
3
$83,603
APPLICATIONS WITHDRAWN
0
$0
2
$47,230
35
$68,540
3
$29,207
0
$0
FILES CLOSED FOR INCOMPLETENESS
0
$0
3
$43,300
9
$88,342
0
$0
3
$61,103
Aggregated Statistics For Year 2001 (Based on 4 partial tracts)
A) FHA, FSA/RHS & VA Home Purchase Loans
B) Conventional Home Purchase Loans
C) Refinancings
D) Home Improvement Loans
F) Non-occupant Loans on < 5 Family Dwellings (A B C & D)
Number
Average Value
Number
Average Value
Number
Average Value
Number
Average Value
Number
Average Value
LOANS ORIGINATED
7
$68,121
43
$64,043
130
$63,118
40
$33,273
6
$86,523
APPLICATIONS APPROVED, NOT ACCEPTED
0
$0
12
$36,169
47
$55,545
10
$33,665
1
$16,440
APPLICATIONS DENIED
0
$0
17
$43,745
92
$56,339
33
$19,324
3
$48,203
APPLICATIONS WITHDRAWN
1
$49,590
9
$114,984
30
$67,639
5
$16,836
0
$0
FILES CLOSED FOR INCOMPLETENESS
0
$0
0
$0
9
$70,126
1
$11,810
0
$0
Aggregated Statistics For Year 2000 (Based on 4 partial tracts)
A) FHA, FSA/RHS & VA Home Purchase Loans
B) Conventional Home Purchase Loans
C) Refinancings
D) Home Improvement Loans
F) Non-occupant Loans on < 5 Family Dwellings (A B C & D)
Number
Average Value
Number
Average Value
Number
Average Value
Number
Average Value
Number
Average Value
LOANS ORIGINATED
7
$56,639
52
$71,143
81
$49,018
25
$42,653
1
$68,140
APPLICATIONS APPROVED, NOT ACCEPTED
1
$99,190
9
$37,097
25
$49,838
15
$24,073
1
$20,470
APPLICATIONS DENIED
0
$0
53
$33,396
61
$56,262
36
$19,554
1
$89,740
APPLICATIONS WITHDRAWN
0
$0
2
$79,115
22
$55,603
2
$21,650
2
$35,030
FILES CLOSED FOR INCOMPLETENESS
0
$0
2
$39,400
12
$74,896
0
$0
1
$20,470
Aggregated Statistics For Year 1999 (Based on 2 partial tracts)
A) FHA, FSA/RHS & VA Home Purchase Loans
B) Conventional Home Purchase Loans
C) Refinancings
D) Home Improvement Loans
F) Non-occupant Loans on < 5 Family Dwellings (A B C & D)


 Nearest zip codes: 15477, 15483, 15412, 15434, 15466, 15432.