Estimated zip code population in 2022: 1,242 Zip code population in 2010: 1,387 Zip code population in 2000: 1,303
Houses and condos: 1,912 Renter-occupied apartments: 66
% of renters here:
11%
State:
31%
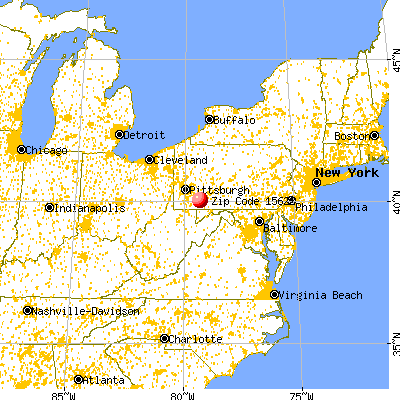
March 2022 cost of living index in zip code 15622: 86.2 (less than average, U.S. average is 100)
Land area: 32.4 sq. mi. Water area: 0.0 sq. mi.
Population density: 38 people per square mile
(very low).
OSM Map
General Map
Google Map
MSN Map
OSM Map
General Map
Google Map
MSN Map
OSM Map
General Map
Google Map
MSN Map
OSM Map
General Map
Google Map
MSN Map
Please wait while loading the map...
Real estate property taxes paid for housing units in 2022:
This zip code:
0.8% ($1,952)
Pennsylvania:
1.3% ($3,094)
Median real estate property taxes paid for housing units with mortgages in 2022: $1,921 (0.8%) Median real estate property taxes paid for housing units with no mortgage in 2022: $2,027 (0.8%)
Business Search- 14 Million verified businesses
Males: 668
(53.8%)
Females: 573
(46.2%)
For population 25 years and over in 15622:
High school or higher: 92.5%
Bachelor's degree or higher: 38.5%
Graduate or professional degree: 18.8%
Unemployed: 10.6%
Mean travel time to work (commute): 34.9 minutes
For population 15 years and over in 15622:
Never married: 29.1%
Now married: 61.4%
Separated: 0.2%
Widowed: 6.9%
Divorced: 2.4%
Zip code 15622 compared to state average:
Unemployed percentage above state average.
Black race population percentage significantly below state average.
Hispanic race population percentage significantly below state average.
Median age significantly above state average.
Renting percentage significantly below state average.
Length of stay since moving in significantly above state average.
Estimated median house/condo value in 2022: $248,213
15622:
$248,213
Pennsylvania:
$245,500
According to our research of Pennsylvania and other state lists, there was 1 registered sex offender living in 15622 zip code as of June 16, 2024. The ratio of all residents to sex offenders in zip code 15622 is 1,059 to 1. The ratio of registered sex offenders to all residents in this zip code is lower than the state average.
Median resident age:
This zip code:
56.3 years
Pennsylvania median age:
40.9 years
Average household size:
This zip code:
2.1 people
Pennsylvania:
2.4 people
Averages for the 2020 tax year for zip code 15622, filed in 2021:
Average Adjusted Gross Income (AGI) in 2020: $105,650 (Individual Income Tax Returns)
Here:
$105,650
State:
$75,707
Salary/wage: $67,244 (reported on 68.3% of returns)
Here:
$67,244
State:
$62,806
(% of AGI for various income ranges: 937.3% for AGIs below $25k, 3317.8% for AGIs $25k-50k, 4711.7% for AGIs $50k-75k, 8886.7% for AGIs $75k-100k, 11514.3% for AGIs $100k-200k)
Taxable interest for individuals: $2,664 (reported on 41.7% of returns)
This zip code:
$2,664
Pennsylvania:
$1,633
(% of AGI for various income ranges: 11.8% for AGIs below $25k, 16.7% for AGIs $25k-50k, 95.0% for AGIs $50k-75k, 156.7% for AGIs $75k-100k, 168.6% for AGIs $100k-200k)
Ordinary dividends: $18,406 (reported on 30.0% of returns)
Here:
$18,406
State:
$7,382
(% of AGI for various income ranges: 65.5% for AGIs below $25k, 135.6% for AGIs $25k-50k, 211.7% for AGIs $50k-75k, 356.7% for AGIs $75k-100k, 508.6% for AGIs $100k-200k)
Net capital gain/loss in AGI: +$16,106 (reported on 26.7% of returns)
Here:
+$16,106
State:
+$23,522
(% of AGI for various income ranges: 74.4% for AGIs $25k-50k, 253.3% for AGIs $50k-75k, 1054.3% for AGIs $100k-200k)
Profit/loss from business: +$23,643 (reported on 11.7% of returns)
Here:
+$23,643
State:
+$16,274
(% of AGI for various income ranges: 137.3% for AGIs below $25k, 2148.6% for AGIs $100k-200k)
Taxable individual retirement arrangement distribution: $21,500 (reported on 16.7% of returns)
15622:
$21,500
Pennsylvania:
$18,583
(% of AGI for various income ranges: 299.1% for AGIs below $25k, 613.3% for AGIs $50k-75k, 2075.7% for AGIs $100k-200k)
Total itemized deductions: $41,725 (reported on 6.7% of returns)
Here:
$41,725
State:
$34,850
(% of AGI for various income ranges: 2384.3% for AGIs $100k-200k)
Charity contributions: $26,733 (reported on 5.0% of returns)
Here:
$26,733
State:
$12,392
(% of AGI for various income ranges: 1145.7% for AGIs $100k-200k)
Taxes paid: $8,375 (reported on 6.7% of returns)
15622:
$8,375
State:
$8,200
(% of AGI for various income ranges: 478.6% for AGIs $100k-200k)
Earned income credit: $1,320 (reported on 8.3% of returns)
Here:
$1,320
State:
$2,100
(% of AGI for various income ranges: 60.0% for AGIs below $25k)
Percentage of individuals using paid preparers for their 2020 taxes: 90.0%
Here:
90%
State:
92%
(% for various income ranges: 88.2% for AGIs below $25k, 92.9% for AGIs $25k-50k, 88.9% for AGIs $50k-75k, 80.0% for AGIs $75k-100k, 90.9% for AGIs $100k-200k, 100.0% for AGIs over 200k)
Averages for the 2012 tax year for zip code 15622, filed in 2013:
Average Adjusted Gross Income (AGI) in 2012: $75,659 (Individual Income Tax Returns)
Here:
$75,659
State:
$61,346
Salary/wage: $47,477 (reported on 80.3% of returns)
Here:
$47,477
State:
$51,902
(% of AGI for various income ranges: 69.2% for AGIs below $25k, 69.2% for AGIs $25k-50k, 66.0% for AGIs $50k-75k, 69.3% for AGIs $75k-100k, 62.7% for AGIs $100k-200k, 31.0% for AGIs over 200k)
Taxable interest for individuals: $2,977 (reported on 39.4% of returns)
This zip code:
$2,977
Pennsylvania:
$1,588
(% of AGI for various income ranges: 1.2% for AGIs below $25k, 0.6% for AGIs $25k-50k, 0.6% for AGIs $50k-75k, 0.7% for AGIs $75k-100k, 1.2% for AGIs $100k-200k, 2.4% for AGIs over 200k)
Ordinary dividends: $10,975 (reported on 24.2% of returns)
Here:
$10,975
State:
$5,827
(% of AGI for various income ranges: 2.3% for AGIs below $25k, 2.0% for AGIs $25k-50k, 2.3% for AGIs $50k-75k, 2.0% for AGIs $75k-100k, 3.3% for AGIs $100k-200k, 4.8% for AGIs over 200k)
Net capital gain/loss in AGI: +$13,275 (reported on 18.2% of returns)
Here:
+$13,275
State:
+$14,495
(% of AGI for various income ranges: 0.4% for AGIs $50k-75k, 1.2% for AGIs $100k-200k, 6.5% for AGIs over 200k)
Profit/loss from business: +$15,933 (reported on 13.6% of returns)
Here:
+$15,933
State:
+$16,268
(% of AGI for various income ranges: 12.7% for AGIs below $25k, 3.8% for AGIs $50k-75k, 10.3% for AGIs $100k-200k)
Taxable individual retirement arrangement distribution: $20,225 (reported on 12.1% of returns)
15622:
$20,225
Pennsylvania:
$14,550
Total itemized deductions: $27,524 (14% of AGI, reported on 25.8% of returns)
Here:
$27,524
State:
$23,538
Here:
14.1% of AGI
State:
18.4% of AGI
(% of AGI for various income ranges: 10.2% for AGIs $25k-50k, 9.0% for AGIs $50k-75k, 11.6% for AGIs $75k-100k, 11.8% for AGIs $100k-200k, 9.3% for AGIs over 200k)
Charity contributions: $5,064 (reported on 21.2% of returns)
Here:
$5,064
State:
$4,025
(% of AGI for various income ranges: 0.8% for AGIs below $25k, 1.4% for AGIs $50k-75k, 0.8% for AGIs $75k-100k, 1.5% for AGIs $100k-200k, 2.0% for AGIs over 200k)
Taxes paid: $11,276 (reported on 25.8% of returns)
15622:
$11,276
State:
$9,982
(% of AGI for various income ranges: 2.5% for AGIs $25k-50k, 2.7% for AGIs $50k-75k, 3.9% for AGIs $75k-100k, 4.5% for AGIs $100k-200k, 4.8% for AGIs over 200k)
Earned income credit: $1,900 (reported on 12.1% of returns)
Here:
$1,900
State:
$2,106
(% of AGI for various income ranges: 3.6% for AGIs below $25k, 0.7% for AGIs $25k-50k)
Percentage of individuals using paid preparers for their 2012 taxes: 65.2%
Here:
65%
State:
53%
(% for various income ranges: 63.0% for AGIs below $25k, 60.0% for AGIs $25k-50k, 66.7% for AGIs $50k-75k, 66.7% for AGIs $75k-100k, 66.7% for AGIs $100k-200k, 100.0% for AGIs over 200k)
Averages for the 2004 tax year for zip code 15622, filed in 2005:
Average Adjusted Gross Income (AGI) in 2004: $46,108 (Individual Income Tax Returns)
Here:
$46,108
State:
$48,049
Salary/wage: $35,341 (reported on 82.0% of returns)
Here:
$35,341
State:
$42,646
(% of AGI for various income ranges: 206.1% for AGIs below $10k, 75.4% for AGIs $10k-25k, 80.1% for AGIs $25k-50k, 77.0% for AGIs $50k-75k, 76.9% for AGIs $75k-100k, 41.3% for AGIs over 100k)
Taxable interest for individuals: $1,675 (reported on 47.0% of returns)
This zip code:
$1,675
Pennsylvania:
$1,657
(% of AGI for various income ranges: 14.8% for AGIs below $10k, 2.3% for AGIs $10k-25k, 2.0% for AGIs $25k-50k, 1.3% for AGIs $50k-75k, 0.9% for AGIs $75k-100k, 1.5% for AGIs over 100k)
Taxable dividends: $5,071 (reported on 26.5% of returns)
Here:
$5,071
State:
$3,566
(% of AGI for various income ranges: 13.0% for AGIs below $10k, 1.2% for AGIs $10k-25k, 0.8% for AGIs $25k-50k, 1.8% for AGIs $50k-75k, 1.3% for AGIs $75k-100k, 4.7% for AGIs over 100k)
Net capital gain/loss: +$9,752 (reported on 22.3% of returns)
Here:
+$9,752
State:
+$9,716
(% of AGI for various income ranges: -8.8% for AGIs below $10k, -0.2% for AGIs $10k-25k, -0.3% for AGIs $25k-50k, 0.9% for AGIs $50k-75k, -0.5% for AGIs $75k-100k, 10.8% for AGIs over 100k)
Profit/loss from business: +$9,027 (reported on 16.3% of returns)
Here:
+$9,027
State:
+$14,267
(% of AGI for various income ranges: -41.5% for AGIs below $10k, 10.6% for AGIs $10k-25k, 1.0% for AGIs $25k-50k, 2.7% for AGIs $50k-75k, 4.1% for AGIs over 100k)
IRA payment deduction: $2,640 (reported on 3.6% of returns)
15622:
$2,640
Pennsylvania:
$2,903
Self-employed pension: $12,250 (reported on 1.7% of returns)
Here:
$12,250
Pennsylvania:
$14,674
Total itemized deductions: $18,597 (15% of AGI, reported on 22.4% of returns)
Here:
$18,597
State:
$18,804
Here:
15.5% of AGI
State:
19.5% of AGI
(% of AGI for various income ranges: 7.0% for AGIs $10k-25k, 7.7% for AGIs $25k-50k, 9.3% for AGIs $50k-75k, 15.1% for AGIs $75k-100k, 8.8% for AGIs over 100k)
Charity contributions deductions: $3,773 (3% of AGI, reported on 18.6% of returns)
Here:
$3,773
State:
$3,337
Here:
2.8% of AGI
State:
3.3% of AGI
(% of AGI for various income ranges: 0.4% for AGIs $10k-25k, 0.6% for AGIs $25k-50k, 1.3% for AGIs $50k-75k, 1.4% for AGIs $75k-100k, 2.3% for AGIs over 100k)
Total tax: $8,776 (reported on 76.0% of returns)
15622:
$8,776
State:
$8,008
(% of AGI for various income ranges: 4.8% for AGIs below $10k, 5.0% for AGIs $10k-25k, 6.9% for AGIs $25k-50k, 9.5% for AGIs $50k-75k, 10.9% for AGIs $75k-100k, 22.6% for AGIs over 100k)
Earned income credit: $1,426 (reported on 13.7% of returns)
Here:
$1,426
State:
$1,643
Percentage of individuals using paid preparers for their 2004 taxes: 66.5%
Here:
67%
State:
56%
(% for various income ranges: 64.7% for AGIs below $10k, 64.3% for AGIs $10k-25k, 64.7% for AGIs $25k-50k, 70.3% for AGIs $50k-75k, 76.9% for AGIs $75k-100k, 73.5% for AGIs over 100k)
Notable locations in zip code 15622: Seven Springs Mountain Resort (A), Seven Springs Resort Golf Course (B), Camp Alliquippa (C), White Mountain Ski Area (D), Seven Springs Volunteer Fire Company (E). Display/hide their locations on the map
Churches in zip code 15622 include: Mount Hope Church (A), Mount Nebo Church (B), Center Church (C), Calvary Church (D). Display/hide their locations on the map
Streams, rivers, and creeks: Wash Run (A), Trout Run (B), Neals Run (C), Minnow Run (D), Roaring Run (E), Pike Run (F), Back Creek (G), Allen Creek (H). Display/hide their locations on the map
In group quarters: 3 (-1 institutionalized population)
Size of family households: 214 2-persons, 73 3-persons, 80 4-persons, 5 5-persons
Size of nonfamily households: 209 1-person, 4 2-persons, 2 5-persons
97 married couples with children.
12 single-parent households (12 women).
96.9% of residents of 15622 zip code speak English at home.
2.9% of residents speak other Indo-European language at home (83% very well, 8% well, 8% not well).
Foreign born population: 61 (4.9%) (100.0% of them are naturalized citizens)
This zip code:
4.9%
Whole state:
7.5%
43%Norway
37%Czechoslovakia (includes Czech Republic and Slovakia)
33%American
14%Italian
11%German
9%English
6%Swedish
5%Croatian
4%Irish
Year of entry for the foreign-born population
82010 or later
02000 to 2009
01990 to 1999
52Before 1990
Housing units lacking complete plumbing facilities: 3.5% Housing units lacking complete kitchen facilities: 3.0%
24.1%Electricity
23.4%Fuel oil, kerosene, etc.
21.0%Wood
16.6%Utility gas
10.2%Bottled, tank, or LP gas
4.0%Other fuel
1.2%Coal or coke
Population in 1990: 109. Population change in the 1990s: +1,194 (+1095.4%).
Place of birth for U.S.-born residents:
This state: 1,081
Northeast: 56
Midwest: 8
South: 14
West: 5
74% of the 15622 zip code residents lived in the same house 5 years ago. Out of people who lived in different houses, 38% lived in this county. Out of people who lived in different counties, 50% lived in Pennsylvania.
100% of the 15622 zip code residents lived in the same house 1 year ago. Out of people who lived in different houses, 500% moved from different county within same state.
Private vs. public school enrollment:
Students in private schools in grades 1 to 8 (elementary and middle school): 13
Here:
17.0%
Pennsylvania:
15.7%
Students in private schools in grades 9 to 12 (high school):
Here:
0.0%
Pennsylvania:
13.4%
Students in private undergraduate colleges:
Here:
0.0%
Pennsylvania:
39.8%
Occupation by median earnings in the past 12 months ($)
100,454Management occupations
57,501Construction and extraction occupations
45,541Office and administrative support occupations
44,352Sales and related occupations
35,716Building and grounds cleaning and maintenance occupations
34,503Healthcare support occupations
Top industries in this zip code by the number of employees in 2005:
Accommodation and Food Services: Hotels (except Casino Hotels) and Motels (over 1000 employees: 1 establishment)
Health Care and Social Assistance: Other Individual and Family Services (20-49: 1)
Construction: Site Preparation Contractors (20-49: 1)
Accommodation and Food Services: RV (Recreational Vehicle) Parks and Campgrounds (10-19: 1, 5-9: 1, 1-4: 1)
Health Care and Social Assistance: Offices of Physical, Occupational and Speech Therapists, and Audiologists (10-19: 1, 5-9: 1)
Administrative and Support and Waste Management and Remediation Services: Landscaping Services (10-19: 1, 1-4: 1)
Construction: New Housing Operative Builders (10-19: 1)
People in group quarters in 2010:
4 people in workers' group living quarters and job corps centers
Fatal accident statistics in 2011:
Fatal accident count: 1
Vehicles involved in fatal accidents: 1
Fatal accidents caused by drunken drivers: 1
Fatalities: 1
Persons involved in fatal accidents: 1
Pedestrians involved in fatal accidents: 0
Home Mortgage Disclosure Act Aggregated Statistics For Year 2009 (Based on 2 partial tracts)
A) FHA, FSA/RHS & VA Home Purchase Loans
B) Conventional Home Purchase Loans
C) Refinancings
D) Home Improvement Loans
F) Non-occupant Loans on < 5 Family Dwellings (A B C & D)
G) Loans On Manufactured Home Dwelling (A B C & D)
Number
Average Value
Number
Average Value
Number
Average Value
Number
Average Value
Number
Average Value
Number
Average Value
LOANS ORIGINATED
2
$84,900
4
$192,610
21
$160,673
5
$33,188
8
$255,319
2
$24,855
APPLICATIONS APPROVED, NOT ACCEPTED
0
$0
1
$192,950
2
$179,555
0
$0
1
$225,860
0
$0
APPLICATIONS DENIED
0
$0
2
$60,610
13
$138,173
3
$36,927
3
$210,203
2
$41,880
APPLICATIONS WITHDRAWN
0
$0
0
$0
4
$174,790
0
$0
1
$402,700
0
$0
FILES CLOSED FOR INCOMPLETENESS
0
$0
0
$0
1
$87,390
0
$0
0
$0
0
$0
Aggregated Statistics For Year 2008 (Based on 2 partial tracts)
A) FHA, FSA/RHS & VA Home Purchase Loans
B) Conventional Home Purchase Loans
C) Refinancings
D) Home Improvement Loans
F) Non-occupant Loans on < 5 Family Dwellings (A B C & D)
G) Loans On Manufactured Home Dwelling (A B C & D)
Number
Average Value
Number
Average Value
Number
Average Value
Number
Average Value
Number
Average Value
Number
Average Value
LOANS ORIGINATED
1
$175,470
8
$189,402
12
$81,455
8
$28,091
5
$214,198
4
$64,355
APPLICATIONS APPROVED, NOT ACCEPTED
0
$0
1
$212,700
2
$67,190
1
$46,990
0
$0
0
$0
APPLICATIONS DENIED
0
$0
4
$179,728
16
$100,816
5
$17,570
1
$552,520
3
$74,607
APPLICATIONS WITHDRAWN
0
$0
1
$151,410
4
$97,668
0
$0
1
$113,050
0
$0
FILES CLOSED FOR INCOMPLETENESS
0
$0
0
$0
1
$91,250
0
$0
0
$0
0
$0
Aggregated Statistics For Year 2007 (Based on 2 partial tracts)
A) FHA, FSA/RHS & VA Home Purchase Loans
B) Conventional Home Purchase Loans
C) Refinancings
D) Home Improvement Loans
F) Non-occupant Loans on < 5 Family Dwellings (A B C & D)
G) Loans On Manufactured Home Dwelling (A B C & D)
Number
Average Value
Number
Average Value
Number
Average Value
Number
Average Value
Number
Average Value
Number
Average Value
LOANS ORIGINATED
2
$90,800
9
$153,957
18
$86,575
10
$42,926
6
$187,350
4
$50,052
APPLICATIONS APPROVED, NOT ACCEPTED
0
$0
1
$186,820
5
$70,870
2
$33,370
1
$151,860
1
$69,920
APPLICATIONS DENIED
0
$0
4
$158,730
24
$93,666
7
$28,570
1
$401,790
6
$46,723
APPLICATIONS WITHDRAWN
0
$0
2
$39,385
7
$100,756
0
$0
1
$76,730
0
$0
FILES CLOSED FOR INCOMPLETENESS
0
$0
0
$0
2
$236,195
0
$0
0
$0
0
$0
Aggregated Statistics For Year 2006 (Based on 2 partial tracts)
A) FHA, FSA/RHS & VA Home Purchase Loans
B) Conventional Home Purchase Loans
C) Refinancings
D) Home Improvement Loans
F) Non-occupant Loans on < 5 Family Dwellings (A B C & D)
G) Loans On Manufactured Home Dwelling (A B C & D)
Number
Average Value
Number
Average Value
Number
Average Value
Number
Average Value
Number
Average Value
Number
Average Value
LOANS ORIGINATED
1
$104,870
9
$155,999
20
$92,945
12
$39,422
5
$191,224
3
$60,230
APPLICATIONS APPROVED, NOT ACCEPTED
0
$0
3
$159,960
4
$88,302
2
$33,480
1
$294,190
1
$47,670
APPLICATIONS DENIED
1
$60,610
5
$53,890
29
$84,749
11
$25,217
0
$0
8
$53,544
APPLICATIONS WITHDRAWN
0
$0
2
$62,650
12
$102,509
0
$0
0
$0
1
$64,920
FILES CLOSED FOR INCOMPLETENESS
0
$0
0
$0
4
$144,995
0
$0
0
$0
0
$0
Aggregated Statistics For Year 2005 (Based on 2 partial tracts)
A) FHA, FSA/RHS & VA Home Purchase Loans
B) Conventional Home Purchase Loans
C) Refinancings
D) Home Improvement Loans
F) Non-occupant Loans on < 5 Family Dwellings (A B C & D)
G) Loans On Manufactured Home Dwelling (A B C & D)
Number
Average Value
Number
Average Value
Number
Average Value
Number
Average Value
Number
Average Value
Number
Average Value
LOANS ORIGINATED
1
$40,410
9
$97,004
23
$94,718
12
$36,188
3
$123,563
3
$49,033
APPLICATIONS APPROVED, NOT ACCEPTED
0
$0
4
$120,935
7
$67,516
1
$62,200
0
$0
2
$78,315
APPLICATIONS DENIED
0
$0
9
$62,652
37
$96,297
10
$46,376
2
$110,890
12
$60,968
APPLICATIONS WITHDRAWN
0
$0
1
$46,760
13
$103,808
2
$87,510
0
$0
1
$98,970
FILES CLOSED FOR INCOMPLETENESS
0
$0
0
$0
3
$118,647
0
$0
0
$0
0
$0
Aggregated Statistics For Year 2004 (Based on 2 partial tracts)
A) FHA, FSA/RHS & VA Home Purchase Loans
B) Conventional Home Purchase Loans
C) Refinancings
D) Home Improvement Loans
F) Non-occupant Loans on < 5 Family Dwellings (A B C & D)
G) Loans On Manufactured Home Dwelling (A B C & D)
Number
Average Value
Number
Average Value
Number
Average Value
Number
Average Value
Number
Average Value
Number
Average Value
LOANS ORIGINATED
1
$134,840
10
$140,604
31
$76,755
12
$37,852
6
$162,608
2
$69,690
APPLICATIONS APPROVED, NOT ACCEPTED
0
$0
1
$115,540
8
$66,625
1
$69,230
0
$0
1
$69,010
APPLICATIONS DENIED
0
$0
7
$74,521
37
$83,788
12
$31,988
1
$95,790
6
$44,152
APPLICATIONS WITHDRAWN
0
$0
1
$176,610
15
$86,109
2
$37,000
1
$108,280
2
$51,645
FILES CLOSED FOR INCOMPLETENESS
0
$0
0
$0
4
$109,868
0
$0
0
$0
0
$0
Aggregated Statistics For Year 2003 (Based on 2 partial tracts)
A) FHA, FSA/RHS & VA Home Purchase Loans
B) Conventional Home Purchase Loans
C) Refinancings
D) Home Improvement Loans
F) Non-occupant Loans on < 5 Family Dwellings (A B C & D)
Number
Average Value
Number
Average Value
Number
Average Value
Number
Average Value
Number
Average Value
LOANS ORIGINATED
1
$82,400
18
$138,848
58
$83,556
14
$26,219
18
$144,826
APPLICATIONS APPROVED, NOT ACCEPTED
0
$0
2
$65,150
17
$73,802
1
$30,640
2
$181,715
APPLICATIONS DENIED
0
$0
5
$62,062
41
$70,409
12
$15,777
2
$88,530
APPLICATIONS WITHDRAWN
0
$0
2
$93,295
20
$83,048
2
$29,285
2
$89,665
FILES CLOSED FOR INCOMPLETENESS
0
$0
0
$0
2
$76,955
0
$0
1
$64,470
Aggregated Statistics For Year 2002 (Based on 2 partial tracts)
B) Conventional Home Purchase Loans
C) Refinancings
D) Home Improvement Loans
F) Non-occupant Loans on < 5 Family Dwellings (A B C & D)
Number
Average Value
Number
Average Value
Number
Average Value
Number
Average Value
LOANS ORIGINATED
11
$110,405
35
$81,506
10
$33,210
12
$113,443
APPLICATIONS APPROVED, NOT ACCEPTED
2
$105,100
7
$79,450
2
$39,270
2
$118,950
APPLICATIONS DENIED
5
$41,994
29
$67,466
7
$19,814
1
$55,390
APPLICATIONS WITHDRAWN
1
$93,980
17
$72,506
2
$23,155
1
$71,960
FILES CLOSED FOR INCOMPLETENESS
0
$0
3
$98,367
0
$0
0
$0
Aggregated Statistics For Year 2001 (Based on 2 partial tracts)
A) FHA, FSA/RHS & VA Home Purchase Loans
B) Conventional Home Purchase Loans
C) Refinancings
D) Home Improvement Loans
F) Non-occupant Loans on < 5 Family Dwellings (A B C & D)
Number
Average Value
Number
Average Value
Number
Average Value
Number
Average Value
Number
Average Value
LOANS ORIGINATED
2
$50,165
12
$99,464
42
$66,868
16
$25,523
12
$101,961
APPLICATIONS APPROVED, NOT ACCEPTED
0
$0
3
$64,167
11
$56,296
3
$18,387
1
$89,210
APPLICATIONS DENIED
0
$0
10
$51,370
32
$55,892
16
$15,592
2
$40,065
APPLICATIONS WITHDRAWN
0
$0
1
$73,090
13
$66,528
3
$21,187
1
$76,270
FILES CLOSED FOR INCOMPLETENESS
0
$0
0
$0
4
$57,205
0
$0
0
$0
Aggregated Statistics For Year 2000 (Based on 2 partial tracts)
A) FHA, FSA/RHS & VA Home Purchase Loans
B) Conventional Home Purchase Loans
C) Refinancings
D) Home Improvement Loans
F) Non-occupant Loans on < 5 Family Dwellings (A B C & D)
Number
Average Value
Number
Average Value
Number
Average Value
Number
Average Value
Number
Average Value
LOANS ORIGINATED
1
$96,250
12
$93,770
17
$48,818
13
$19,924
5
$123,670
APPLICATIONS APPROVED, NOT ACCEPTED
0
$0
2
$92,730
4
$73,775
2
$23,265
0
$0
APPLICATIONS DENIED
0
$0
10
$43,902
21
$55,723
7
$23,121
1
$70,140
APPLICATIONS WITHDRAWN
0
$0
1
$114,630
7
$52,599
1
$12,710
0
$0
FILES CLOSED FOR INCOMPLETENESS
0
$0
0
$0
2
$52,775
0
$0
0
$0
Aggregated Statistics For Year 1999 (Based on 2 partial tracts)
A) FHA, FSA/RHS & VA Home Purchase Loans
B) Conventional Home Purchase Loans
C) Refinancings
D) Home Improvement Loans
F) Non-occupant Loans on < 5 Family Dwellings (A B C & D)
Detailed PMIC statistics for the following Tracts:2605.00
2003 - 2018 National Fire Incident Reporting System (NFIRS) incidents
Based on the data from the years 2003 - 2018 the average number of fire incidents per year is 6. The highest number of reported fires - 15 took place in 2011, and the least - 1 in 2003. The data has a growing trend.
When looking into fire subcategories, the most reports belonged to: Structure Fires (63.0%), and Outside Fires (16.0%).
Fire incident types reported to NFIRS in Zip Code 15622


 Nearest zip codes: 15646, 15462, 15628, 15446, 15687, 15502.


 Based on the data from the years 2003 - 2018 the average number of fire incidents per year is 6. The highest number of reported fires - 15 took place in 2011, and the least - 1 in 2003. The data has a growing trend.
 When looking into fire subcategories, the most reports belonged to: Structure Fires (63.0%), and Outside Fires (16.0%).