Estimated zip code population in 2022: 1,145 Zip code population in 2010: 1,409 Zip code population in 2000: 1,199
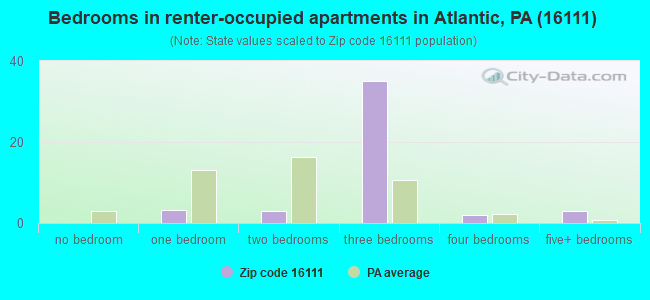
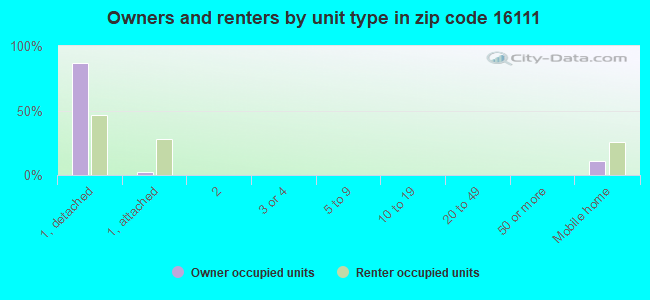
Houses and condos: 410 Renter-occupied apartments: 48
% of renters here:
12%
State:
31%
March 2022 cost of living index in zip code 16111: 93.2 (less than average, U.S. average is 100)
Land area: 28.1 sq. mi. Water area: 0.0 sq. mi.
Population density: 41 people per square mile
(very low).
OSM Map
General Map
Google Map
MSN Map
OSM Map
General Map
Google Map
MSN Map
OSM Map
General Map
Google Map
MSN Map
OSM Map
General Map
Google Map
MSN Map
Please wait while loading the map...
Real estate property taxes paid for housing units in 2022:
This zip code:
1.4% ($2,287)
Pennsylvania:
1.3% ($3,094)
Median real estate property taxes paid for housing units with mortgages in 2022: $2,597 (1.7%) Median real estate property taxes paid for housing units with no mortgage in 2022: $1,972 (1.1%)
Business Search- 14 Million verified businesses
Males: 554
(48.4%)
Females: 591
(51.6%)
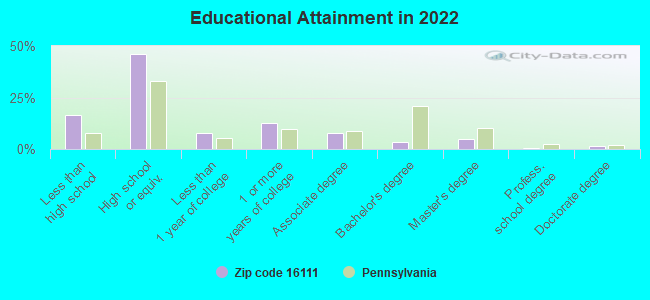
For population 25 years and over in 16111:
High school or higher: 81.3%
Bachelor's degree or higher: 9.7%
Graduate or professional degree: 6.2%
Unemployed: 1.8%
Mean travel time to work (commute): 34.1 minutes
For population 15 years and over in 16111:
Never married: 22.2%
Now married: 65.0%
Separated: 1.5%
Widowed: 7.6%
Divorced: 3.7%
Zip code 16111 compared to state average:
Median house value below state average.
Unemployed percentage below state average.
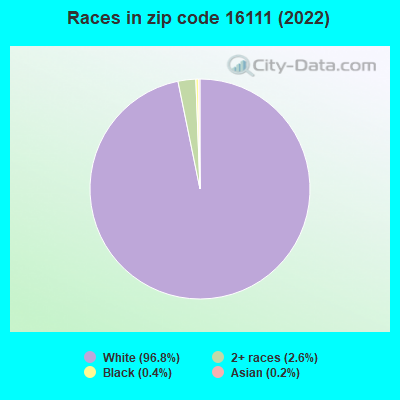
Black race population percentage significantly below state average.
Hispanic race population percentage significantly below state average.
Median age below state average.
Foreign-born population percentage significantly below state average.
Renting percentage significantly below state average.
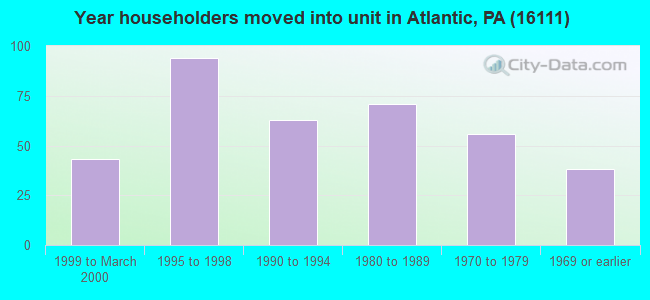
Length of stay since moving in significantly above state average.
Number of college students significantly below state average.
Percentage of population with a bachelor's degree or higher significantly below state average.
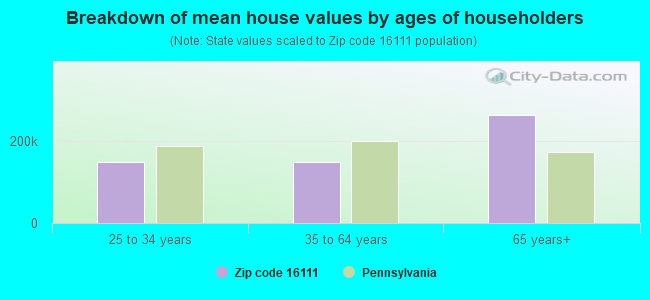
Estimated median house/condo value in 2022: $160,845
16111:
$160,845
Pennsylvania:
$245,500
According to our research of Pennsylvania and other state lists, there was 1 registered sex offender living in 16111 zip code as of June 16, 2024. The ratio of all residents to sex offenders in zip code 16111 is 1,437 to 1. The ratio of registered sex offenders to all residents in this zip code is lower than the state average.
Median resident age:
This zip code:
34.7 years
Pennsylvania median age:
40.9 years
Average household size:
This zip code:
2.9 people
Pennsylvania:
2.4 people
Averages for the 2020 tax year for zip code 16111, filed in 2021:
Average Adjusted Gross Income (AGI) in 2020: $43,570 (Individual Income Tax Returns)
Here:
$43,570
State:
$75,707
Salary/wage: $39,928 (reported on 68.1% of returns)
Here:
$39,928
State:
$62,806
(% of AGI for various income ranges: 1238.6% for AGIs below $25k, 3767.8% for AGIs $25k-50k, 6787.5% for AGIs $50k-75k, 10550.0% for AGIs $75k-100k, 18470.0% for AGIs $100k-200k)
Taxable interest for individuals: $262 (reported on 17.0% of returns)
This zip code:
$262
Pennsylvania:
$1,633
(% of AGI for various income ranges: 10.0% for AGIs below $25k, 5.6% for AGIs $25k-50k, 45.0% for AGIs $75k-100k)
Ordinary dividends: $1,180 (reported on 10.6% of returns)
Here:
$1,180
State:
$7,382
(% of AGI for various income ranges: 57.1% for AGIs below $25k, 47.5% for AGIs $50k-75k)
Net capital gain/loss in AGI: +$4,175 (reported on 8.5% of returns)
Here:
+$4,175
State:
+$23,522
(% of AGI for various income ranges: 417.5% for AGIs $50k-75k)
Profit/loss from business: +$23,879 (reported on 29.8% of returns)
Here:
+$23,879
State:
+$16,274
(% of AGI for various income ranges: 650.0% for AGIs below $25k, 1443.3% for AGIs $25k-50k, 1972.5% for AGIs $50k-75k, 4000.0% for AGIs $75k-100k)
Taxable individual retirement arrangement distribution: $7,400 (reported on 6.4% of returns)
16111:
$7,400
Pennsylvania:
$18,583
(% of AGI for various income ranges: 317.1% for AGIs below $25k)
Earned income credit: $1,700 (reported on 12.8% of returns)
Here:
$1,700
State:
$2,100
(% of AGI for various income ranges: 65.7% for AGIs below $25k, 62.2% for AGIs $25k-50k)
Percentage of individuals using paid preparers for their 2020 taxes: 83.0%
Here:
83%
State:
92%
(% for various income ranges: 82.4% for AGIs below $25k, 80.0% for AGIs $25k-50k, 85.7% for AGIs $50k-75k, 75.0% for AGIs $75k-100k, 100.0% for AGIs $100k-200k)
Averages for the 2012 tax year for zip code 16111, filed in 2013:
Average Adjusted Gross Income (AGI) in 2012: $35,943 (Individual Income Tax Returns)
Here:
$35,943
State:
$61,346
Salary/wage: $34,639 (reported on 67.3% of returns)
Here:
$34,639
State:
$51,902
(% of AGI for various income ranges: 51.7% for AGIs below $25k, 58.3% for AGIs $25k-50k, 78.3% for AGIs $50k-75k, 83.6% for AGIs $75k-100k, 57.0% for AGIs $100k-200k)
Taxable interest for individuals: $367 (reported on 24.5% of returns)
This zip code:
$367
Pennsylvania:
$1,588
(% of AGI for various income ranges: 0.4% for AGIs below $25k, 0.4% for AGIs $25k-50k, 0.6% for AGIs $75k-100k)
Ordinary dividends: $1,080 (reported on 10.2% of returns)
Here:
$1,080
State:
$5,827
Net capital gain/loss in AGI: +$200 (reported on 8.2% of returns)
Here:
+$200
State:
+$14,495
Profit/loss from business: +$13,150 (reported on 32.7% of returns)
Here:
+$13,150
State:
+$16,268
(% of AGI for various income ranges: 33.2% for AGIs below $25k, 23.5% for AGIs $25k-50k, 4.7% for AGIs $50k-75k)
Taxable individual retirement arrangement distribution: $7,433 (reported on 6.1% of returns)
16111:
$7,433
Pennsylvania:
$14,550
Total itemized deductions: $17,950 (19% of AGI, reported on 12.2% of returns)
Here:
$17,950
State:
$23,538
Here:
19.2% of AGI
State:
18.4% of AGI
Charity contributions: $3,467 (reported on 6.1% of returns)
Here:
$3,467
State:
$4,025
Taxes paid: $5,933 (reported on 12.2% of returns)
16111:
$5,933
State:
$9,982
Earned income credit: $2,000 (reported on 16.3% of returns)
Here:
$2,000
State:
$2,106
(% of AGI for various income ranges: 3.7% for AGIs below $25k, 1.4% for AGIs $25k-50k)
Percentage of individuals using paid preparers for their 2012 taxes: 63.3%
Here:
63%
State:
53%
(% for various income ranges: 62.5% for AGIs below $25k, 61.5% for AGIs $25k-50k, 66.7% for AGIs $50k-75k, 133.3% for AGIs $75k-100k)
Averages for the 2004 tax year for zip code 16111, filed in 2005:
Average Adjusted Gross Income (AGI) in 2004: $31,809 (Individual Income Tax Returns)
Here:
$31,809
State:
$48,049
Salary/wage: $28,476 (reported on 70.9% of returns)
Here:
$28,476
State:
$42,646
(% of AGI for various income ranges: 58.9% for AGIs below $10k, 56.2% for AGIs $10k-25k, 65.9% for AGIs $25k-50k, 63.3% for AGIs $50k-75k, 74.0% for AGIs $75k-100k, 61.1% for AGIs over 100k)
Taxable interest for individuals: $599 (reported on 36.5% of returns)
This zip code:
$599
Pennsylvania:
$1,657
(% of AGI for various income ranges: 5.4% for AGIs below $10k, 0.5% for AGIs $10k-25k, 0.3% for AGIs $25k-50k, 0.8% for AGIs $50k-75k, 1.3% for AGIs $75k-100k)
Taxable dividends: $875 (reported on 16.2% of returns)
Here:
$875
State:
$3,566
(% of AGI for various income ranges: 1.3% for AGIs below $10k, 0.5% for AGIs $10k-25k, 0.0% for AGIs $25k-50k, 1.0% for AGIs $50k-75k, 0.8% for AGIs $75k-100k)
Net capital gain/loss: +$105 (reported on 8.6% of returns)
Here:
+$105
State:
+$9,716
Profit/loss from business: +$13,568 (reported on 31.3% of returns)
Here:
+$13,568
State:
+$14,267
(% of AGI for various income ranges: 26.3% for AGIs below $10k, 27.0% for AGIs $10k-25k, 17.6% for AGIs $25k-50k, 10.4% for AGIs $50k-75k)
Profit/loss from farming: +$7,600 (reported on 4.5% of returns)
Here:
+$7,600
State:
+$274
Total itemized deductions: $16,655 (21% of AGI, reported on 12.4% of returns)
Here:
$16,655
State:
$18,804
Here:
21.2% of AGI
State:
19.5% of AGI
(% of AGI for various income ranges: 4.2% for AGIs $25k-50k, 8.8% for AGIs $50k-75k, 13.0% for AGIs $75k-100k, 12.0% for AGIs over 100k)
Charity contributions deductions: $3,722 (5% of AGI, reported on 8.1% of returns)
Here:
$3,722
State:
$3,337
Here:
4.6% of AGI
State:
3.3% of AGI
(% of AGI for various income ranges: 1.0% for AGIs $10k-25k, 1.1% for AGIs $50k-75k, 5.1% for AGIs $75k-100k)
Total tax: $3,942 (reported on 61.7% of returns)
16111:
$3,942
State:
$8,008
(% of AGI for various income ranges: 2.0% for AGIs below $10k, 4.0% for AGIs $10k-25k, 4.8% for AGIs $25k-50k, 7.5% for AGIs $50k-75k, 10.3% for AGIs $75k-100k, 17.2% for AGIs over 100k)
Earned income credit: $1,735 (reported on 15.3% of returns)
Here:
$1,735
State:
$1,643
Percentage of individuals using paid preparers for their 2004 taxes: 60.8%
Here:
61%
State:
56%
(% for various income ranges: 58.5% for AGIs below $10k, 55.3% for AGIs $10k-25k, 61.6% for AGIs $25k-50k, 68.5% for AGIs $50k-75k, 70.6% for AGIs $75k-100k, 84.6% for AGIs over 100k)
Likely homosexual households (counted as self-reported same-sex unmarried-partner households)
Lesbian couples: 2.8% of all households
Gay men: 0.0% of all households
Household received Food Stamps/SNAP in the past 12 months: 18 Household did not receive Food Stamps/SNAP in the past 12 months: 367
Women who had a birth in the past 12 months: 63 (67 now married, 0 unmarried) Women who did not have a birth in the past 12 months: 159 (65 now married, 93 unmarried)
Housing units in zip code 16111 with a mortgage: 153 (50 second mortgage, 46 both second mortgage and home equity loan) Houses without a mortgage: 13
Median monthly owner costs for units with a mortgage: $1,131 Median monthly owner costs for units without a mortgage: $428
Residents with income below the poverty level in 2022:
This zip code:
15.5%
Whole state:
11.8%
Residents with income below 50% of the poverty level in 2022:
This zip code:
9.0%
Whole state:
6.1%
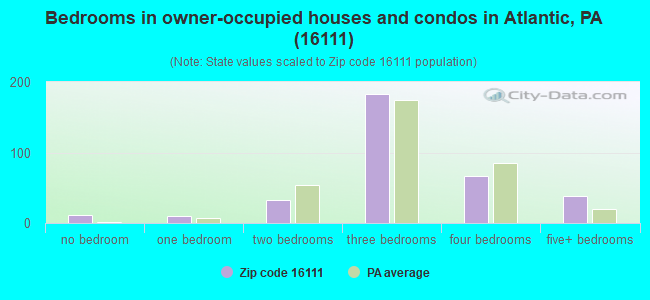
Median number of rooms in houses and condos:
Here:
6.4
State:
6.8
Median number of rooms in apartments:
Here:
5.5
State:
4.3
Notable locations in this zip code not listed on our city pages
Size of family households: 123 2-persons, 50 3-persons, 51 4-persons, 22 5-persons, 23 6-persons, 15 7-or-more-persons
Size of nonfamily households: 82 1-person, 17 2-persons
310 married couples with children.
6 single-parent households (6 women).
68.3% of residents of 16111 zip code speak English at home.
32.5% of residents speak other Indo-European language at home (49% very well, 42% well, 6% not well, 3% not at all).
Foreign born population: 3 (0.3%) (100.0% of them are naturalized citizens)
This zip code:
0.3%
Whole state:
7.5%
100%Japan
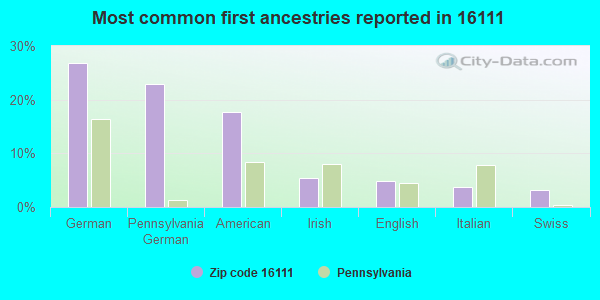
27%German
23%Pennsylvania German
18%American
5%Irish
5%English
4%Italian
3%Swiss
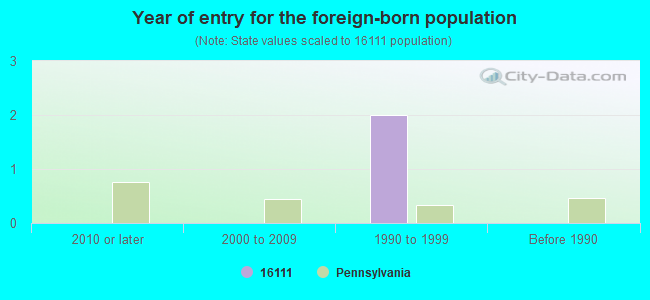
Year of entry for the foreign-born population
02010 or later
02000 to 2009
21990 to 1999
0Before 1990
Facilities with environmental interests located in this zip code:
AT&T ADAMSVILLE (RT 1 CONN LKLEECH 3 MI E OF in ATLANTIC, PA)
STATE MASTER (Pennsylvania database) - RCRIS-PAD987384278, HAZARDOUS WASTE PROGRAM Conditionally Exempt Small Quantity Generators, less than 100 kg/month of hazardous waste (Resource Conservation and Recovery Act (tracking hazardous waste)) - notification Organizations: AT&T COMMUNICATIONS (CONTACT/OWNER)
Housing units lacking complete plumbing facilities: 12.1% Housing units lacking complete kitchen facilities: 16.3%
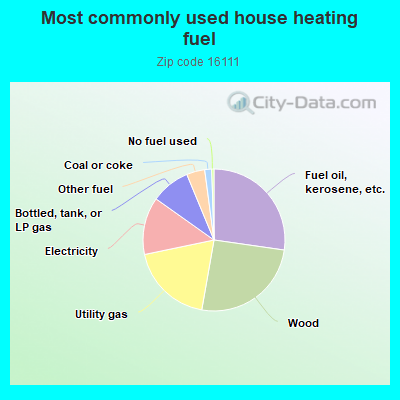
27.5%Fuel oil, kerosene, etc.
25.7%Wood
19.1%Utility gas
13.2%Electricity
9.0%Bottled, tank, or LP gas
4.2%Other fuel
1.6%Coal or coke
0.5%No fuel used
Population in 1990: 2,390.
Place of birth for U.S.-born residents:
This state: 986
Northeast: 59
Midwest: 46
South: 35
West: 7
66% of the 16111 zip code residents lived in the same house 5 years ago. Out of people who lived in different houses, 50% lived in this county. Out of people who lived in different counties, 50% lived in Pennsylvania.
99% of the 16111 zip code residents lived in the same house 1 year ago. Out of people who lived in different houses, 133% moved from this county.
Private vs. public school enrollment:
Students in private schools in grades 1 to 8 (elementary and middle school): 54
Here:
52.2%
Pennsylvania:
15.7%
Students in private schools in grades 9 to 12 (high school):
Here:
0.0%
Pennsylvania:
13.4%
Students in private undergraduate colleges: 3
Here:
21.5%
Pennsylvania:
39.8%
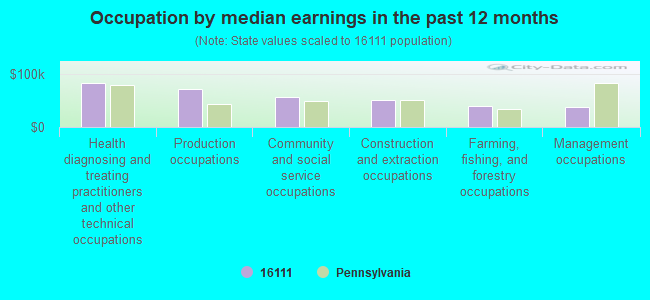
Occupation by median earnings in the past 12 months ($)
82,594Health diagnosing and treating practitioners and other technical occupations
70,976Production occupations
56,904Community and social service occupations
51,286Construction and extraction occupations
38,750Farming, fishing, and forestry occupations
37,028Management occupations
Top industries in this zip code by the number of employees in 2005:
Other Services (except Public Administration): All Other Personal Services (5-9 employees: 1 establishment)
Construction: New Single-Family Housing Construction (except Operative Builders) (5-9: 1)
Construction: All Other Specialty Trade Contractors (1-4: 1)
Construction: Masonry Contractors (1-4: 1)
Finance and Insurance: Commercial Banking (1-4: 1)
Construction: Residential Remodelers (1-4: 1)
2004 - 2018 National Fire Incident Reporting System (NFIRS) incidents
Based on the data from the years 2004 - 2018 the average number of fires per year is 7. The highest number of fire incidents - 16 took place in 2017, and the least - 1 in 2004. The data has a rising trend.
When looking into fire subcategories, the most incidents belonged to: Structure Fires (58.8%), and Outside Fires (26.5%).
Fire incident types reported to NFIRS in Zip Code 16111

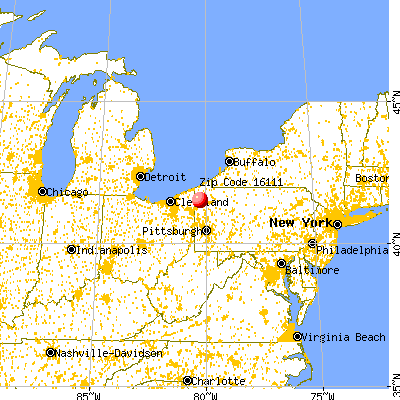


 Nearest zip codes: 16316, 16130, 16110, 16131, 16151, 16125.
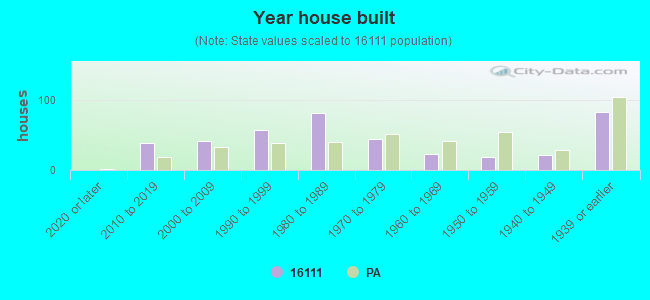


 Based on the data from the years 2004 - 2018 the average number of fires per year is 7. The highest number of fire incidents - 16 took place in 2017, and the least - 1 in 2004. The data has a rising trend.
 When looking into fire subcategories, the most incidents belonged to: Structure Fires (58.8%), and Outside Fires (26.5%).