Estimated zip code population in 2022: 1,428 Zip code population in 2010: 1,494 Zip code population in 2000: 1,666
Houses and condos: 891 Renter-occupied apartments: 33
% of renters here:
6%
State:
31%
March 2022 cost of living index in zip code 16639: 90.1 (less than average, U.S. average is 100)
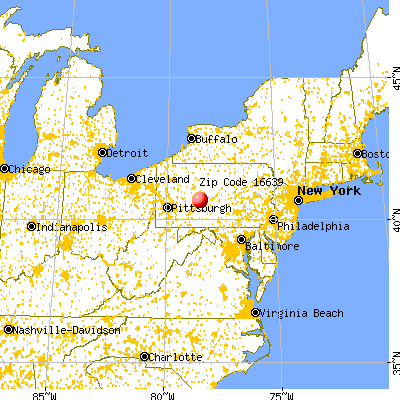
Land area: 36.1 sq. mi. Water area: 0.0 sq. mi.
Population density: 40 people per square mile
(very low).
OSM Map
General Map
Google Map
MSN Map
OSM Map
General Map
Google Map
MSN Map
OSM Map
General Map
Google Map
MSN Map
OSM Map
General Map
Google Map
MSN Map
Please wait while loading the map...
Real estate property taxes paid for housing units in 2022:
This zip code:
0.9% ($1,252)
Pennsylvania:
1.3% ($3,094)
Median real estate property taxes paid for housing units with mortgages in 2022: $1,373 (0.9%) Median real estate property taxes paid for housing units with no mortgage in 2022: $1,186 (1.0%)
Business Search- 14 Million verified businesses
Males: 597
(41.9%)
Females: 830
(58.1%)
For population 25 years and over in 16639:
High school or higher: 91.2%
Bachelor's degree or higher: 15.8%
Graduate or professional degree: 5.1%
Unemployed: 3.8%
Mean travel time to work (commute): 34.0 minutes
For population 15 years and over in 16639:
Never married: 19.1%
Now married: 55.2%
Separated: 1.2%
Widowed: 9.5%
Divorced: 14.9%
Zip code 16639 compared to state average:
Median house value below state average.
Black race population percentage significantly below state average.
Hispanic race population percentage significantly below state average.
Median age significantly above state average.
Foreign-born population percentage significantly below state average.
Renting percentage significantly below state average.
Length of stay since moving in significantly above state average.
Percentage of population with a bachelor's degree or higher below state average.
Estimated median house/condo value in 2022: $133,169
16639:
$133,169
Pennsylvania:
$245,500
According to our research of Pennsylvania and other state lists, there was 1 registered sex offender living in 16639 zip code as of June 15, 2024. The ratio of all residents to sex offenders in zip code 16639 is 1,457 to 1. The ratio of registered sex offenders to all residents in this zip code is lower than the state average.
Median resident age:
This zip code:
49.2 years
Pennsylvania median age:
40.9 years
Average household size:
This zip code:
2.4 people
Pennsylvania:
2.4 people
Averages for the 2020 tax year for zip code 16639, filed in 2021:
Average Adjusted Gross Income (AGI) in 2020: $44,025 (Individual Income Tax Returns)
Here:
$44,025
State:
$75,707
Salary/wage: $45,112 (reported on 72.7% of returns)
Here:
$45,112
State:
$62,806
(% of AGI for various income ranges: 783.6% for AGIs below $25k, 3436.7% for AGIs $25k-50k, 5705.0% for AGIs $50k-75k, 10190.0% for AGIs $75k-100k, 17140.0% for AGIs $100k-200k)
Taxable interest for individuals: $509 (reported on 25.0% of returns)
This zip code:
$509
Pennsylvania:
$1,633
(% of AGI for various income ranges: 14.5% for AGIs below $25k, 23.3% for AGIs $25k-50k, 63.3% for AGIs $100k-200k)
Ordinary dividends: $767 (reported on 13.6% of returns)
Here:
$767
State:
$7,382
(% of AGI for various income ranges: 20.0% for AGIs below $25k, 80.0% for AGIs $75k-100k)
Net capital gain/loss in AGI: +$4,300 (reported on 11.4% of returns)
Here:
+$4,300
State:
+$23,522
(% of AGI for various income ranges: 10.9% for AGIs below $25k, 507.5% for AGIs $50k-75k)
Profit/loss from business: +$1,120 (reported on 11.4% of returns)
Here:
+$1,120
State:
+$16,274
(% of AGI for various income ranges: 62.2% for AGIs $25k-50k)
Taxable individual retirement arrangement distribution: $8,680 (reported on 11.4% of returns)
16639:
$8,680
Pennsylvania:
$18,583
(% of AGI for various income ranges: 394.5% for AGIs below $25k)
Earned income credit: $1,850 (reported on 13.6% of returns)
Here:
$1,850
State:
$2,100
(% of AGI for various income ranges: 49.1% for AGIs below $25k, 63.3% for AGIs $25k-50k)
Percentage of individuals using paid preparers for their 2020 taxes: 93.2%
Here:
93%
State:
92%
(% for various income ranges: 88.2% for AGIs below $25k, 100.0% for AGIs $25k-50k, 100.0% for AGIs $50k-75k, 80.0% for AGIs $75k-100k, 100.0% for AGIs $100k-200k)
Averages for the 2012 tax year for zip code 16639, filed in 2013:
Average Adjusted Gross Income (AGI) in 2012: $36,443 (Individual Income Tax Returns)
Here:
$36,443
State:
$61,346
Salary/wage: $35,853 (reported on 81.0% of returns)
Here:
$35,853
State:
$51,902
(% of AGI for various income ranges: 66.8% for AGIs below $25k, 75.6% for AGIs $25k-50k, 85.1% for AGIs $50k-75k, 78.8% for AGIs $75k-100k, 91.4% for AGIs $100k-200k)
Taxable interest for individuals: $433 (reported on 28.6% of returns)
This zip code:
$433
Pennsylvania:
$1,588
(% of AGI for various income ranges: 0.6% for AGIs below $25k, 0.6% for AGIs $25k-50k, 0.2% for AGIs $50k-75k, 0.3% for AGIs $75k-100k)
Ordinary dividends: $614 (reported on 16.7% of returns)
Here:
$614
State:
$5,827
Net capital gain/loss in AGI: +$350 (reported on 9.5% of returns)
Here:
+$350
State:
+$14,495
Profit/loss from business: +$2,880 (reported on 11.9% of returns)
Here:
+$2,880
State:
+$16,268
Taxable individual retirement arrangement distribution: $6,600 (reported on 7.1% of returns)
16639:
$6,600
Pennsylvania:
$14,550
(% of AGI for various income ranges: 8.4% for AGIs below $25k)
Total itemized deductions: $15,050 (20% of AGI, reported on 9.5% of returns)
Here:
$15,050
State:
$23,538
Here:
19.7% of AGI
State:
18.4% of AGI
Charity contributions: $2,750 (reported on 4.8% of returns)
Here:
$2,750
State:
$4,025
Taxes paid: $4,850 (reported on 9.5% of returns)
16639:
$4,850
State:
$9,982
Earned income credit: $2,400 (reported on 21.4% of returns)
Here:
$2,400
State:
$2,106
(% of AGI for various income ranges: 6.0% for AGIs below $25k, 1.8% for AGIs $25k-50k)
Percentage of individuals using paid preparers for their 2012 taxes: 59.5%
Here:
60%
State:
53%
(% for various income ranges: 52.6% for AGIs below $25k, 58.3% for AGIs $25k-50k, 66.7% for AGIs $50k-75k, 133.3% for AGIs $75k-100k)
Averages for the 2004 tax year for zip code 16639, filed in 2005:
Average Adjusted Gross Income (AGI) in 2004: $30,069 (Individual Income Tax Returns)
Here:
$30,069
State:
$48,049
Salary/wage: $28,920 (reported on 85.8% of returns)
Here:
$28,920
State:
$42,646
(% of AGI for various income ranges: 94.1% for AGIs below $10k, 72.6% for AGIs $10k-25k, 84.1% for AGIs $25k-50k, 92.0% for AGIs $50k-75k, 76.4% for AGIs $75k-100k)
Taxable interest for individuals: $619 (reported on 35.5% of returns)
This zip code:
$619
Pennsylvania:
$1,657
(% of AGI for various income ranges: 8.4% for AGIs below $10k, 1.5% for AGIs $10k-25k, 0.5% for AGIs $25k-50k, 0.1% for AGIs $50k-75k, 0.1% for AGIs $75k-100k)
Taxable dividends: $872 (reported on 19.1% of returns)
Here:
$872
State:
$3,566
(% of AGI for various income ranges: 1.1% for AGIs below $10k, 2.2% for AGIs $10k-25k, 0.2% for AGIs $25k-50k, 0.0% for AGIs $50k-75k)
Profit/loss from business: +$5,034 (reported on 12.9% of returns)
Here:
+$5,034
State:
+$14,267
(% of AGI for various income ranges: 10.5% for AGIs below $10k, 3.4% for AGIs $10k-25k, 3.5% for AGIs $25k-50k, 0.5% for AGIs $50k-75k)
IRA payment deduction: $1,300 (reported on 2.2% of returns)
16639:
$1,300
Pennsylvania:
$2,903
Total itemized deductions: $13,655 (21% of AGI, reported on 12.2% of returns)
Here:
$13,655
State:
$18,804
Here:
20.8% of AGI
State:
19.5% of AGI
Charity contributions deductions: $1,297 (2% of AGI, reported on 8.2% of returns)
Here:
$1,297
State:
$3,337
Here:
1.8% of AGI
State:
3.3% of AGI
(% of AGI for various income ranges: 0.6% for AGIs $10k-25k, 0.5% for AGIs $50k-75k, 0.6% for AGIs $75k-100k)
Total tax: $3,449 (reported on 67.6% of returns)
16639:
$3,449
State:
$8,008
(% of AGI for various income ranges: 2.2% for AGIs below $10k, 3.6% for AGIs $10k-25k, 6.7% for AGIs $25k-50k, 8.7% for AGIs $50k-75k, 12.9% for AGIs $75k-100k)
Earned income credit: $1,620 (reported on 20.4% of returns)
Here:
$1,620
State:
$1,643
Percentage of individuals using paid preparers for their 2004 taxes: 63.2%
Here:
63%
State:
56%
(% for various income ranges: 47.1% for AGIs below $10k, 68.8% for AGIs $10k-25k, 63.1% for AGIs $25k-50k, 70.2% for AGIs $50k-75k, 77.8% for AGIs $75k-100k)
Household received Food Stamps/SNAP in the past 12 months: 74 Household did not receive Food Stamps/SNAP in the past 12 months: 530
Women who had a birth in the past 12 months: 11 (7 now married, 3 unmarried) Women who did not have a birth in the past 12 months: 287 (144 now married, 142 unmarried)
Housing units in zip code 16639 with a mortgage: 207 (19 second mortgage, 19 both second mortgage and home equity loan) Houses without a mortgage: 32
Median monthly owner costs for units with a mortgage: $1,205 Median monthly owner costs for units without a mortgage: $588
Residents with income below the poverty level in 2022:
This zip code:
10.3%
Whole state:
11.8%
Residents with income below 50% of the poverty level in 2022:
This zip code:
5.2%
Whole state:
6.1%
Median number of rooms in houses and condos:
Here:
6.2
State:
6.8
Median number of rooms in apartments:
Here:
4.3
State:
4.3
Notable locations in this zip code not listed on our city pages
Size of family households: 202 2-persons, 158 3-persons, 60 4-persons, 17 5-persons, 2 6-persons, 1 7-or-more-persons
Size of nonfamily households: 123 1-person, 28 2-persons, 6 3-persons
165 married couples with children.
26 single-parent households (9 men, 17 women).
99.0% of residents of 16639 zip code speak English at home.
0.1% of residents speak Spanish at home (100% very well).
0.4% of residents speak other Indo-European language at home (100% very well).
Foreign born population: 3 (0.2%) (0.0% of them are naturalized citizens)
:
0.2%
Whole state:
7.5%
67%France
31%German
20%English
11%Italian
8%Irish
7%American
6%Scottish
3%European
Year of entry for the foreign-born population
02010 or later
22000 to 2009
01990 to 1999
2Before 1990
Housing units lacking complete plumbing facilities: 12.0% Housing units lacking complete kitchen facilities: 11.0%
70.7%Fuel oil, kerosene, etc.
13.5%Coal or coke
7.3%Electricity
6.4%Wood
1.0%Bottled, tank, or LP gas
0.8%Other fuel
0.7%Utility gas
Population in 1990: 684. Population change in the 1990s: +982 (+143.6%).
Place of birth for U.S.-born residents:
This state: 1,274
Northeast: 44
Midwest: 29
South: 54
West: 8
70% of the 16639 zip code residents lived in the same house 5 years ago. Out of people who lived in different houses, 43% lived in this county. Out of people who lived in different counties, 50% lived in Pennsylvania.
97% of the 16639 zip code residents lived in the same house 1 year ago. Out of people who lived in different houses, 24% moved from this county. Out of people who lived in different houses, 86% moved from different county within same state.
Private vs. public school enrollment:
Students in private schools in grades 1 to 8 (elementary and middle school): 11
Here:
14.9%
Pennsylvania:
15.7%
Students in private schools in grades 9 to 12 (high school): 2
Here:
11.2%
Pennsylvania:
13.4%
Students in private undergraduate colleges: 8
Here:
16.2%
Pennsylvania:
39.8%
Occupation by median earnings in the past 12 months ($)
169,110Architecture and engineering occupations
89,969Health diagnosing and treating practitioners and other technical occupations
76,149Management occupations
68,127Health technologists and technicians
67,788Installation, maintenance, and repair occupations
61,442Healthcare support occupations
Top industries in this zip code by the number of employees in 2005:
Wholesale Trade: Metal Service Centers and Other Metal Merchant Wholesalers (50-99 employees: 1 establishment)
Other Services (except Public Administration): Religious Organizations (5-9: 1, 1-4: 2)
Health Care and Social Assistance: Homes for the Elderly (5-9: 1)
Administrative and Support and Waste Management and Remediation Services: Professional Employer Organizations (5-9: 1)
Other Services (except Public Administration): Automotive Body, Paint, and Interior Repair and Maintenance (1-4: 1)
Arts, Entertainment, and Recreation: All Other Amusement and Recreation Industries (1-4: 1)
Professional, Scientific, and Technical Services: Surveying and Mapping (except Geophysical) Services (1-4: 1)
Construction: New Single-Family Housing Construction (except Operative Builders) (1-4: 1)
People in group quarters in 2010:
21 people in residential treatment centers for juveniles (non-correctional)
People in group quarters in 2000:
89 people in other noninstitutional group quarters
20 people in nursing homes
19 people in homes for the mentally retarded
7 people in religious group quarters
Home Mortgage Disclosure Act Aggregated Statistics For Year 2009 (Based on 2 partial tracts)
A) FHA, FSA/RHS & VA Home Purchase Loans
B) Conventional Home Purchase Loans
C) Refinancings
D) Home Improvement Loans
F) Non-occupant Loans on < 5 Family Dwellings (A B C & D)
G) Loans On Manufactured Home Dwelling (A B C & D)
Number
Average Value
Number
Average Value
Number
Average Value
Number
Average Value
Number
Average Value
Number
Average Value
LOANS ORIGINATED
4
$96,025
23
$84,200
32
$95,101
8
$12,088
7
$76,743
7
$47,197
APPLICATIONS APPROVED, NOT ACCEPTED
0
$0
0
$0
5
$75,476
4
$11,080
0
$0
0
$0
APPLICATIONS DENIED
0
$0
11
$88,150
20
$105,560
8
$31,729
4
$147,730
8
$47,341
APPLICATIONS WITHDRAWN
0
$0
3
$43,423
8
$85,952
1
$18,800
1
$47,010
5
$85,414
FILES CLOSED FOR INCOMPLETENESS
0
$0
0
$0
0
$0
0
$0
0
$0
0
$0
Aggregated Statistics For Year 2008 (Based on 2 partial tracts)
A) FHA, FSA/RHS & VA Home Purchase Loans
B) Conventional Home Purchase Loans
C) Refinancings
D) Home Improvement Loans
F) Non-occupant Loans on < 5 Family Dwellings (A B C & D)
G) Loans On Manufactured Home Dwelling (A B C & D)
Number
Average Value
Number
Average Value
Number
Average Value
Number
Average Value
Number
Average Value
Number
Average Value
LOANS ORIGINATED
5
$55,332
26
$94,113
38
$89,380
23
$20,145
13
$104,961
8
$58,589
APPLICATIONS APPROVED, NOT ACCEPTED
1
$114,160
4
$129,935
7
$59,476
0
$0
0
$0
4
$71,180
APPLICATIONS DENIED
5
$96,428
11
$88,150
46
$81,368
17
$48,348
8
$80,916
11
$69,836
APPLICATIONS WITHDRAWN
3
$83,713
3
$70,730
24
$112,364
3
$58,643
3
$34,917
3
$111,020
FILES CLOSED FOR INCOMPLETENESS
0
$0
1
$80,580
1
$96,700
1
$49,690
0
$0
0
$0
Aggregated Statistics For Year 2007 (Based on 2 partial tracts)
A) FHA, FSA/RHS & VA Home Purchase Loans
B) Conventional Home Purchase Loans
C) Refinancings
D) Home Improvement Loans
F) Non-occupant Loans on < 5 Family Dwellings (A B C & D)
G) Loans On Manufactured Home Dwelling (A B C & D)
Number
Average Value
Number
Average Value
Number
Average Value
Number
Average Value
Number
Average Value
Number
Average Value
LOANS ORIGINATED
3
$100,727
31
$88,508
39
$73,624
16
$45,662
4
$151,088
9
$47,303
APPLICATIONS APPROVED, NOT ACCEPTED
1
$84,610
13
$73,245
11
$54,696
5
$25,786
3
$40,290
5
$58,286
APPLICATIONS DENIED
1
$85,950
13
$54,340
67
$72,903
15
$61,241
0
$0
9
$63,718
APPLICATIONS WITHDRAWN
0
$0
3
$76,103
16
$90,652
1
$17,460
0
$0
0
$0
FILES CLOSED FOR INCOMPLETENESS
0
$0
1
$134,300
5
$133,762
0
$0
0
$0
1
$107,440
Aggregated Statistics For Year 2006 (Based on 2 partial tracts)
A) FHA, FSA/RHS & VA Home Purchase Loans
B) Conventional Home Purchase Loans
C) Refinancings
D) Home Improvement Loans
F) Non-occupant Loans on < 5 Family Dwellings (A B C & D)
G) Loans On Manufactured Home Dwelling (A B C & D)
Number
Average Value
Number
Average Value
Number
Average Value
Number
Average Value
Number
Average Value
Number
Average Value
LOANS ORIGINATED
7
$91,707
50
$76,578
39
$66,771
32
$29,588
8
$77,222
15
$52,377
APPLICATIONS APPROVED, NOT ACCEPTED
0
$0
8
$82,259
7
$61,203
3
$22,383
0
$0
4
$43,982
APPLICATIONS DENIED
3
$55,510
7
$55,830
55
$82,778
27
$43,772
3
$74,313
7
$34,919
APPLICATIONS WITHDRAWN
0
$0
3
$42,530
26
$74,433
5
$78,968
0
$0
3
$69,390
FILES CLOSED FOR INCOMPLETENESS
0
$0
0
$0
1
$81,920
0
$0
0
$0
0
$0
Aggregated Statistics For Year 2005 (Based on 2 partial tracts)
A) FHA, FSA/RHS & VA Home Purchase Loans
B) Conventional Home Purchase Loans
C) Refinancings
D) Home Improvement Loans
F) Non-occupant Loans on < 5 Family Dwellings (A B C & D)
G) Loans On Manufactured Home Dwelling (A B C & D)
Number
Average Value
Number
Average Value
Number
Average Value
Number
Average Value
Number
Average Value
Number
Average Value
LOANS ORIGINATED
0
$0
36
$69,873
60
$67,777
21
$36,645
9
$55,063
20
$53,586
APPLICATIONS APPROVED, NOT ACCEPTED
0
$0
11
$68,859
9
$58,793
0
$0
0
$0
1
$51,030
APPLICATIONS DENIED
1
$84,610
24
$56,798
93
$84,132
28
$37,892
3
$1,343
28
$55,015
APPLICATIONS WITHDRAWN
0
$0
12
$61,666
44
$81,984
3
$152,653
4
$82,930
3
$31,337
FILES CLOSED FOR INCOMPLETENESS
0
$0
0
$0
12
$73,082
1
$76,550
0
$0
0
$0
Aggregated Statistics For Year 2004 (Based on 2 partial tracts)
A) FHA, FSA/RHS & VA Home Purchase Loans
B) Conventional Home Purchase Loans
C) Refinancings
D) Home Improvement Loans
F) Non-occupant Loans on < 5 Family Dwellings (A B C & D)
G) Loans On Manufactured Home Dwelling (A B C & D)
Number
Average Value
Number
Average Value
Number
Average Value
Number
Average Value
Number
Average Value
Number
Average Value
LOANS ORIGINATED
1
$127,590
31
$64,334
63
$59,518
24
$36,093
5
$55,868
12
$47,117
APPLICATIONS APPROVED, NOT ACCEPTED
0
$0
7
$80,580
16
$64,044
8
$15,949
1
$80,580
5
$60,436
APPLICATIONS DENIED
1
$100,730
17
$60,277
97
$62,055
23
$23,065
4
$41,632
20
$48,348
APPLICATIONS WITHDRAWN
0
$0
5
$66,076
50
$66,640
8
$43,480
3
$55,960
11
$55,429
FILES CLOSED FOR INCOMPLETENESS
0
$0
1
$57,750
15
$78,252
1
$25,520
0
$0
0
$0
Aggregated Statistics For Year 2003 (Based on 2 partial tracts)
A) FHA, FSA/RHS & VA Home Purchase Loans
B) Conventional Home Purchase Loans
C) Refinancings
D) Home Improvement Loans
F) Non-occupant Loans on < 5 Family Dwellings (A B C & D)
Number
Average Value
Number
Average Value
Number
Average Value
Number
Average Value
Number
Average Value
LOANS ORIGINATED
1
$77,890
38
$59,834
101
$57,776
15
$27,039
5
$29,546
APPLICATIONS APPROVED, NOT ACCEPTED
1
$61,780
3
$65,807
21
$70,731
4
$20,480
0
$0
APPLICATIONS DENIED
1
$76,550
9
$50,288
83
$58,396
23
$24,933
1
$32,230
APPLICATIONS WITHDRAWN
0
$0
1
$30,890
38
$63,121
1
$20,150
1
$30,890
FILES CLOSED FOR INCOMPLETENESS
0
$0
1
$40,290
9
$71,030
0
$0
0
$0
Aggregated Statistics For Year 2002 (Based on 2 partial tracts)
A) FHA, FSA/RHS & VA Home Purchase Loans
B) Conventional Home Purchase Loans
C) Refinancings
D) Home Improvement Loans
F) Non-occupant Loans on < 5 Family Dwellings (A B C & D)
Number
Average Value
Number
Average Value
Number
Average Value
Number
Average Value
Number
Average Value
LOANS ORIGINATED
4
$68,158
27
$53,571
58
$1,880,177
12
$15,892
5
$21,185,556
APPLICATIONS APPROVED, NOT ACCEPTED
0
$0
4
$21,488
16
$66,394
5
$21,756
0
$0
APPLICATIONS DENIED
1
$44,320
17
$47,795
54
$47,502
5
$17,460
4
$19,810
APPLICATIONS WITHDRAWN
0
$0
5
$65,002
31
$55,280
1
$4,030
1
$42,980
FILES CLOSED FOR INCOMPLETENESS
0
$0
1
$181,310
7
$67,726
0
$0
1
$77,890
Aggregated Statistics For Year 2001 (Based on 2 partial tracts)
A) FHA, FSA/RHS & VA Home Purchase Loans
B) Conventional Home Purchase Loans
C) Refinancings
D) Home Improvement Loans
F) Non-occupant Loans on < 5 Family Dwellings (A B C & D)
Number
Average Value
Number
Average Value
Number
Average Value
Number
Average Value
Number
Average Value
LOANS ORIGINATED
5
$62,316
21
$51,418
52
$47,857
16
$12,339
4
$22,160
APPLICATIONS APPROVED, NOT ACCEPTED
0
$0
4
$47,340
15
$51,840
1
$13,430
0
$0
APPLICATIONS DENIED
0
$0
15
$44,946
51
$36,156
16
$18,970
1
$79,240
APPLICATIONS WITHDRAWN
0
$0
1
$69,840
35
$44,242
4
$10,408
3
$51,930
FILES CLOSED FOR INCOMPLETENESS
0
$0
0
$0
7
$72,714
0
$0
0
$0
Aggregated Statistics For Year 2000 (Based on 2 partial tracts)
A) FHA, FSA/RHS & VA Home Purchase Loans
B) Conventional Home Purchase Loans
C) Refinancings
D) Home Improvement Loans
F) Non-occupant Loans on < 5 Family Dwellings (A B C & D)
Number
Average Value
Number
Average Value
Number
Average Value
Number
Average Value
Number
Average Value
LOANS ORIGINATED
4
$46,332
23
$48,932
27
$37,753
27
$10,097
1
$26,860
APPLICATIONS APPROVED, NOT ACCEPTED
0
$0
8
$33,408
20
$41,498
11
$9,035
1
$26,860
APPLICATIONS DENIED
0
$0
12
$34,694
40
$38,544
28
$11,847
0
$0
APPLICATIONS WITHDRAWN
1
$45,660
5
$55,064
19
$26,718
4
$9,400
1
$143,700
FILES CLOSED FOR INCOMPLETENESS
0
$0
0
$0
0
$0
0
$0
0
$0
Aggregated Statistics For Year 1999 (Based on 1 partial tract)
A) FHA, FSA/RHS & VA Home Purchase Loans
B) Conventional Home Purchase Loans
C) Refinancings
D) Home Improvement Loans
E) Loans on Dwellings For 5+ Families
F) Non-occupant Loans on < 5 Family Dwellings (A B C & D)


 Nearest zip codes: 16619, 16616, 16627, 16680, 16671, 16636.


