Estimated zip code population in 2022: 3,820 Zip code population in 2010: 3,688 Zip code population in 2000: 3,916
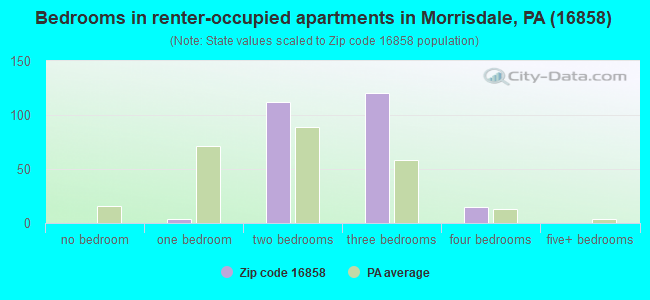
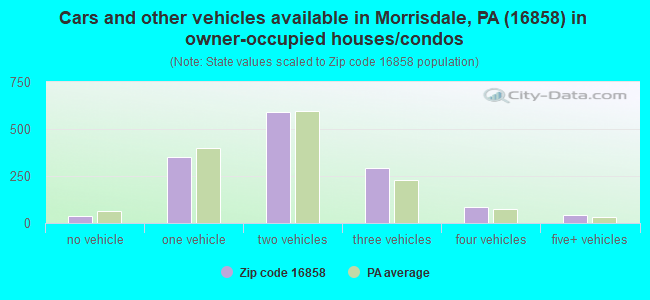
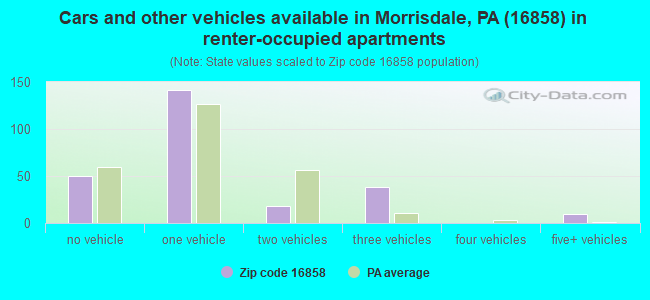
Houses and condos: 1,869 Renter-occupied apartments: 256
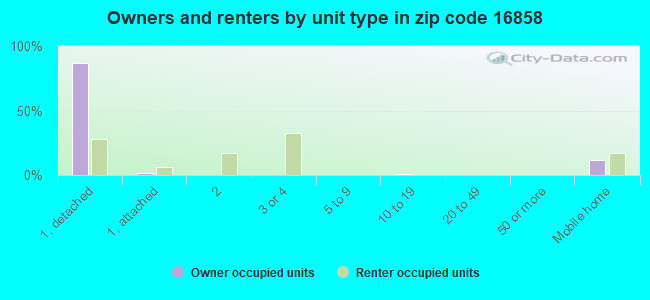
% of renters here:
15%
State:
31%
March 2022 cost of living index in zip code 16858: 92.0 (less than average, U.S. average is 100)
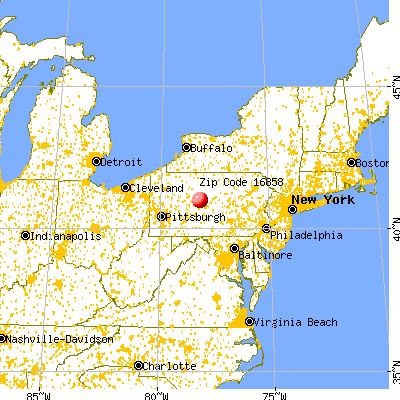
Land area: 53.7 sq. mi. Water area: 0.3 sq. mi.
Population density: 71 people per square mile
(very low).
OSM Map
General Map
Google Map
MSN Map
OSM Map
General Map
Google Map
MSN Map
OSM Map
General Map
Google Map
MSN Map
OSM Map
General Map
Google Map
MSN Map
Please wait while loading the map...
Real estate property taxes paid for housing units in 2022:
This zip code:
1.0% ($1,663)
Pennsylvania:
1.3% ($3,094)
Median real estate property taxes paid for housing units with mortgages in 2022: $1,707 (0.9%) Median real estate property taxes paid for housing units with no mortgage in 2022: $1,631 (1.1%)
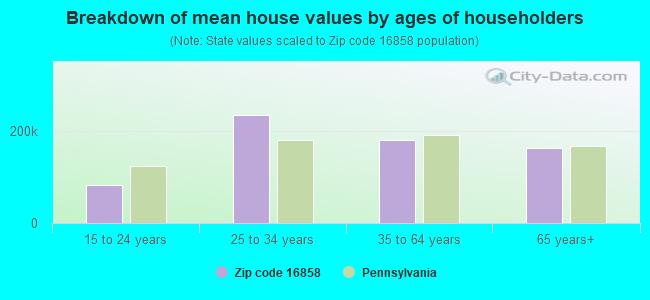
Estimated median house/condo value in 2022: $168,334
16858:
$168,334
Pennsylvania:
$245,500
According to our research of Pennsylvania and other state lists, there were 7 registered sex offenders living in 16858 zip code as of June 15, 2024. The ratio of all residents to sex offenders in zip code 16858 is 578 to 1. The ratio of registered sex offenders to all residents in this zip code is near the state average.
Median resident age:
This zip code:
51.2 years
Pennsylvania median age:
40.9 years
Average household size:
This zip code:
2.3 people
Pennsylvania:
2.4 people
Averages for the 2020 tax year for zip code 16858, filed in 2021:
Average Adjusted Gross Income (AGI) in 2020: $52,676 (Individual Income Tax Returns)
Here:
$52,676
State:
$75,707
Salary/wage: $47,424 (reported on 80.8% of returns)
Here:
$47,424
State:
$62,806
(% of AGI for various income ranges: 996.1% for AGIs below $25k, 3462.1% for AGIs $25k-50k, 6059.0% for AGIs $50k-75k, 8501.2% for AGIs $75k-100k, 15722.5% for AGIs $100k-200k)
Taxable interest for individuals: $525 (reported on 33.9% of returns)
This zip code:
$525
Pennsylvania:
$1,633
(% of AGI for various income ranges: 18.4% for AGIs below $25k, 18.9% for AGIs $25k-50k, 32.5% for AGIs $50k-75k, 38.8% for AGIs $75k-100k, 28.7% for AGIs $100k-200k)
Ordinary dividends: $1,572 (reported on 14.1% of returns)
Here:
$1,572
State:
$7,382
(% of AGI for various income ranges: 15.5% for AGIs below $25k, 41.3% for AGIs $25k-50k, 19.0% for AGIs $50k-75k, 58.1% for AGIs $75k-100k, 28.7% for AGIs $100k-200k)
Net capital gain/loss in AGI: +$4,612 (reported on 9.6% of returns)
Here:
+$4,612
State:
+$23,522
(% of AGI for various income ranges: 7.6% for AGIs below $25k, 25.3% for AGIs $25k-50k, 66.5% for AGIs $50k-75k, 139.4% for AGIs $75k-100k, 189.4% for AGIs $100k-200k)
Profit/loss from business: +$8,906 (reported on 10.2% of returns)
Here:
+$8,906
State:
+$16,274
(% of AGI for various income ranges: 79.2% for AGIs below $25k, 86.6% for AGIs $25k-50k, 151.0% for AGIs $50k-75k, 164.4% for AGIs $75k-100k, 255.0% for AGIs $100k-200k)
Taxable individual retirement arrangement distribution: $9,218 (reported on 12.4% of returns)
16858:
$9,218
Pennsylvania:
$18,583
(% of AGI for various income ranges: 107.6% for AGIs below $25k, 99.7% for AGIs $25k-50k, 177.0% for AGIs $50k-75k, 238.8% for AGIs $75k-100k, 315.0% for AGIs $100k-200k)
Total itemized deductions: $22,233 (reported on 1.7% of returns)
Here:
$22,233
State:
$34,850
(% of AGI for various income ranges: 333.5% for AGIs $50k-75k)
Taxes paid: $8,200 (reported on 1.1% of returns)
16858:
$8,200
State:
$8,200
(% of AGI for various income ranges: 82.0% for AGIs $50k-75k)
Earned income credit: $1,900 (reported on 13.6% of returns)
Here:
$1,900
State:
$2,100
(% of AGI for various income ranges: 65.8% for AGIs below $25k, 54.2% for AGIs $25k-50k)
Percentage of individuals using paid preparers for their 2020 taxes: 94.4%
Here:
94%
State:
92%
(% for various income ranges: 93.0% for AGIs below $25k, 93.8% for AGIs $25k-50k, 96.2% for AGIs $50k-75k, 95.5% for AGIs $75k-100k, 95.8% for AGIs $100k-200k)
Averages for the 2012 tax year for zip code 16858, filed in 2013:
Average Adjusted Gross Income (AGI) in 2012: $41,588 (Individual Income Tax Returns)
Here:
$41,588
State:
$61,346
Salary/wage: $37,977 (reported on 83.9% of returns)
Here:
$37,977
State:
$51,902
(% of AGI for various income ranges: 65.7% for AGIs below $25k, 78.8% for AGIs $25k-50k, 83.0% for AGIs $50k-75k, 79.9% for AGIs $75k-100k, 68.0% for AGIs $100k-200k)
Taxable interest for individuals: $725 (reported on 35.1% of returns)
This zip code:
$725
Pennsylvania:
$1,588
(% of AGI for various income ranges: 1.8% for AGIs below $25k, 0.7% for AGIs $25k-50k, 0.6% for AGIs $50k-75k, 0.2% for AGIs $75k-100k, 0.3% for AGIs $100k-200k)
Ordinary dividends: $972 (reported on 14.9% of returns)
Here:
$972
State:
$5,827
(% of AGI for various income ranges: 0.8% for AGIs below $25k, 0.4% for AGIs $25k-50k, 0.3% for AGIs $50k-75k, 0.4% for AGIs $75k-100k)
Net capital gain/loss in AGI: +$1,533 (reported on 8.9% of returns)
Here:
+$1,533
State:
+$14,495
(% of AGI for various income ranges: 0.3% for AGIs below $25k, 0.5% for AGIs $25k-50k, 1.0% for AGIs $75k-100k)
Profit/loss from business: +$8,040 (reported on 11.9% of returns)
Here:
+$8,040
State:
+$16,268
(% of AGI for various income ranges: 7.8% for AGIs below $25k, 2.0% for AGIs $25k-50k, 1.5% for AGIs $50k-75k, 2.7% for AGIs $75k-100k)
Taxable individual retirement arrangement distribution: $7,189 (reported on 11.3% of returns)
16858:
$7,189
Pennsylvania:
$14,550
(% of AGI for various income ranges: 4.7% for AGIs below $25k, 1.4% for AGIs $25k-50k, 1.5% for AGIs $50k-75k, 3.4% for AGIs $75k-100k)
Total itemized deductions: $18,420 (23% of AGI, reported on 14.9% of returns)
Here:
$18,420
State:
$23,538
Here:
22.7% of AGI
State:
18.4% of AGI
(% of AGI for various income ranges: 6.0% for AGIs $25k-50k, 5.4% for AGIs $50k-75k, 7.9% for AGIs $75k-100k, 11.7% for AGIs $100k-200k)
Charity contributions: $3,469 (reported on 9.5% of returns)
Here:
$3,469
State:
$4,025
(% of AGI for various income ranges: 0.5% for AGIs $25k-50k, 0.7% for AGIs $50k-75k, 1.1% for AGIs $75k-100k, 1.5% for AGIs $100k-200k)
Taxes paid: $5,288 (reported on 14.9% of returns)
16858:
$5,288
State:
$9,982
(% of AGI for various income ranges: 1.1% for AGIs $25k-50k, 1.3% for AGIs $50k-75k, 2.5% for AGIs $75k-100k, 4.2% for AGIs $100k-200k)
Earned income credit: $1,981 (reported on 16.1% of returns)
Here:
$1,981
State:
$2,106
(% of AGI for various income ranges: 5.0% for AGIs below $25k, 0.9% for AGIs $25k-50k)
Percentage of individuals using paid preparers for their 2012 taxes: 57.1%
Here:
57%
State:
53%
(% for various income ranges: 52.2% for AGIs below $25k, 56.8% for AGIs $25k-50k, 63.3% for AGIs $50k-75k, 58.8% for AGIs $75k-100k, 70.0% for AGIs $100k-200k)
Averages for the 2004 tax year for zip code 16858, filed in 2005:
Average Adjusted Gross Income (AGI) in 2004: $33,758 (Individual Income Tax Returns)
Here:
$33,758
State:
$48,049
Salary/wage: $31,082 (reported on 88.3% of returns)
Here:
$31,082
State:
$42,646
(% of AGI for various income ranges: 83.1% for AGIs below $10k, 76.7% for AGIs $10k-25k, 84.5% for AGIs $25k-50k, 86.8% for AGIs $50k-75k, 83.6% for AGIs $75k-100k, 55.4% for AGIs over 100k)
Taxable interest for individuals: $989 (reported on 38.9% of returns)
This zip code:
$989
Pennsylvania:
$1,657
(% of AGI for various income ranges: 4.9% for AGIs below $10k, 2.2% for AGIs $10k-25k, 1.1% for AGIs $25k-50k, 0.7% for AGIs $50k-75k, 0.3% for AGIs $75k-100k, 1.2% for AGIs over 100k)
Taxable dividends: $1,168 (reported on 17.3% of returns)
Here:
$1,168
State:
$3,566
(% of AGI for various income ranges: 1.0% for AGIs below $10k, 0.5% for AGIs $10k-25k, 0.4% for AGIs $25k-50k, 0.1% for AGIs $50k-75k, 0.3% for AGIs $75k-100k, 3.2% for AGIs over 100k)
Net capital gain/loss: +$1,942 (reported on 12.1% of returns)
Here:
+$1,942
State:
+$9,716
(% of AGI for various income ranges: 2.2% for AGIs below $10k, -0.2% for AGIs $10k-25k, 0.6% for AGIs $25k-50k, 0.7% for AGIs $50k-75k, 1.3% for AGIs $75k-100k, 1.0% for AGIs over 100k)
Profit/loss from business: +$5,355 (reported on 14.4% of returns)
Here:
+$5,355
State:
+$14,267
(% of AGI for various income ranges: 8.3% for AGIs below $10k, 5.1% for AGIs $10k-25k, 1.7% for AGIs $25k-50k, 2.7% for AGIs $50k-75k, 0.2% for AGIs $75k-100k)
IRA payment deduction: $2,769 (reported on 3.3% of returns)
16858:
$2,769
Pennsylvania:
$2,903
Total itemized deductions: $14,675 (23% of AGI, reported on 15.9% of returns)
Here:
$14,675
State:
$18,804
Here:
22.5% of AGI
State:
19.5% of AGI
(% of AGI for various income ranges: 3.7% for AGIs $10k-25k, 4.6% for AGIs $25k-50k, 7.9% for AGIs $50k-75k, 12.7% for AGIs $75k-100k, 10.9% for AGIs over 100k)
Charity contributions deductions: $2,195 (3% of AGI, reported on 12.6% of returns)
Here:
$2,195
State:
$3,337
Here:
3.1% of AGI
State:
3.3% of AGI
(% of AGI for various income ranges: 0.2% for AGIs $10k-25k, 0.4% for AGIs $25k-50k, 1.0% for AGIs $50k-75k, 1.5% for AGIs $75k-100k, 1.8% for AGIs over 100k)
Total tax: $3,533 (reported on 75.7% of returns)
16858:
$3,533
State:
$8,008
(% of AGI for various income ranges: 2.4% for AGIs below $10k, 4.5% for AGIs $10k-25k, 6.3% for AGIs $25k-50k, 8.1% for AGIs $50k-75k, 9.4% for AGIs $75k-100k, 17.4% for AGIs over 100k)
Earned income credit: $1,562 (reported on 16.3% of returns)
Here:
$1,562
State:
$1,643
Percentage of individuals using paid preparers for their 2004 taxes: 62.9%
Here:
63%
State:
56%
(% for various income ranges: 57.8% for AGIs below $10k, 66.7% for AGIs $10k-25k, 63.0% for AGIs $25k-50k, 62.9% for AGIs $50k-75k, 60.8% for AGIs $75k-100k, 67.7% for AGIs over 100k)
Likely homosexual households (counted as self-reported same-sex unmarried-partner households)
Lesbian couples: 0.6% of all households
Gay men: 0.0% of all households
Household received Food Stamps/SNAP in the past 12 months: 167 Household did not receive Food Stamps/SNAP in the past 12 months: 1,485
Women who had a birth in the past 12 months: 70 (58 now married, 13 unmarried) Women who did not have a birth in the past 12 months: 695 (243 now married, 452 unmarried)
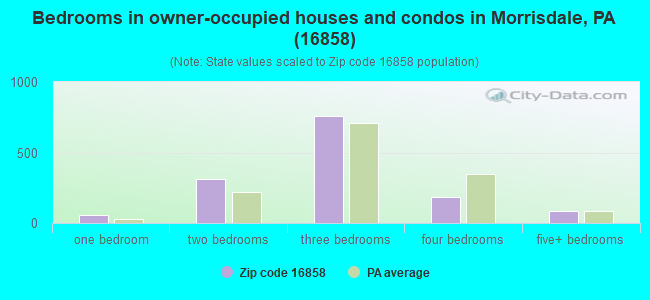
Housing units in zip code 16858 with a mortgage: 725 (96 second mortgage, 2 home equity loan, 86 both second mortgage and home equity loan) Houses without a mortgage: 70
Median monthly owner costs for units with a mortgage: $1,195 Median monthly owner costs for units without a mortgage: $505
Residents with income below the poverty level in 2022:
This zip code:
11.7%
Whole state:
11.8%
Residents with income below 50% of the poverty level in 2022:
This zip code:
8.7%
Whole state:
6.1%
Median number of rooms in houses and condos:
Here:
6.2
State:
6.8
Median number of rooms in apartments:
Here:
4.9
State:
4.3
Notable locations in this zip code not listed on our city pages
Notable locations in zip code 16858: Forest (A), Viaduct (B), Singleton (C), Morris Township Volunteer Fire Company 1 Station 17 (D), Grassflat Volunteer Fire Company Station 19 (E). Display/hide their locations on the map
Churches in zip code 16858 include: Messiah Church (A), Saint Johns Church (B), Fairview Church (C), Palestine Church (D), Summit Hill Church (E), Sylvan Grove Church (F). Display/hide their locations on the map
Cemeteries: Saint Agnes Cemetery (1), New Cemetery (2), Hunter Cemetery (3), Immanuel Cemetery (4), Center Hill Cemetery (5), Emigh Cemetery (6). Display/hide their locations on the map
Streams, rivers, and creeks: Big Run (A), Hubler Run (B), Moravian Run (C), Mons Run (D), Grassflat Run (E), Flat Run (F), Willholm Run (G), Knox Run (H), Rolling Stone Run (I). Display/hide their locations on the map
Size of family households: 587 2-persons, 167 3-persons, 180 4-persons, 82 5-persons, 38 6-persons, 17 7-or-more-persons
Size of nonfamily households: 547 1-person, 32 2-persons
484 married couples with children.
145 single-parent households (42 men, 103 women).
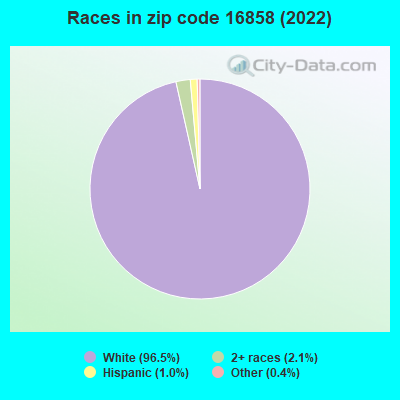
97.2% of residents of 16858 zip code speak English at home.
0.5% of residents speak Spanish at home (35% very well, 65% well).
2.3% of residents speak other Indo-European language at home (37% very well, 63% well).
Foreign born population: 0 (0.0%)
:
0.0%
Whole state:
7.5%
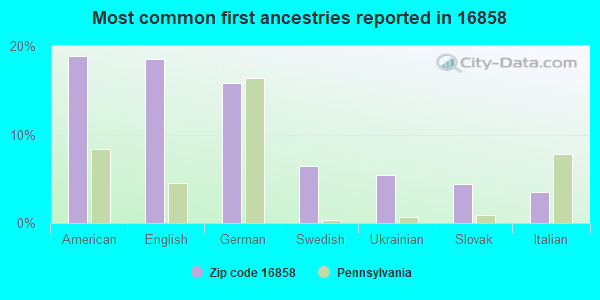
19%American
19%English
16%German
6%Swedish
5%Ukrainian
4%Slovak
3%Italian
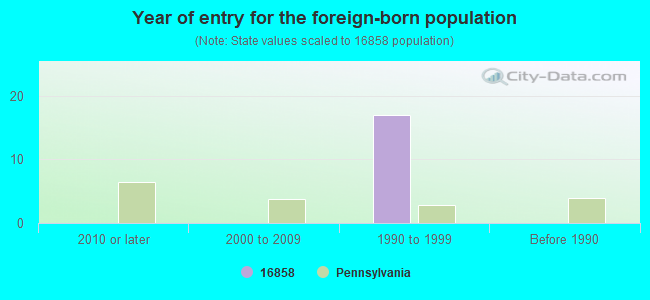
Year of entry for the foreign-born population
02010 or later
02000 to 2009
171990 to 1999
0Before 1990
Facilities with environmental interests located in this zip code:
BRENDA BUCK (2720 ALLPORT CUTOFF in MORRISDALE, PA)
National Pollutant Discharge Elimination System NON-MAJOR (Tracking pollutant discharge elimination systems) - permit Business SIC classification: OPERATORS OF DWELLINGS OTHER THAN APARTMENT BUILDINGS Alternative names: BUCK, BRENDA, BUCK, THOMAS & YVONNE, THOMAS AND YVONNE BUCK
Housing units lacking complete plumbing facilities: 3.1% Housing units lacking complete kitchen facilities: 3.4%
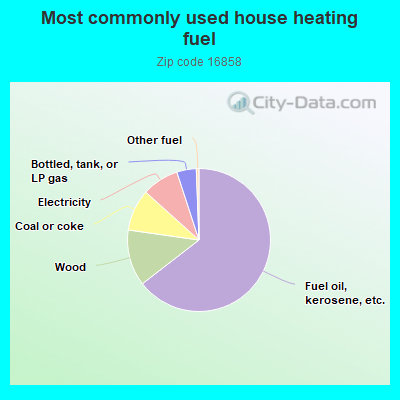
64.4%Fuel oil, kerosene, etc.
12.7%Wood
9.4%Coal or coke
8.3%Electricity
4.4%Bottled, tank, or LP gas
0.6%Other fuel
Population in 1990: 1,235. Population change in the 1990s: +2,681 (+217.1%).
Place of birth for U.S.-born residents:
This state: 3,556
Northeast: 103
Midwest: 54
South: 52
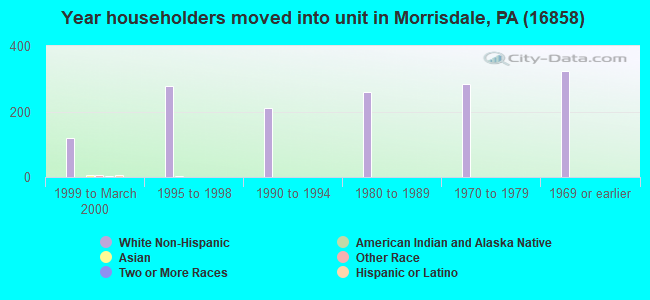
74% of the 16858 zip code residents lived in the same house 5 years ago. Out of people who lived in different houses, 66% lived in this county. Out of people who lived in different counties, 50% lived in Pennsylvania.
100% of the 16858 zip code residents lived in the same house 1 year ago. Out of people who lived in different houses, 56% moved from this county. Out of people who lived in different houses, 178% moved from different county within same state.
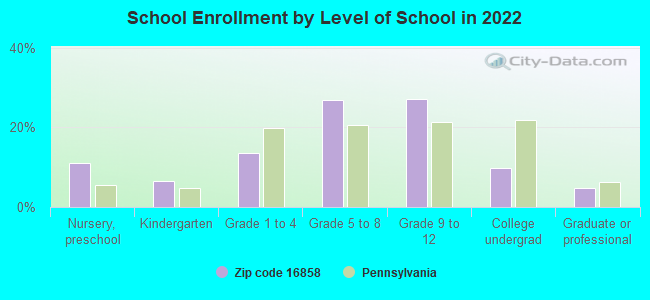
Private vs. public school enrollment:
Students in private schools in grades 1 to 8 (elementary and middle school): 30
Here:
10.7%
Pennsylvania:
15.7%
Students in private schools in grades 9 to 12 (high school): 24
Here:
12.5%
Pennsylvania:
13.4%
Students in private undergraduate colleges:
Here:
0.0%
Pennsylvania:
39.8%
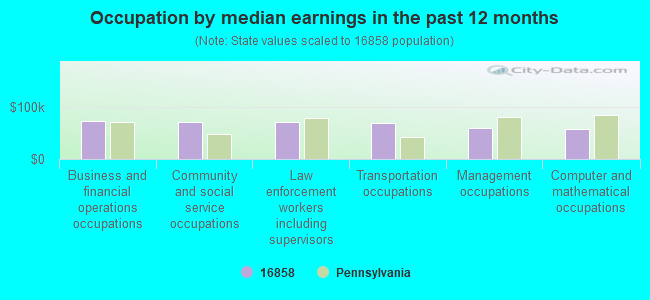
Occupation by median earnings in the past 12 months ($)
74,316Business and financial operations occupations
72,079Community and social service occupations
71,489Law enforcement workers including supervisors
70,204Transportation occupations
60,235Management occupations
59,114Computer and mathematical occupations
Top industries in this zip code by the number of employees in 2005:
Other Services (except Public Administration): Religious Organizations (5-9: 1, 1-4: 5)
Construction: Masonry Contractors (10-19: 1)
Construction: New Single-Family Housing Construction (except Operative Builders) (5-9: 1, 1-4: 2)
Other Services (except Public Administration): General Automotive Repair (5-9: 1, 1-4: 1)
People in group quarters in 2000:
6 people in nursing homes
2 people in religious group quarters
Fatal accident statistics in 2014:
Fatal accident count: 1
Vehicles involved in fatal accidents: 1
Fatal accidents caused by drunken drivers: 1
Fatalities: 1
Persons involved in fatal accidents: 1
Pedestrians involved in fatal accidents: 0
Fatal accident statistics in 2013:
Fatal accident count: 1
Vehicles involved in fatal accidents: 1
Fatal accidents caused by drunken drivers: 0
Fatalities: 1
Persons involved in fatal accidents: 1
Pedestrians involved in fatal accidents: 0
2005 - 2018 National Fire Incident Reporting System (NFIRS) incidents
According to the data from the years 2005 - 2018 the average number of fire incidents per year is 9. The highest number of reported fire incidents - 35 took place in 2016, and the least - 0 in 2009. The data has an increasing trend.
When looking into fire subcategories, the most incidents belonged to: Structure Fires (61.4%), and Outside Fires (23.6%).
Fire incident types reported to NFIRS in Zip Code 16858


 Nearest zip codes: 16821, 16847, 16879, 16860, 16840, 16839.


 According to the data from the years 2005 - 2018 the average number of fire incidents per year is 9. The highest number of reported fire incidents - 35 took place in 2016, and the least - 0 in 2009. The data has an increasing trend.
 When looking into fire subcategories, the most incidents belonged to: Structure Fires (61.4%), and Outside Fires (23.6%).