Estimated zip code population in 2022: 3,000 Zip code population in 2010: 3,588 Zip code population in 2000: 2,987
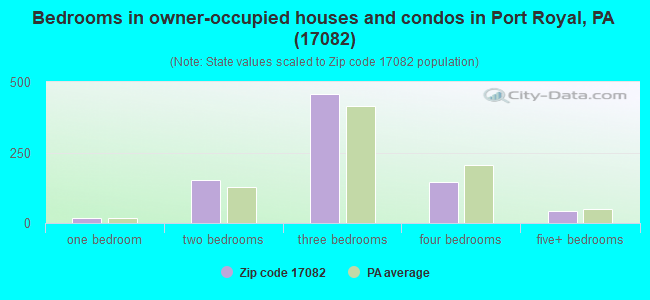
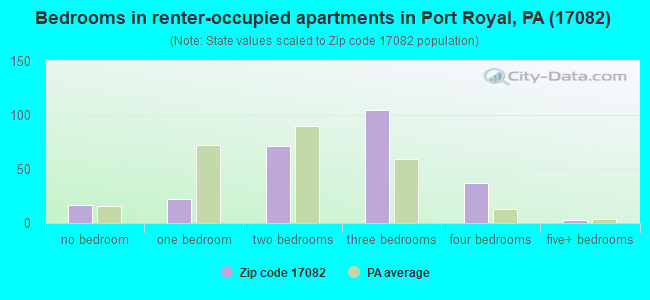
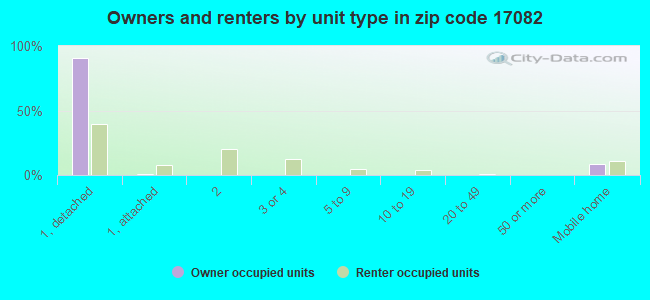
Houses and condos: 1,304 Renter-occupied apartments: 258
% of renters here:
24%
State:
31%
March 2022 cost of living index in zip code 17082: 91.6 (less than average, U.S. average is 100)
Land area: 58.2 sq. mi. Water area: 0.5 sq. mi.
Population density: 52 people per square mile
(very low).
OSM Map
General Map
Google Map
MSN Map
OSM Map
General Map
Google Map
MSN Map
OSM Map
General Map
Google Map
MSN Map
OSM Map
General Map
Google Map
MSN Map
Please wait while loading the map...
Real estate property taxes paid for housing units in 2022:
This zip code:
1.0% ($2,010)
Pennsylvania:
1.3% ($3,094)
Median real estate property taxes paid for housing units with mortgages in 2022: $2,187 (1.0%) Median real estate property taxes paid for housing units with no mortgage in 2022: $1,821 (1.0%)
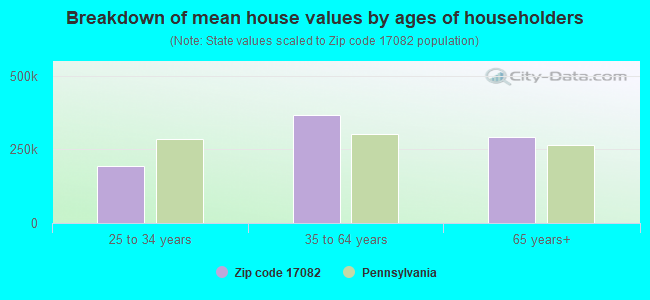
Estimated median house/condo value in 2022: $209,142
17082:
$209,142
Pennsylvania:
$245,500
According to our research of Pennsylvania and other state lists, there were 3 registered sex offenders living in 17082 zip code as of June 16, 2024. The ratio of all residents to sex offenders in zip code 17082 is 1,140 to 1. The ratio of registered sex offenders to all residents in this zip code is lower than the state average.
Median resident age:
This zip code:
40.9 years
Pennsylvania median age:
40.9 years
Average household size:
This zip code:
2.8 people
Pennsylvania:
2.4 people
Averages for the 2020 tax year for zip code 17082, filed in 2021:
Average Adjusted Gross Income (AGI) in 2020: $53,051 (Individual Income Tax Returns)
Here:
$53,051
State:
$75,707
Salary/wage: $47,369 (reported on 78.2% of returns)
Here:
$47,369
State:
$62,806
(% of AGI for various income ranges: 1298.5% for AGIs below $25k, 3525.6% for AGIs $25k-50k, 6168.4% for AGIs $50k-75k, 8836.9% for AGIs $75k-100k, 13790.8% for AGIs $100k-200k)
Taxable interest for individuals: $1,153 (reported on 35.2% of returns)
This zip code:
$1,153
Pennsylvania:
$1,633
(% of AGI for various income ranges: 46.7% for AGIs below $25k, 44.2% for AGIs $25k-50k, 75.8% for AGIs $50k-75k, 72.3% for AGIs $75k-100k, 69.2% for AGIs $100k-200k)
Ordinary dividends: $2,321 (reported on 20.6% of returns)
Here:
$2,321
State:
$7,382
(% of AGI for various income ranges: 47.0% for AGIs below $25k, 25.0% for AGIs $25k-50k, 53.2% for AGIs $50k-75k, 85.4% for AGIs $75k-100k, 276.9% for AGIs $100k-200k)
Net capital gain/loss in AGI: +$4,195 (reported on 12.1% of returns)
Here:
+$4,195
State:
+$23,522
(% of AGI for various income ranges: 27.0% for AGIs below $25k, 43.6% for AGIs $25k-50k, 81.6% for AGIs $50k-75k, 45.4% for AGIs $75k-100k, 303.8% for AGIs $100k-200k)
Profit/loss from business: +$22,652 (reported on 15.2% of returns)
Here:
+$22,652
State:
+$16,274
(% of AGI for various income ranges: 177.8% for AGIs below $25k, 223.9% for AGIs $25k-50k, 631.1% for AGIs $50k-75k, 293.8% for AGIs $75k-100k, 2150.8% for AGIs $100k-200k)
Taxable individual retirement arrangement distribution: $9,729 (reported on 10.3% of returns)
17082:
$9,729
Pennsylvania:
$18,583
(% of AGI for various income ranges: 119.6% for AGIs below $25k, 68.1% for AGIs $25k-50k, 270.0% for AGIs $50k-75k, 440.8% for AGIs $100k-200k)
Total itemized deductions: $26,800 (reported on 1.2% of returns)
Here:
$26,800
State:
$34,850
(% of AGI for various income ranges: 148.9% for AGIs $25k-50k)
Taxes paid: $6,350 (reported on 1.2% of returns)
17082:
$6,350
State:
$8,200
(% of AGI for various income ranges: 66.8% for AGIs $50k-75k)
Earned income credit: $1,705 (reported on 11.5% of returns)
Here:
$1,705
State:
$2,100
(% of AGI for various income ranges: 59.3% for AGIs below $25k, 45.6% for AGIs $25k-50k)
Percentage of individuals using paid preparers for their 2020 taxes: 94.5%
Here:
95%
State:
92%
(% for various income ranges: 94.1% for AGIs below $25k, 95.7% for AGIs $25k-50k, 92.6% for AGIs $50k-75k, 94.4% for AGIs $75k-100k, 94.7% for AGIs $100k-200k, 100.0% for AGIs over 200k)
Averages for the 2012 tax year for zip code 17082, filed in 2013:
Average Adjusted Gross Income (AGI) in 2012: $41,127 (Individual Income Tax Returns)
Here:
$41,127
State:
$61,346
Salary/wage: $38,073 (reported on 78.8% of returns)
Here:
$38,073
State:
$51,902
(% of AGI for various income ranges: 67.3% for AGIs below $25k, 73.1% for AGIs $25k-50k, 77.2% for AGIs $50k-75k, 76.9% for AGIs $75k-100k, 67.2% for AGIs $100k-200k)
Taxable interest for individuals: $1,297 (reported on 42.9% of returns)
This zip code:
$1,297
Pennsylvania:
$1,588
(% of AGI for various income ranges: 3.2% for AGIs below $25k, 1.2% for AGIs $25k-50k, 1.2% for AGIs $50k-75k, 0.9% for AGIs $75k-100k, 1.0% for AGIs $100k-200k)
Ordinary dividends: $1,379 (reported on 21.8% of returns)
Here:
$1,379
State:
$5,827
(% of AGI for various income ranges: 1.5% for AGIs below $25k, 0.7% for AGIs $25k-50k, 0.4% for AGIs $50k-75k, 0.7% for AGIs $75k-100k, 0.7% for AGIs $100k-200k)
Net capital gain/loss in AGI: +$3,824 (reported on 10.9% of returns)
Here:
+$3,824
State:
+$14,495
(% of AGI for various income ranges: 0.6% for AGIs below $25k, 1.3% for AGIs $25k-50k, 0.8% for AGIs $50k-75k, 1.4% for AGIs $75k-100k, 0.7% for AGIs $100k-200k)
Profit/loss from business: +$13,526 (reported on 14.7% of returns)
Here:
+$13,526
State:
+$16,268
(% of AGI for various income ranges: 8.3% for AGIs below $25k, 4.0% for AGIs $25k-50k, 5.7% for AGIs $50k-75k, 7.5% for AGIs $75k-100k)
Taxable individual retirement arrangement distribution: $7,506 (reported on 11.5% of returns)
17082:
$7,506
Pennsylvania:
$14,550
(% of AGI for various income ranges: 4.0% for AGIs below $25k, 2.7% for AGIs $25k-50k, 1.5% for AGIs $50k-75k, 3.0% for AGIs $75k-100k)
Total itemized deductions: $17,089 (22% of AGI, reported on 17.3% of returns)
Here:
$17,089
State:
$23,538
Here:
22.4% of AGI
State:
18.4% of AGI
(% of AGI for various income ranges: 4.4% for AGIs below $25k, 4.3% for AGIs $25k-50k, 7.2% for AGIs $50k-75k, 8.6% for AGIs $75k-100k, 10.9% for AGIs $100k-200k)
Charity contributions: $3,325 (reported on 10.3% of returns)
Here:
$3,325
State:
$4,025
(% of AGI for various income ranges: 0.5% for AGIs $25k-50k, 0.5% for AGIs $50k-75k, 1.3% for AGIs $75k-100k, 1.6% for AGIs $100k-200k)
Taxes paid: $5,267 (reported on 17.3% of returns)
17082:
$5,267
State:
$9,982
(% of AGI for various income ranges: 0.9% for AGIs below $25k, 1.0% for AGIs $25k-50k, 1.8% for AGIs $50k-75k, 2.6% for AGIs $75k-100k, 4.6% for AGIs $100k-200k)
Earned income credit: $2,104 (reported on 16.0% of returns)
Here:
$2,104
State:
$2,106
(% of AGI for various income ranges: 4.7% for AGIs below $25k, 1.1% for AGIs $25k-50k)
Percentage of individuals using paid preparers for their 2012 taxes: 66.0%
Here:
66%
State:
53%
(% for various income ranges: 64.1% for AGIs below $25k, 64.3% for AGIs $25k-50k, 68.0% for AGIs $50k-75k, 73.3% for AGIs $75k-100k, 70.0% for AGIs $100k-200k)
Averages for the 2004 tax year for zip code 17082, filed in 2005:
Average Adjusted Gross Income (AGI) in 2004: $33,599 (Individual Income Tax Returns)
Here:
$33,599
State:
$48,049
Salary/wage: $30,746 (reported on 84.5% of returns)
Here:
$30,746
State:
$42,646
(% of AGI for various income ranges: 105.3% for AGIs below $10k, 73.7% for AGIs $10k-25k, 80.1% for AGIs $25k-50k, 77.9% for AGIs $50k-75k, 83.5% for AGIs $75k-100k, 58.8% for AGIs over 100k)
Taxable interest for individuals: $1,559 (reported on 52.1% of returns)
This zip code:
$1,559
Pennsylvania:
$1,657
(% of AGI for various income ranges: 16.1% for AGIs below $10k, 3.7% for AGIs $10k-25k, 2.2% for AGIs $25k-50k, 1.5% for AGIs $50k-75k, 1.5% for AGIs $75k-100k, 2.6% for AGIs over 100k)
Taxable dividends: $1,415 (reported on 24.3% of returns)
Here:
$1,415
State:
$3,566
(% of AGI for various income ranges: 6.0% for AGIs below $10k, 1.2% for AGIs $10k-25k, 0.7% for AGIs $25k-50k, 0.8% for AGIs $50k-75k, 1.2% for AGIs $75k-100k, 1.2% for AGIs over 100k)
Net capital gain/loss: +$3,108 (reported on 13.6% of returns)
Here:
+$3,108
State:
+$9,716
(% of AGI for various income ranges: 0.1% for AGIs below $10k, 0.8% for AGIs $10k-25k, 0.8% for AGIs $25k-50k, 1.1% for AGIs $50k-75k, 1.5% for AGIs $75k-100k, 3.4% for AGIs over 100k)
Profit/loss from business: +$9,539 (reported on 16.3% of returns)
Here:
+$9,539
State:
+$14,267
(% of AGI for various income ranges: 1.7% for AGIs below $10k, 3.3% for AGIs $10k-25k, 4.9% for AGIs $25k-50k, 6.0% for AGIs $50k-75k, 6.8% for AGIs $75k-100k)
Profit/loss from farming: +$1,132 (reported on 5.8% of returns)
Here:
+$1,132
State:
+$274
(% of AGI for various income ranges: -19.0% for AGIs below $10k, 2.2% for AGIs $10k-25k, 0.8% for AGIs $25k-50k, 0.2% for AGIs $50k-75k)
IRA payment deduction: $2,576 (reported on 3.8% of returns)
17082:
$2,576
Pennsylvania:
$2,903
Total itemized deductions: $13,802 (21% of AGI, reported on 17.1% of returns)
Here:
$13,802
State:
$18,804
Here:
21.5% of AGI
State:
19.5% of AGI
(% of AGI for various income ranges: 4.4% for AGIs $10k-25k, 5.5% for AGIs $25k-50k, 8.2% for AGIs $50k-75k, 10.1% for AGIs $75k-100k, 9.3% for AGIs over 100k)
Charity contributions deductions: $2,599 (4% of AGI, reported on 12.5% of returns)
Here:
$2,599
State:
$3,337
Here:
3.7% of AGI
State:
3.3% of AGI
(% of AGI for various income ranges: 0.5% for AGIs $10k-25k, 0.4% for AGIs $25k-50k, 1.2% for AGIs $50k-75k, 1.8% for AGIs $75k-100k, 1.9% for AGIs over 100k)
Total tax: $3,912 (reported on 75.0% of returns)
17082:
$3,912
State:
$8,008
(% of AGI for various income ranges: 4.6% for AGIs below $10k, 4.5% for AGIs $10k-25k, 6.9% for AGIs $25k-50k, 8.7% for AGIs $50k-75k, 10.2% for AGIs $75k-100k, 18.4% for AGIs over 100k)
Earned income credit: $1,283 (reported on 14.2% of returns)
Here:
$1,283
State:
$1,643
Percentage of individuals using paid preparers for their 2004 taxes: 63.0%
Here:
63%
State:
56%
(% for various income ranges: 61.9% for AGIs below $10k, 58.5% for AGIs $10k-25k, 63.5% for AGIs $25k-50k, 65.7% for AGIs $50k-75k, 72.4% for AGIs $75k-100k, 73.0% for AGIs over 100k)
Likely homosexual households (counted as self-reported same-sex unmarried-partner households)
Lesbian couples: 0.2% of all households
Gay men: 0.0% of all households
Household received Food Stamps/SNAP in the past 12 months: 113 Household did not receive Food Stamps/SNAP in the past 12 months: 961
Women who had a birth in the past 12 months: 57 (48 now married, 10 unmarried) Women who did not have a birth in the past 12 months: 635 (247 now married, 388 unmarried)
Housing units in zip code 17082 with a mortgage: 406 (50 second mortgage, 49 both second mortgage and home equity loan) Houses without a mortgage: 13
Median monthly owner costs for units with a mortgage: $1,288 Median monthly owner costs for units without a mortgage: $464
Residents with income below the poverty level in 2022:
This zip code:
4.3%
Whole state:
11.8%
Residents with income below 50% of the poverty level in 2022:
This zip code:
2.4%
Whole state:
6.1%
Median number of rooms in houses and condos:
Here:
6.3
State:
6.8
Median number of rooms in apartments:
Here:
5.4
State:
4.3
Notable locations in this zip code not listed on our city pages
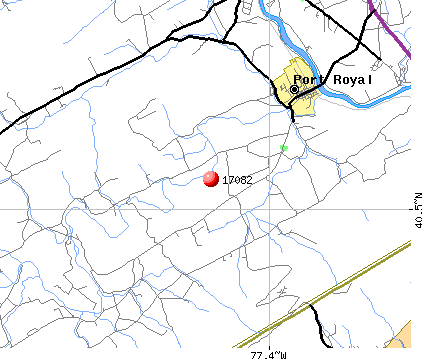
Notable locations in zip code 17082: Tuscarora Academy Historic Site (A), Path (B), Shippen Hall (C), Friendship Fire Company 1 (D), Beale Township Fire Department Company 5 (E). Display/hide their locations on the map
Streams, rivers, and creeks: Tuscarora Creek (A), Jinnie Gap Run (B), Markee Creek (C), Hunters Creek (D), East Licking Creek (E). Display/hide their locations on the map
Size of family households: 390 2-persons, 148 3-persons, 134 4-persons, 61 5-persons, 18 6-persons, 30 7-or-more-persons
Size of nonfamily households: 219 1-person, 42 2-persons, 30 3-persons
547 married couples with children.
99 single-parent households (22 men, 77 women).
89.0% of residents of 17082 zip code speak English at home.
2.8% of residents speak Spanish at home (42% very well, 14% well, 41% not well, 4% not at all).
7.3% of residents speak other Indo-European language at home (91% very well, 6% well, 1% not well, 1% not at all).
0.5% of residents speak Asian or Pacific Island language at home (77% very well, 23% well).
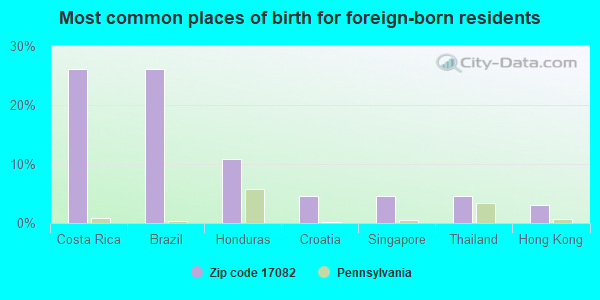
Foreign born population: 64 (2.2%) (37.5% of them are naturalized citizens)
This zip code:
2.2%
Whole state:
7.5%
26%Costa Rica
26%Brazil
11%Honduras
5%Croatia
5%Singapore
5%Thailand
3%Hong Kong
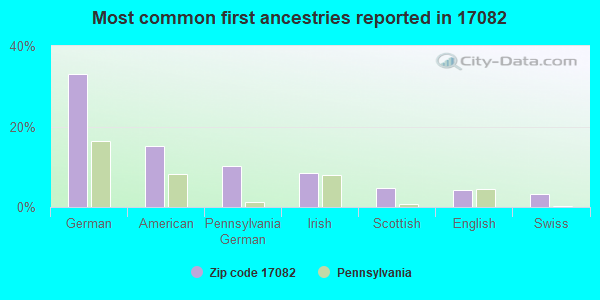
33%German
15%American
10%Pennsylvania German
8%Irish
5%Scottish
4%English
3%Swiss
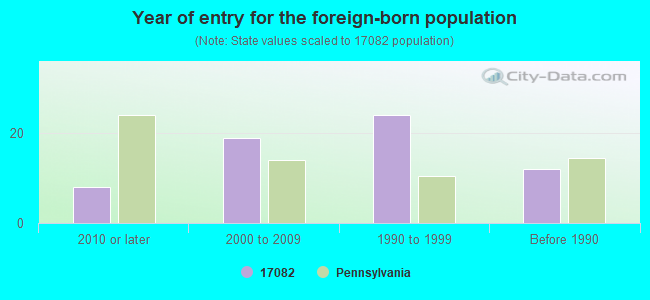
Year of entry for the foreign-born population
82010 or later
192000 to 2009
241990 to 1999
12Before 1990
Facilities with environmental interests located in this zip code:
BLUE VALLEY INDUSTRIES INC (THIRD ST in PORT ROYAL, PA)
Small Quantity Generators, between 100 kg and 1000 kg of hazardous waste/month (Resource Conservation and Recovery Act (tracking hazardous waste)) - notification Organizations: OPERNAME (CONTACT/OPERATOR)
, HAUBERT, H WAYNE STOCKHOLDER (CONTACT/OWNER)
ABRAM AUTOMOTIVE (0.5 MI S OF RT 74 & RT 75 in PORT ROYAL, PA)
Conditionally Exempt Small Quantity Generators, less than 100 kg/month of hazardous waste (Resource Conservation and Recovery Act (tracking hazardous waste)) - notification Organizations: ABRAM JEFFREY (CONTACT/OWNER)
Housing units lacking complete plumbing facilities: 2.6% Housing units lacking complete kitchen facilities: 5.5%
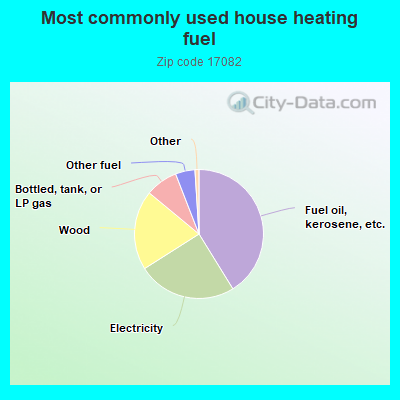
41.2%Fuel oil, kerosene, etc.
24.8%Electricity
20.0%Wood
8.1%Bottled, tank, or LP gas
4.9%Other fuel
Population in 1990: 3,319.
Place of birth for U.S.-born residents:
This state: 2,709
Northeast: 87
Midwest: 14
South: 71
West: 24
65% of the 17082 zip code residents lived in the same house 5 years ago. Out of people who lived in different houses, 68% lived in this county. Out of people who lived in different counties, 50% lived in Pennsylvania.
95% of the 17082 zip code residents lived in the same house 1 year ago. Out of people who lived in different houses, 79% moved from this county. Out of people who lived in different houses, 11% moved from different county within same state. Out of people who lived in different houses, 5% moved from different state. Out of people who lived in different houses, 6% moved from abroad.
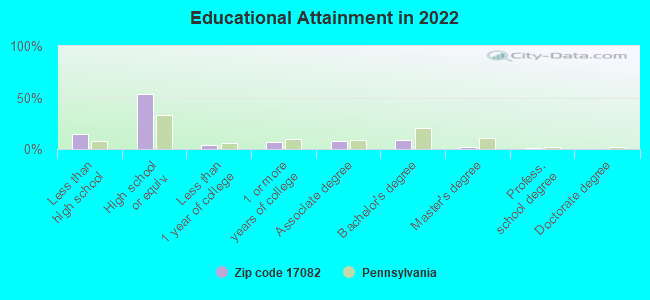
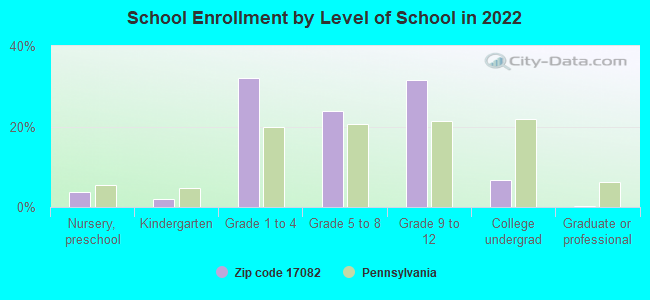
Private vs. public school enrollment:
Students in private schools in grades 1 to 8 (elementary and middle school): 116
Here:
37.1%
Pennsylvania:
15.7%
Students in private schools in grades 9 to 12 (high school): 18
Here:
10.7%
Pennsylvania:
13.4%
Students in private undergraduate colleges: 11
Here:
31.6%
Pennsylvania:
39.8%
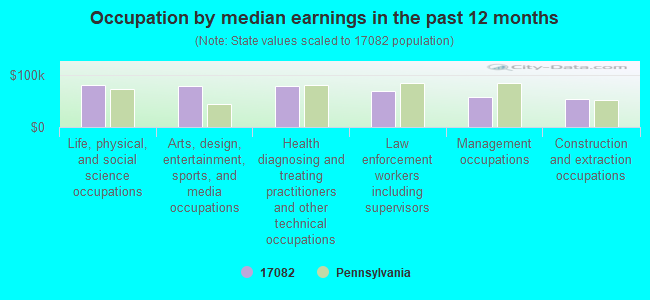
Occupation by median earnings in the past 12 months ($)
80,848Life, physical, and social science occupations
80,112Arts, design, entertainment, sports, and media occupations
79,429Health diagnosing and treating practitioners and other technical occupations
68,808Law enforcement workers including supervisors
59,056Management occupations
54,467Construction and extraction occupations
Top industries in this zip code by the number of employees in 2005:
Health Care and Social Assistance: Ambulance Services (10-19 employees: 1 establishment)
Other Services (except Public Administration): Religious Organizations (5-9: 1, 1-4: 4)
Finance and Insurance: Commercial Banking (5-9: 2)
Accommodation and Food Services: Limited-Service Restaurants (5-9: 1, 1-4: 3)
Construction: Plumbing, Heating, and Air-Conditioning Contractors (5-9: 1, 1-4: 1)
People in group quarters in 2000:
16 people in other nonhousehold living situations
Fatal accident statistics in 2014:
Fatal accident count: 1
Vehicles involved in fatal accidents: 2
Fatal accidents caused by drunken drivers: 1
Fatalities: 1
Persons involved in fatal accidents: 3
Pedestrians involved in fatal accidents: 0
2007 - 2018 National Fire Incident Reporting System (NFIRS) incidents
Based on the data from the years 2007 - 2018 the average number of fires per year is 17. The highest number of reported fire incidents - 58 took place in 2017, and the least - 0 in 2011. The data has an increasing trend.
When looking into fire subcategories, the most reports belonged to: Structure Fires (62.5%), and Outside Fires (23.6%).
Fire incident types reported to NFIRS in Zip Code 17082

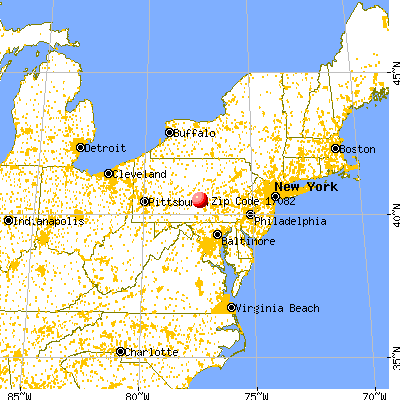


 Nearest zip codes: 17037, 17056, 17059, 17058, 17047, 17024.


 Based on the data from the years 2007 - 2018 the average number of fires per year is 17. The highest number of reported fire incidents - 58 took place in 2017, and the least - 0 in 2011. The data has an increasing trend.
 When looking into fire subcategories, the most reports belonged to: Structure Fires (62.5%), and Outside Fires (23.6%).