Estimated zip code population in 2022: 1,078 Zip code population in 2010: 1,164 Zip code population in 2000: 767
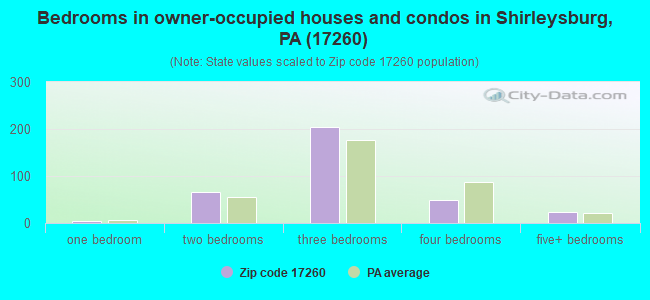
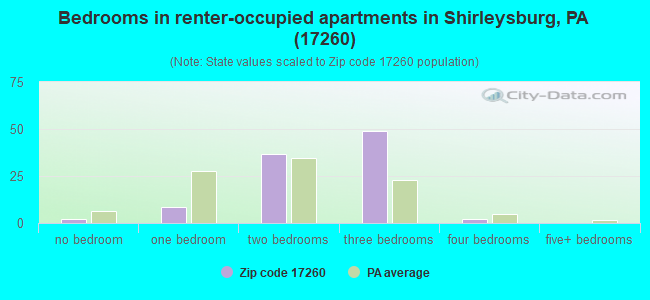
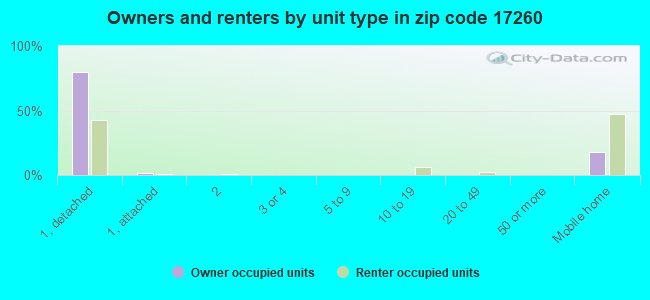
Houses and condos: 570 Renter-occupied apartments: 100
% of renters here:
22%
State:
31%
March 2022 cost of living index in zip code 17260: 92.9 (less than average, U.S. average is 100)
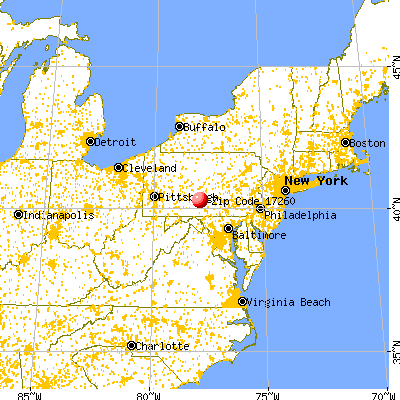
Land area: 35.8 sq. mi. Water area: 0.0 sq. mi.
Population density: 30 people per square mile
(very low).
OSM Map
General Map
Google Map
MSN Map
OSM Map
General Map
Google Map
MSN Map
OSM Map
General Map
Google Map
MSN Map
OSM Map
General Map
Google Map
MSN Map
Please wait while loading the map...
Real estate property taxes paid for housing units in 2022:
This zip code:
0.9% ($1,923)
Pennsylvania:
1.3% ($3,094)
Median real estate property taxes paid for housing units with mortgages in 2022: $1,802 (0.9%) Median real estate property taxes paid for housing units with no mortgage in 2022: $2,087 (0.8%)
Business Search- 14 Million verified businesses
Males: 612
(56.8%)
Females: 465
(43.2%)
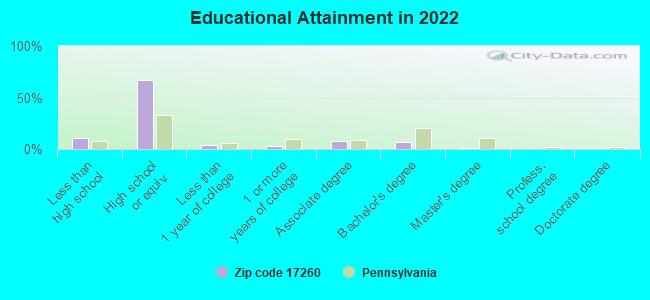
For population 25 years and over in 17260:
High school or higher: 87.5%
Bachelor's degree or higher: 8.0%
Graduate or professional degree: 1.8%
Unemployed: 3.8%
Mean travel time to work (commute): 24.6 minutes
For population 15 years and over in 17260:
Never married: 21.1%
Now married: 54.0%
Separated: 0.7%
Widowed: 12.4%
Divorced: 11.9%
Zip code 17260 compared to state average:
Median household income below state average.
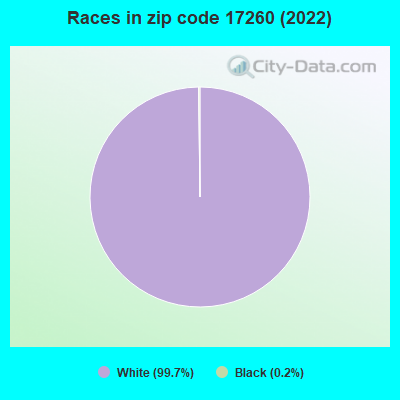
Black race population percentage significantly below state average.
Hispanic race population percentage significantly below state average.
Median age significantly above state average.
Foreign-born population percentage significantly below state average.
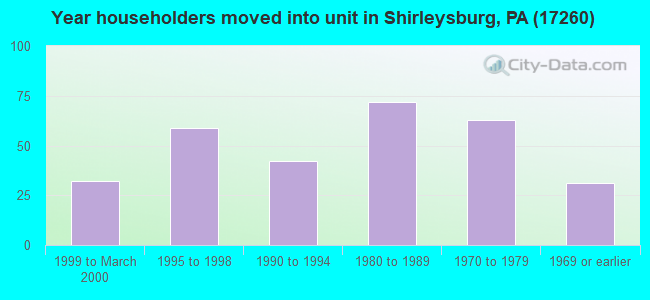
Length of stay since moving in significantly above state average.
House age below state average.
Number of college students significantly below state average.
Percentage of population with a bachelor's degree or higher significantly below state average.
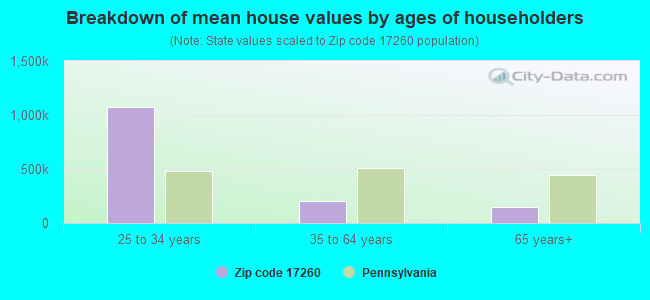
Estimated median house/condo value in 2022: $209,793
17260:
$209,793
Pennsylvania:
$245,500
According to our research of Pennsylvania and other state lists, there was 1 registered sex offender living in 17260 zip code as of June 16, 2024. The ratio of all residents to sex offenders in zip code 17260 is 1,229 to 1. The ratio of registered sex offenders to all residents in this zip code is lower than the state average.
Median resident age:
This zip code:
55.0 years
Pennsylvania median age:
40.9 years
Average household size:
This zip code:
2.4 people
Pennsylvania:
2.4 people
Averages for the 2020 tax year for zip code 17260, filed in 2021:
Average Adjusted Gross Income (AGI) in 2020: $50,000 (Individual Income Tax Returns)
Here:
$50,000
State:
$75,707
Salary/wage: $44,049 (reported on 81.8% of returns)
Here:
$44,049
State:
$62,806
(% of AGI for various income ranges: 1160.0% for AGIs below $25k, 2945.0% for AGIs $25k-50k, 5706.2% for AGIs $50k-75k, 7778.3% for AGIs $75k-100k, 14450.0% for AGIs $100k-200k)
Taxable interest for individuals: $500 (reported on 30.9% of returns)
This zip code:
$500
Pennsylvania:
$1,633
(% of AGI for various income ranges: 40.0% for AGIs below $25k, 10.0% for AGIs $25k-50k, 10.0% for AGIs $50k-75k, 8.3% for AGIs $75k-100k, 40.0% for AGIs $100k-200k)
Ordinary dividends: $550 (reported on 10.9% of returns)
Here:
$550
State:
$7,382
(% of AGI for various income ranges: 21.8% for AGIs below $25k, 11.2% for AGIs $50k-75k)
Net capital gain/loss in AGI: +$3,600 (reported on 7.3% of returns)
Here:
+$3,600
State:
+$23,522
(% of AGI for various income ranges: 120.0% for AGIs $25k-50k)
Profit/loss from business: +$5,940 (reported on 9.1% of returns)
Here:
+$5,940
State:
+$16,274
(% of AGI for various income ranges: 178.2% for AGIs below $25k, 126.2% for AGIs $50k-75k)
Taxable individual retirement arrangement distribution: $8,900 (reported on 7.3% of returns)
17260:
$8,900
Pennsylvania:
$18,583
(% of AGI for various income ranges: 296.7% for AGIs $25k-50k)
Earned income credit: $2,314 (reported on 12.7% of returns)
Here:
$2,314
State:
$2,100
(% of AGI for various income ranges: 64.5% for AGIs below $25k, 75.8% for AGIs $25k-50k)
Percentage of individuals using paid preparers for their 2020 taxes: 96.4%
Here:
96%
State:
92%
(% for various income ranges: 94.1% for AGIs below $25k, 93.3% for AGIs $25k-50k, 100.0% for AGIs $50k-75k, 100.0% for AGIs $75k-100k, 100.0% for AGIs $100k-200k)
Averages for the 2012 tax year for zip code 17260, filed in 2013:
Average Adjusted Gross Income (AGI) in 2012: $37,800 (Individual Income Tax Returns)
Here:
$37,800
State:
$61,346
Salary/wage: $36,371 (reported on 77.8% of returns)
Here:
$36,371
State:
$51,902
(% of AGI for various income ranges: 58.0% for AGIs below $25k, 75.5% for AGIs $25k-50k, 77.3% for AGIs $50k-75k, 77.0% for AGIs $75k-100k, 81.1% for AGIs $100k-200k)
Taxable interest for individuals: $1,028 (reported on 33.3% of returns)
This zip code:
$1,028
Pennsylvania:
$1,588
(% of AGI for various income ranges: 3.8% for AGIs below $25k, 1.1% for AGIs $25k-50k, 0.3% for AGIs $50k-75k, 0.3% for AGIs $75k-100k)
Ordinary dividends: $883 (reported on 11.1% of returns)
Here:
$883
State:
$5,827
(% of AGI for various income ranges: 0.9% for AGIs below $25k, 0.6% for AGIs $25k-50k)
Net capital gain/loss in AGI: +$1,250 (reported on 7.4% of returns)
Here:
+$1,250
State:
+$14,495
Profit/loss from business: +$5,386 (reported on 13.0% of returns)
Here:
+$5,386
State:
+$16,268
(% of AGI for various income ranges: 6.1% for AGIs below $25k, 4.2% for AGIs $25k-50k)
Taxable individual retirement arrangement distribution: $9,300 (reported on 9.3% of returns)
17260:
$9,300
Pennsylvania:
$14,550
(% of AGI for various income ranges: 4.5% for AGIs below $25k, 6.8% for AGIs $25k-50k)
Total itemized deductions: $17,243 (22% of AGI, reported on 13.0% of returns)
Here:
$17,243
State:
$23,538
Here:
22.5% of AGI
State:
18.4% of AGI
(% of AGI for various income ranges: 12.0% for AGIs below $25k, 5.4% for AGIs $50k-75k, 13.6% for AGIs $75k-100k)
Charity contributions: $1,425 (reported on 7.4% of returns)
Here:
$1,425
State:
$4,025
Taxes paid: $4,871 (reported on 13.0% of returns)
17260:
$4,871
State:
$9,982
(% of AGI for various income ranges: 2.4% for AGIs below $25k, 1.5% for AGIs $50k-75k, 4.4% for AGIs $75k-100k)
Earned income credit: $2,178 (reported on 16.7% of returns)
Here:
$2,178
State:
$2,106
(% of AGI for various income ranges: 5.5% for AGIs below $25k, 1.0% for AGIs $25k-50k)
Percentage of individuals using paid preparers for their 2012 taxes: 75.9%
Here:
76%
State:
53%
(% for various income ranges: 73.9% for AGIs below $25k, 78.6% for AGIs $25k-50k, 77.8% for AGIs $50k-75k, 120.0% for AGIs $75k-100k)
Averages for the 2004 tax year for zip code 17260, filed in 2005:
Average Adjusted Gross Income (AGI) in 2004: $31,630 (Individual Income Tax Returns)
Here:
$31,630
State:
$48,049
Salary/wage: $29,668 (reported on 81.1% of returns)
Here:
$29,668
State:
$42,646
(% of AGI for various income ranges: 132.6% for AGIs below $10k, 64.7% for AGIs $10k-25k, 77.9% for AGIs $25k-50k, 79.6% for AGIs $50k-75k, 70.8% for AGIs $75k-100k)
Taxable interest for individuals: $729 (reported on 46.2% of returns)
This zip code:
$729
Pennsylvania:
$1,657
(% of AGI for various income ranges: 12.1% for AGIs below $10k, 3.1% for AGIs $10k-25k, 0.9% for AGIs $25k-50k, 0.4% for AGIs $50k-75k, 0.2% for AGIs $75k-100k)
Taxable dividends: $695 (reported on 12.1% of returns)
Here:
$695
State:
$3,566
Net capital gain/loss: +$2,564 (reported on 8.0% of returns)
Here:
+$2,564
State:
+$9,716
Profit/loss from business: +$6,131 (reported on 12.5% of returns)
Here:
+$6,131
State:
+$14,267
(% of AGI for various income ranges: -7.6% for AGIs below $10k, 6.9% for AGIs $10k-25k, 3.5% for AGIs $25k-50k, 1.2% for AGIs $50k-75k)
Total itemized deductions: $13,750 (24% of AGI, reported on 12.3% of returns)
Here:
$13,750
State:
$18,804
Here:
23.6% of AGI
State:
19.5% of AGI
Charity contributions deductions: $1,310 (2% of AGI, reported on 8.6% of returns)
Here:
$1,310
State:
$3,337
Here:
2.2% of AGI
State:
3.3% of AGI
Total tax: $3,306 (reported on 73.7% of returns)
17260:
$3,306
State:
$8,008
(% of AGI for various income ranges: 4.9% for AGIs below $10k, 4.2% for AGIs $10k-25k, 7.2% for AGIs $25k-50k, 7.9% for AGIs $50k-75k, 11.2% for AGIs $75k-100k)
Earned income credit: $1,686 (reported on 17.7% of returns)
Here:
$1,686
State:
$1,643
Percentage of individuals using paid preparers for their 2004 taxes: 73.5%
Here:
74%
State:
56%
(% for various income ranges: 68.8% for AGIs below $10k, 73.1% for AGIs $10k-25k, 73.2% for AGIs $25k-50k, 80.5% for AGIs $50k-75k, 73.3% for AGIs $75k-100k)
Household received Food Stamps/SNAP in the past 12 months: 67 Household did not receive Food Stamps/SNAP in the past 12 months: 381
Women who had a birth in the past 12 months: 11 (12 now married, 0 unmarried) Women who did not have a birth in the past 12 months: 122 (55 now married, 66 unmarried)
Housing units in zip code 17260 with a mortgage: 157 (6 second mortgage, 6 both second mortgage and home equity loan) Houses without a mortgage: 21
Median monthly owner costs for units with a mortgage: $1,143 Median monthly owner costs for units without a mortgage: $409
Residents with income below the poverty level in 2022:
This zip code:
12.3%
Whole state:
11.8%
Residents with income below 50% of the poverty level in 2022:
This zip code:
10.7%
Whole state:
6.1%
Median number of rooms in houses and condos:
Here:
6.1
State:
6.8
Median number of rooms in apartments:
Here:
5.7
State:
4.3
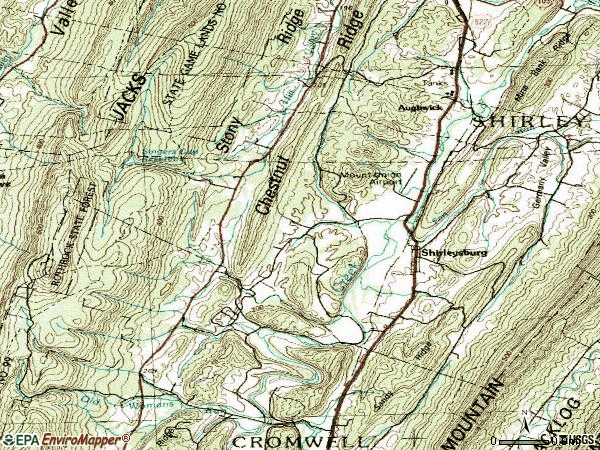
Notable locations in this zip code not listed on our city pages
Cemeteries: Walker Cemetery (1), Bare-Garver Cemetery (2), Orbisonia Cemetery (3), Haven Rest Memorial Park Cemetery (4), Sugar Run Brethren Cemetery (5), Shirley Home Cemetery (6), Bethel Cemetery (7). Display/hide their locations on the map
Streams, rivers, and creeks: Sugar Run (A), Logan Run (B), Browns Gap Run (C), Blacklog Creek (D), Old Womans Run (E). Display/hide their locations on the map
130 married couples with children.
24 single-parent households (24 women).
100.1% of residents of 17260 zip code speak English at home.
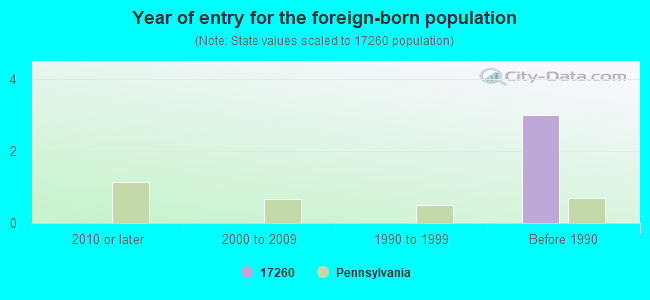
Foreign born population: 0 (0.0%)
:
0.0%
Whole state:
7.5%
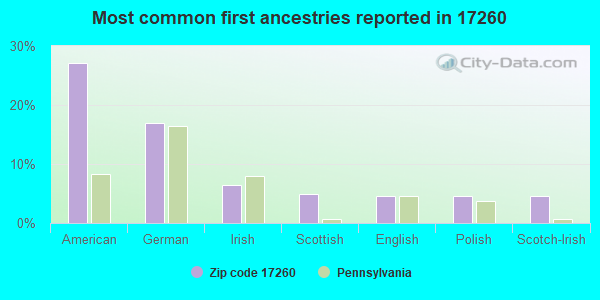
27%American
17%German
6%Irish
5%Scottish
5%English
5%Polish
5%Scotch-Irish
Year of entry for the foreign-born population
02010 or later
02000 to 2009
01990 to 1999
3Before 1990
Facilities with environmental interests located in this zip code:
AGAPE FARM CAMPGROUND (RR 1 in SHIRLEYSBURG, PA)
National Pollutant Discharge Elimination System NON-MAJOR (Tracking pollutant discharge elimination systems) - permit Business SIC classification: RELIGIOUS ORGANIZATIONS Alternative names: JESUS MINISTRIES, INC.
Housing units lacking complete plumbing facilities: 4.8% Housing units lacking complete kitchen facilities: 7.4%
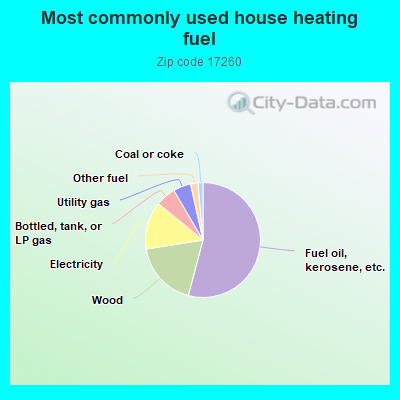
54.5%Fuel oil, kerosene, etc.
18.5%Wood
13.5%Electricity
5.7%Bottled, tank, or LP gas
5.0%Utility gas
2.1%Other fuel
1.4%Coal or coke
Population in 1990: 1,416.
Place of birth for U.S.-born residents:
This state: 981
Northeast: 15
Midwest: 19
South: 46
West: 3
76% of the 17260 zip code residents lived in the same house 5 years ago. Out of people who lived in different houses, 70% lived in this county. Out of people who lived in different counties, 50% lived in Pennsylvania.
94% of the 17260 zip code residents lived in the same house 1 year ago. Out of people who lived in different houses, 57% moved from this county. Out of people who lived in different houses, 41% moved from different county within same state.
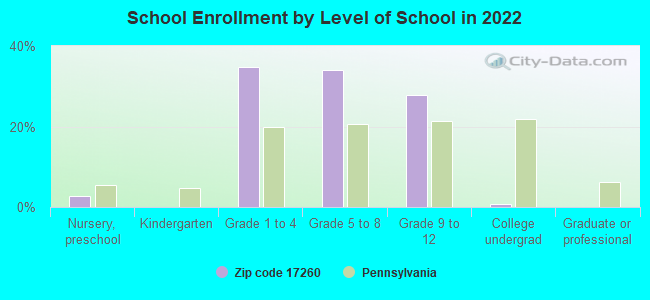
Private vs. public school enrollment:
Students in private schools in grades 1 to 8 (elementary and middle school): 4
Here:
4.2%
Pennsylvania:
15.7%
Students in private schools in grades 9 to 12 (high school): 4
Here:
11.9%
Pennsylvania:
13.4%
Students in private undergraduate colleges:
Here:
0.0%
Pennsylvania:
39.8%
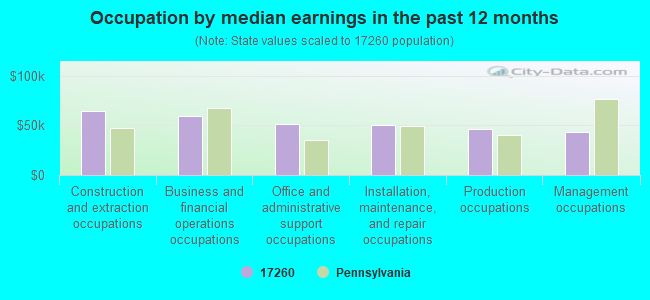
Occupation by median earnings in the past 12 months ($)
64,744Construction and extraction occupations
59,469Business and financial operations occupations
51,455Office and administrative support occupations
50,362Installation, maintenance, and repair occupations
45,786Production occupations
43,691Management occupations
Companies with federal contracts located in this zip code:
MOUNTAIN AIR GARAGE DOOR, LP (RR1 BOX 23E in SHIRLEYSBURG, PA; small business)
$4,693 with Army for Building Components, Prefabricated. Signed on 2003-07-02. Completion date: 2003-07-01.
Top industries in this zip code by the number of employees in 2005:
Health Care and Social Assistance: Homes for the Elderly (20-49 employees: 1 establishment)
Other Services (except Public Administration): Cemeteries and Crematories (1-4: 1)
Other Services (except Public Administration): General Automotive Repair (1-4: 1)
Construction: Residential Remodelers (1-4: 1)
Construction: Plumbing, Heating, and Air-Conditioning Contractors (1-4: 1)
Finance and Insurance: Insurance Agencies and Brokerages (1-4: 1)
Construction: Site Preparation Contractors (1-4: 1)
People in group quarters in 2000:
40 people in nursing homes
3 people in homes for the mentally retarded
2007 - 2018 National Fire Incident Reporting System (NFIRS) incidents
Based on the data from the years 2007 - 2018 the average number of fires per year is 8. The highest number of reported fire incidents - 16 took place in 2016, and the least - 1 in 2008. The data has a rising trend.
When looking into fire subcategories, the most reports belonged to: Structure Fires (64.0%), and Outside Fires (19.0%).
Fire incident types reported to NFIRS in Zip Code 17260


 Nearest zip codes: 17249, 17066, 17243, 17052, 17075, 17213.
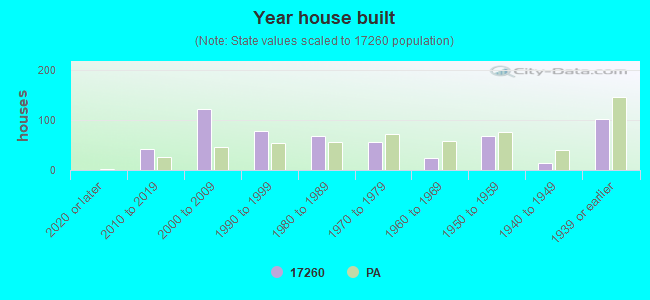


 Based on the data from the years 2007 - 2018 the average number of fires per year is 8. The highest number of reported fire incidents - 16 took place in 2016, and the least - 1 in 2008. The data has a rising trend.
 When looking into fire subcategories, the most reports belonged to: Structure Fires (64.0%), and Outside Fires (19.0%).