Estimated zip code population in 2022: 7,860 Zip code population in 2010: 7,525 Zip code population in 2000: 5,527
Houses and condos: 3,214 Renter-occupied apartments: 865
% of renters here:
27%
State:
31%
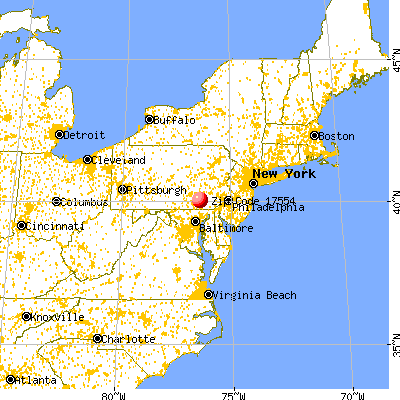
March 2022 cost of living index in zip code 17554: 95.2 (less than average, U.S. average is 100)
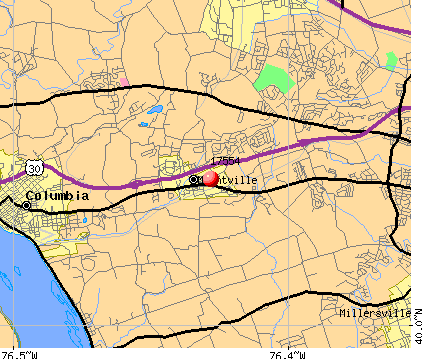
Land area: 3.1 sq. mi. Water area: 0.0 sq. mi.
Population density: 2,509 people per square mile
(average).
OSM Map
General Map
Google Map
MSN Map
OSM Map
General Map
Google Map
MSN Map
OSM Map
General Map
Google Map
MSN Map
OSM Map
General Map
Google Map
MSN Map
Please wait while loading the map...
Real estate property taxes paid for housing units in 2022:
This zip code:
1.5% ($3,743)
Pennsylvania:
1.3% ($3,094)
Median real estate property taxes paid for housing units with mortgages in 2022: $4,031 (1.6%) Median real estate property taxes paid for housing units with no mortgage in 2022: $3,066 (1.2%)
Estimated median house/condo value in 2022: $257,113
17554:
$257,113
Pennsylvania:
$245,500
According to our research of Pennsylvania and other state lists, there were 7 registered sex offenders living in 17554 zip code as of June 16, 2024. The ratio of all residents to sex offenders in zip code 17554 is 1,190 to 1. The ratio of registered sex offenders to all residents in this zip code is lower than the state average.
Median resident age:
This zip code:
39.5 years
Pennsylvania median age:
40.9 years
Average household size:
This zip code:
2.4 people
Pennsylvania:
2.4 people
Averages for the 2020 tax year for zip code 17554, filed in 2021:
Average Adjusted Gross Income (AGI) in 2020: $60,780 (Individual Income Tax Returns)
Here:
$60,780
State:
$75,707
Salary/wage: $53,215 (reported on 86.7% of returns)
Here:
$53,215
State:
$62,806
(% of AGI for various income ranges: 1034.9% for AGIs below $25k, 3497.4% for AGIs $25k-50k, 6254.3% for AGIs $50k-75k, 9343.0% for AGIs $75k-100k, 17874.6% for AGIs $100k-200k, 59590.0% for AGIs over 200k)
Taxable interest for individuals: $728 (reported on 26.6% of returns)
This zip code:
$728
Pennsylvania:
$1,633
(% of AGI for various income ranges: 16.7% for AGIs below $25k, 12.7% for AGIs $25k-50k, 16.3% for AGIs $50k-75k, 22.2% for AGIs $75k-100k, 66.2% for AGIs $100k-200k, 453.3% for AGIs over 200k)
Ordinary dividends: $2,912 (reported on 18.3% of returns)
Here:
$2,912
State:
$7,382
(% of AGI for various income ranges: 20.5% for AGIs below $25k, 31.2% for AGIs $25k-50k, 44.1% for AGIs $50k-75k, 58.6% for AGIs $75k-100k, 217.6% for AGIs $100k-200k, 1703.3% for AGIs over 200k)
Net capital gain/loss in AGI: +$9,437 (reported on 15.9% of returns)
Here:
+$9,437
State:
+$23,522
(% of AGI for various income ranges: 8.2% for AGIs below $25k, 17.0% for AGIs $25k-50k, 89.8% for AGIs $50k-75k, 118.9% for AGIs $75k-100k, 541.1% for AGIs $100k-200k, 10550.0% for AGIs over 200k)
Profit/loss from business: +$12,463 (reported on 12.1% of returns)
Here:
+$12,463
State:
+$16,274
(% of AGI for various income ranges: 46.8% for AGIs below $25k, 94.4% for AGIs $25k-50k, 210.9% for AGIs $50k-75k, 233.8% for AGIs $75k-100k, 508.6% for AGIs $100k-200k, 3920.0% for AGIs over 200k)
Taxable individual retirement arrangement distribution: $14,129 (reported on 9.7% of returns)
17554:
$14,129
Pennsylvania:
$18,583
(% of AGI for various income ranges: 87.6% for AGIs below $25k, 99.3% for AGIs $25k-50k, 163.0% for AGIs $50k-75k, 295.1% for AGIs $75k-100k, 574.6% for AGIs $100k-200k)
Total itemized deductions: $27,364 (reported on 5.2% of returns)
Here:
$27,364
State:
$34,850
(% of AGI for various income ranges: 125.7% for AGIs $25k-50k, 168.0% for AGIs $50k-75k, 267.3% for AGIs $75k-100k, 795.1% for AGIs $100k-200k)
Charity contributions: $9,414 (reported on 3.3% of returns)
Here:
$9,414
State:
$12,392
(% of AGI for various income ranges: 6.9% for AGIs below $25k, 24.4% for AGIs $50k-75k, 43.2% for AGIs $75k-100k, 261.1% for AGIs $100k-200k)
Taxes paid: $6,933 (reported on 5.0% of returns)
17554:
$6,933
State:
$8,200
(% of AGI for various income ranges: 16.5% for AGIs $25k-50k, 46.7% for AGIs $50k-75k, 68.1% for AGIs $75k-100k, 215.4% for AGIs $100k-200k)
Earned income credit: $2,137 (reported on 12.1% of returns)
Here:
$2,137
State:
$2,100
(% of AGI for various income ranges: 64.8% for AGIs below $25k, 56.0% for AGIs $25k-50k)
Percentage of individuals using paid preparers for their 2020 taxes: 94.3%
Here:
94%
State:
92%
(% for various income ranges: 94.9% for AGIs below $25k, 93.9% for AGIs $25k-50k, 94.3% for AGIs $50k-75k, 94.0% for AGIs $75k-100k, 95.1% for AGIs $100k-200k, 88.9% for AGIs over 200k)
Averages for the 2012 tax year for zip code 17554, filed in 2013:
Average Adjusted Gross Income (AGI) in 2012: $51,502 (Individual Income Tax Returns)
Here:
$51,502
State:
$61,346
Salary/wage: $46,739 (reported on 89.0% of returns)
Here:
$46,739
State:
$51,902
(% of AGI for various income ranges: 75.2% for AGIs below $25k, 80.3% for AGIs $25k-50k, 83.9% for AGIs $50k-75k, 84.6% for AGIs $75k-100k, 85.4% for AGIs $100k-200k, 57.9% for AGIs over 200k)
Taxable interest for individuals: $773 (reported on 34.0% of returns)
This zip code:
$773
Pennsylvania:
$1,588
(% of AGI for various income ranges: 1.0% for AGIs below $25k, 0.6% for AGIs $25k-50k, 0.4% for AGIs $50k-75k, 0.3% for AGIs $75k-100k, 0.4% for AGIs $100k-200k, 0.8% for AGIs over 200k)
Ordinary dividends: $2,396 (reported on 20.7% of returns)
Here:
$2,396
State:
$5,827
(% of AGI for various income ranges: 1.5% for AGIs below $25k, 0.7% for AGIs $25k-50k, 0.9% for AGIs $50k-75k, 0.6% for AGIs $75k-100k, 1.1% for AGIs $100k-200k, 1.7% for AGIs over 200k)
Net capital gain/loss in AGI: +$3,584 (reported on 14.4% of returns)
Here:
+$3,584
State:
+$14,495
(% of AGI for various income ranges: 0.1% for AGIs $25k-50k, 0.2% for AGIs $50k-75k, 0.8% for AGIs $75k-100k, 1.2% for AGIs $100k-200k, 5.4% for AGIs over 200k)
Profit/loss from business: +$9,588 (reported on 13.1% of returns)
Here:
+$9,588
State:
+$16,268
(% of AGI for various income ranges: 3.9% for AGIs below $25k, 3.1% for AGIs $25k-50k, 1.7% for AGIs $50k-75k, 1.9% for AGIs $75k-100k, 3.3% for AGIs $100k-200k)
Taxable individual retirement arrangement distribution: $10,269 (reported on 11.0% of returns)
17554:
$10,269
Pennsylvania:
$14,550
(% of AGI for various income ranges: 4.3% for AGIs below $25k, 2.9% for AGIs $25k-50k, 2.4% for AGIs $50k-75k, 2.0% for AGIs $75k-100k, 1.8% for AGIs $100k-200k)
Total itemized deductions: $18,851 (21% of AGI, reported on 35.1% of returns)
Here:
$18,851
State:
$23,538
Here:
21.4% of AGI
State:
18.4% of AGI
(% of AGI for various income ranges: 8.3% for AGIs below $25k, 9.2% for AGIs $25k-50k, 12.8% for AGIs $50k-75k, 14.7% for AGIs $75k-100k, 14.2% for AGIs $100k-200k, 15.7% for AGIs over 200k)
Charity contributions: $2,853 (reported on 27.7% of returns)
Here:
$2,853
State:
$4,025
(% of AGI for various income ranges: 0.7% for AGIs below $25k, 0.8% for AGIs $25k-50k, 1.5% for AGIs $50k-75k, 1.6% for AGIs $75k-100k, 2.0% for AGIs $100k-200k, 2.3% for AGIs over 200k)
Taxes paid: $7,096 (reported on 35.1% of returns)
17554:
$7,096
State:
$9,982
(% of AGI for various income ranges: 1.7% for AGIs below $25k, 2.9% for AGIs $25k-50k, 4.8% for AGIs $50k-75k, 5.6% for AGIs $75k-100k, 6.1% for AGIs $100k-200k, 5.9% for AGIs over 200k)
Earned income credit: $2,074 (reported on 14.1% of returns)
Here:
$2,074
State:
$2,106
(% of AGI for various income ranges: 5.1% for AGIs below $25k, 0.9% for AGIs $25k-50k)
Percentage of individuals using paid preparers for their 2012 taxes: 52.6%
Here:
53%
State:
53%
(% for various income ranges: 47.4% for AGIs below $25k, 51.6% for AGIs $25k-50k, 57.1% for AGIs $50k-75k, 56.5% for AGIs $75k-100k, 57.5% for AGIs $100k-200k, 80.0% for AGIs over 200k)
Averages for the 2004 tax year for zip code 17554, filed in 2005:
Average Adjusted Gross Income (AGI) in 2004: $44,553 (Individual Income Tax Returns)
Here:
$44,553
State:
$48,049
Salary/wage: $40,608 (reported on 90.0% of returns)
Here:
$40,608
State:
$42,646
(% of AGI for various income ranges: 95.2% for AGIs below $10k, 77.3% for AGIs $10k-25k, 85.3% for AGIs $25k-50k, 87.0% for AGIs $50k-75k, 86.6% for AGIs $75k-100k, 70.9% for AGIs over 100k)
Taxable interest for individuals: $1,032 (reported on 45.8% of returns)
This zip code:
$1,032
Pennsylvania:
$1,657
(% of AGI for various income ranges: 4.8% for AGIs below $10k, 2.8% for AGIs $10k-25k, 1.1% for AGIs $25k-50k, 0.8% for AGIs $50k-75k, 0.2% for AGIs $75k-100k, 1.2% for AGIs over 100k)
Taxable dividends: $1,800 (reported on 27.8% of returns)
Here:
$1,800
State:
$3,566
(% of AGI for various income ranges: 3.8% for AGIs below $10k, 1.5% for AGIs $10k-25k, 1.1% for AGIs $25k-50k, 0.7% for AGIs $50k-75k, 0.7% for AGIs $75k-100k, 1.7% for AGIs over 100k)
Net capital gain/loss: +$2,942 (reported on 19.6% of returns)
Here:
+$2,942
State:
+$9,716
(% of AGI for various income ranges: -2.4% for AGIs below $10k, 0.7% for AGIs $10k-25k, 0.4% for AGIs $25k-50k, 0.3% for AGIs $50k-75k, 1.0% for AGIs $75k-100k, 3.7% for AGIs over 100k)
Profit/loss from business: +$10,758 (reported on 11.4% of returns)
Here:
+$10,758
State:
+$14,267
(% of AGI for various income ranges: 2.2% for AGIs below $10k, 3.2% for AGIs $10k-25k, 2.2% for AGIs $25k-50k, 2.0% for AGIs $50k-75k, 4.1% for AGIs $75k-100k, 2.9% for AGIs over 100k)
IRA payment deduction: $2,791 (reported on 2.9% of returns)
17554:
$2,791
Pennsylvania:
$2,903
(% of AGI for various income ranges: 0.1% for AGIs $10k-25k, 0.3% for AGIs $25k-50k, 0.2% for AGIs $50k-75k, 0.2% for AGIs $75k-100k)
Self-employed pension: $12,111 (reported on 0.6% of returns)
Here:
$12,111
Pennsylvania:
$14,674
Total itemized deductions: $15,238 (21% of AGI, reported on 39.7% of returns)
Here:
$15,238
State:
$18,804
Here:
21.2% of AGI
State:
19.5% of AGI
(% of AGI for various income ranges: 6.5% for AGIs below $10k, 8.1% for AGIs $10k-25k, 12.5% for AGIs $25k-50k, 15.3% for AGIs $50k-75k, 15.8% for AGIs $75k-100k, 13.2% for AGIs over 100k)
Charity contributions deductions: $2,546 (3% of AGI, reported on 34.6% of returns)
Here:
$2,546
State:
$3,337
Here:
3.4% of AGI
State:
3.3% of AGI
(% of AGI for various income ranges: 1.0% for AGIs below $10k, 0.9% for AGIs $10k-25k, 1.4% for AGIs $25k-50k, 1.9% for AGIs $50k-75k, 2.2% for AGIs $75k-100k, 2.8% for AGIs over 100k)
Total tax: $5,676 (reported on 79.7% of returns)
17554:
$5,676
State:
$8,008
(% of AGI for various income ranges: 1.7% for AGIs below $10k, 4.3% for AGIs $10k-25k, 7.6% for AGIs $25k-50k, 8.6% for AGIs $50k-75k, 10.4% for AGIs $75k-100k, 16.3% for AGIs over 100k)
Earned income credit: $1,538 (reported on 8.9% of returns)
Here:
$1,538
State:
$1,643
Percentage of individuals using paid preparers for their 2004 taxes: 54.7%
Here:
55%
State:
56%
(% for various income ranges: 41.2% for AGIs below $10k, 57.1% for AGIs $10k-25k, 55.7% for AGIs $25k-50k, 55.7% for AGIs $50k-75k, 58.9% for AGIs $75k-100k, 68.7% for AGIs over 100k)
Likely homosexual households (counted as self-reported same-sex unmarried-partner households)
Lesbian couples: 0.0% of all households
Gay men: 0.2% of all households
Household received Food Stamps/SNAP in the past 12 months: 326 Household did not receive Food Stamps/SNAP in the past 12 months: 2,839
Women who had a birth in the past 12 months: 109 (112 now married, 3 unmarried) Women who did not have a birth in the past 12 months: 1,646 (866 now married, 772 unmarried)
Housing units in zip code 17554 with a mortgage: 1,550 (249 second mortgage, 205 both second mortgage and home equity loan) Houses without a mortgage: 102
Median monthly owner costs for units with a mortgage: $1,610 Median monthly owner costs for units without a mortgage: $545
Residents with income below the poverty level in 2022:
This zip code:
6.4%
Whole state:
11.8%
Residents with income below 50% of the poverty level in 2022:
This zip code:
2.4%
Whole state:
6.1%
Median number of rooms in houses and condos:
Here:
6.3
State:
6.8
Median number of rooms in apartments:
Here:
4.2
State:
4.3
Notable locations in this zip code not listed on our city pages
In group quarters: 169 (-1 institutionalized population)
Size of family households: 863 2-persons, 425 3-persons, 534 4-persons, 137 5-persons, 76 6-persons
Size of nonfamily households: 853 1-person, 216 2-persons, 58 3-persons
1,152 married couples with children.
195 single-parent households (40 men, 155 women).
83.5% of residents of 17554 zip code speak English at home.
11.7% of residents speak Spanish at home (52% very well, 47% well, 1% not well).
2.4% of residents speak other Indo-European language at home (68% very well, 16% well, 17% not well).
1.0% of residents speak Asian or Pacific Island language at home (23% very well, 19% well, 58% not at all).
1.4% of residents speak other language at home (41% very well, 20% well, 39% not well).
Foreign born population: 854 (10.9%) (62.5% of them are naturalized citizens)
This zip code:
10.9%
Whole state:
7.5%
22%Taiwan
19%Barbados
16%Honduras
14%Eritrea
11%Thailand
6%Bangladesh
5%Kazakhstan
33%German
10%American
9%English
4%Irish
2%Italian
2%Scottish
2%European
Year of entry for the foreign-born population
4782010 or later
2342000 to 2009
3211990 to 1999
100Before 1990
47.1%Electricity
30.6%Utility gas
17.3%Fuel oil, kerosene, etc.
2.4%Coal or coke
1.6%Wood
0.6%Bottled, tank, or LP gas
Population in 1990: 4,192. Population change in the 1990s: +1,335 (+31.8%).
Place of birth for U.S.-born residents:
This state: 5,131
Northeast: 806
Midwest: 159
South: 555
West: 102
59% of the 17554 zip code residents lived in the same house 5 years ago. Out of people who lived in different houses, 75% lived in this county. Out of people who lived in different counties, 50% lived in Pennsylvania.
93% of the 17554 zip code residents lived in the same house 1 year ago. Out of people who lived in different houses, 72% moved from this county. Out of people who lived in different houses, 20% moved from different county within same state. Out of people who lived in different houses, 3% moved from different state. Out of people who lived in different houses, 5% moved from abroad.
Private vs. public school enrollment:
Students in private schools in grades 1 to 8 (elementary and middle school): 12
Here:
1.6%
Pennsylvania:
15.7%
Students in private schools in grades 9 to 12 (high school): 3
Here:
0.8%
Pennsylvania:
13.4%
Students in private undergraduate colleges: 248
Here:
60.8%
Pennsylvania:
39.8%
Occupation by median earnings in the past 12 months ($)
83,483Health diagnosing and treating practitioners and other technical occupations
80,194Installation, maintenance, and repair occupations
76,450Management occupations
74,064Arts, design, entertainment, sports, and media occupations
69,782Business and financial operations occupations
58,578Transportation occupations
Companies with federal contracts located in this zip code:
MAPQUEST COM, INC (3710 HEMPLAND ROAD in MOUNTVILLE, PA) : $189,250 in 11 contractsfrom 2002 to 2006
Contracts for Other Professional Services, Computer Aided Design/Computer Aided Manufacturing (CAD/CAM) Services, ADP Software, Data Collection Services, and moreby Federal Highway Administration, Minerals Management Service, National Institutes of Health, Army, and others Signed by year:2000: $0; 2001: $0; 2002: $80,000; 2003: $45,000; 2004: -$5,000; 2005: $30,000; 2006: $39,250.
Biggest contracts:
$80,000 with Federal Highway Administration for Other Professional Services. Signed on 2002-05-15. Completion date: 2002-06-15.
$45,000 with Minerals Management Service for Other Professional Services. Taking place in DC. Signed on 2003-04-15. Completion date: 2004-02-15.
$30,000 with National Institutes of Health for Computer Aided Design/Computer Aided Manufacturing (CAD/CAM) Services. Taking place in MD. Signed on 2006-05-30. Effective on 2006-05-24. Completion date: 2007-05-31.
$30,000 with National Institutes of Health for Other Professional Services. Taking place in NC. Signed on 2005-05-31. Effective on 2005-05-24. Completion date: 2005-05-24.
MICRO FACTURE LLC (200 NORTH DONNERVILLE ROAD in MOUNTVILLE, PA; small business) : $27,628 in 2 contractsfrom 2001 to 2003
$24,932 with Army for Miscellaneous Prefabricated Structures. Signed on 2003-07-08. Completion date: 2003-08-11.
$2,696 with Army for Plate, Sheet, Strip, Foil; and Leaf. Signed on 2001-11-19. Completion date: 2001-11-14.
Top industries in this zip code by the number of employees in 2005:
Professional, Scientific, and Technical Services: Direct Mail Advertising (over 1000 employees: 1 establishment)
Health Care and Social Assistance: Residential Mental Retardation Facilities (100-249: 1, 10-19: 1)
Detailed PMIC statistics for the following Tracts:0115.03
2002 - 2018 National Fire Incident Reporting System (NFIRS) incidents
Based on the data from the years 2002 - 2018 the average number of fires per year is 27. The highest number of reported fire incidents - 47 took place in 2005, and the least - 7 in 2015. The data has an increasing trend.
When looking into fire subcategories, the most reports belonged to: Structure Fires (58.0%), and Outside Fires (22.3%).
Fire incident types reported to NFIRS in Zip Code 17554


 Nearest zip codes: 17538, 17512, 17582, 17551, 17603, 17520.


 : $189,250 in 11 contracts from 2002 to 2006


 Based on the data from the years 2002 - 2018 the average number of fires per year is 27. The highest number of reported fire incidents - 47 took place in 2005, and the least - 7 in 2015. The data has an increasing trend.
 When looking into fire subcategories, the most reports belonged to: Structure Fires (58.0%), and Outside Fires (22.3%).