Estimated zip code population in 2022: 12,219 Zip code population in 2010: 12,233 Zip code population in 2000: 12,181
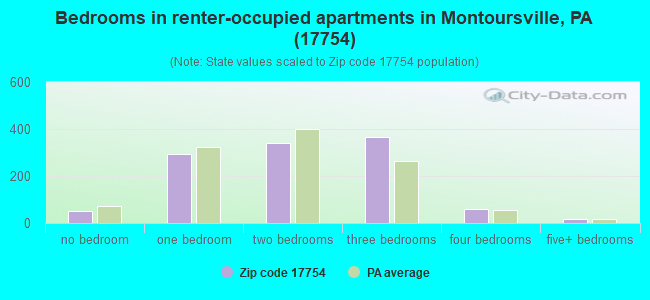
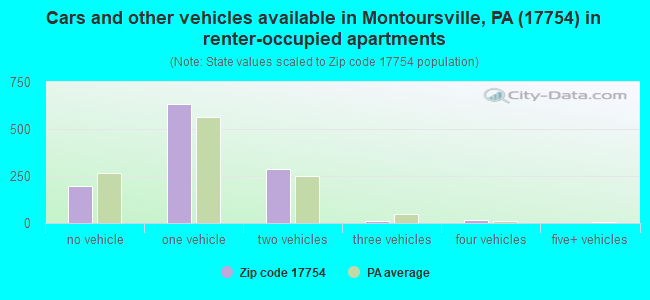
Houses and condos: 5,437 Renter-occupied apartments: 1,143
% of renters here:
22%
State:
31%
March 2022 cost of living index in zip code 17754: 92.4 (less than average, U.S. average is 100)
Land area: 60.1 sq. mi. Water area: 1.4 sq. mi.
Population density: 203 people per square mile
(very low).
OSM Map
General Map
Google Map
MSN Map
OSM Map
General Map
Google Map
MSN Map
OSM Map
General Map
Google Map
MSN Map
OSM Map
General Map
Google Map
MSN Map
Please wait while loading the map...
Real estate property taxes paid for housing units in 2022:
This zip code:
1.2% ($3,031)
Pennsylvania:
1.3% ($3,094)
Median real estate property taxes paid for housing units with mortgages in 2022: $3,135 (1.1%) Median real estate property taxes paid for housing units with no mortgage in 2022: $2,911 (1.2%)
Business Search- 14 Million verified businesses
Males: 5,951
(48.7%)
Females: 6,268
(51.3%)
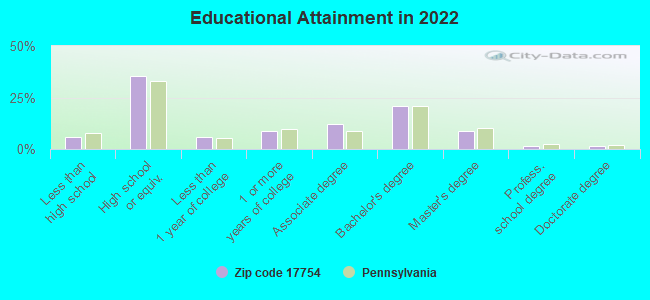
For population 25 years and over in 17754:
High school or higher: 94.2%
Bachelor's degree or higher: 32.4%
Graduate or professional degree: 11.6%
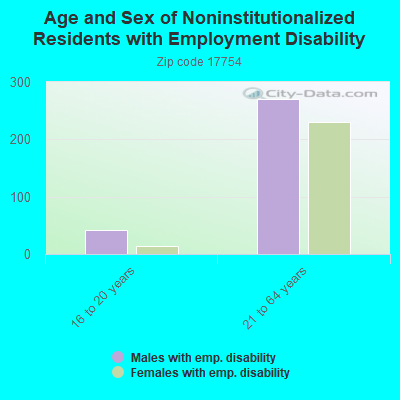
Unemployed: 3.9%
Mean travel time to work (commute): 18.2 minutes
For population 15 years and over in 17754:
Never married: 22.0%
Now married: 59.7%
Separated: 1.4%
Widowed: 7.6%
Divorced: 9.3%
Zip code 17754 compared to state average:
Black race population percentage significantly below state average.
Hispanic race population percentage significantly below state average.
Median age above state average.
Foreign-born population percentage significantly below state average.
Length of stay since moving in significantly above state average.
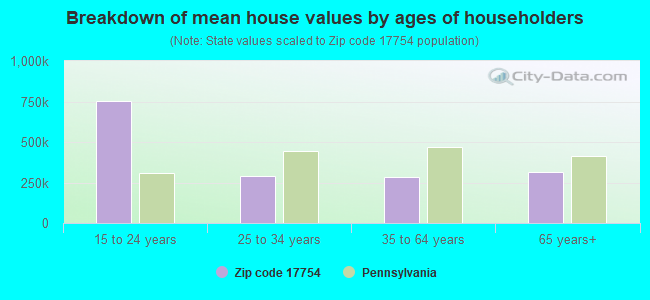
Estimated median house/condo value in 2022: $262,323
17754:
$262,323
Pennsylvania:
$245,500
According to our research of Pennsylvania and other state lists, there were 21 registered sex offenders living in 17754 zip code as of June 15, 2024. The ratio of all residents to sex offenders in zip code 17754 is 594 to 1. The ratio of registered sex offenders to all residents in this zip code is near the state average.
Median resident age:
This zip code:
46.3 years
Pennsylvania median age:
40.9 years
Average household size:
This zip code:
2.3 people
Pennsylvania:
2.4 people
Averages for the 2020 tax year for zip code 17754, filed in 2021:
Average Adjusted Gross Income (AGI) in 2020: $77,617 (Individual Income Tax Returns)
Here:
$77,617
State:
$75,707
Salary/wage: $63,361 (reported on 75.8% of returns)
Here:
$63,361
State:
$62,806
(% of AGI for various income ranges: 1049.6% for AGIs below $25k, 3368.1% for AGIs $25k-50k, 6132.2% for AGIs $50k-75k, 7965.7% for AGIs $75k-100k, 15401.1% for AGIs $100k-200k, 70101.0% for AGIs over 200k)
Taxable interest for individuals: $1,808 (reported on 39.1% of returns)
This zip code:
$1,808
Pennsylvania:
$1,633
(% of AGI for various income ranges: 32.4% for AGIs below $25k, 33.1% for AGIs $25k-50k, 74.7% for AGIs $50k-75k, 81.6% for AGIs $75k-100k, 154.8% for AGIs $100k-200k, 1791.0% for AGIs over 200k)
Ordinary dividends: $6,177 (reported on 27.8% of returns)
Here:
$6,177
State:
$7,382
(% of AGI for various income ranges: 56.2% for AGIs below $25k, 74.3% for AGIs $25k-50k, 176.6% for AGIs $50k-75k, 236.7% for AGIs $75k-100k, 404.9% for AGIs $100k-200k, 4327.0% for AGIs over 200k)
Net capital gain/loss in AGI: +$12,786 (reported on 22.3% of returns)
Here:
+$12,786
State:
+$23,522
(% of AGI for various income ranges: 17.9% for AGIs below $25k, 68.5% for AGIs $25k-50k, 126.9% for AGIs $50k-75k, 212.9% for AGIs $75k-100k, 689.3% for AGIs $100k-200k, 10386.0% for AGIs over 200k)
Profit/loss from business: +$17,511 (reported on 11.9% of returns)
Here:
+$17,511
State:
+$16,274
(% of AGI for various income ranges: 91.2% for AGIs below $25k, 87.5% for AGIs $25k-50k, 197.3% for AGIs $50k-75k, 140.4% for AGIs $75k-100k, 396.3% for AGIs $100k-200k, 6463.0% for AGIs over 200k)
Taxable individual retirement arrangement distribution: $15,630 (reported on 17.2% of returns)
17754:
$15,630
Pennsylvania:
$18,583
(% of AGI for various income ranges: 145.7% for AGIs below $25k, 198.8% for AGIs $25k-50k, 360.5% for AGIs $50k-75k, 523.3% for AGIs $75k-100k, 877.3% for AGIs $100k-200k, 2297.0% for AGIs over 200k)
Self-employed (Keogh) retirement plans: $21,267 (reported on 0.5% of returns)
17754:
$21,267
Pennsylvania:
$25,407
(% of AGI for various income ranges: 89.9% for AGIs $100k-200k)
Total itemized deductions: $34,507 (reported on 6.5% of returns)
Here:
$34,507
State:
$34,850
(% of AGI for various income ranges: 61.3% for AGIs below $25k, 80.9% for AGIs $25k-50k, 327.5% for AGIs $50k-75k, 275.5% for AGIs $75k-100k, 582.1% for AGIs $100k-200k, 5065.0% for AGIs over 200k)
Charity contributions: $13,062 (reported on 5.4% of returns)
Here:
$13,062
State:
$12,392
(% of AGI for various income ranges: 16.8% for AGIs $25k-50k, 47.2% for AGIs $50k-75k, 59.8% for AGIs $75k-100k, 137.2% for AGIs $100k-200k, 2702.0% for AGIs over 200k)
Taxes paid: $7,876 (reported on 6.5% of returns)
17754:
$7,876
State:
$8,200
(% of AGI for various income ranges: 8.3% for AGIs below $25k, 17.5% for AGIs $25k-50k, 69.8% for AGIs $50k-75k, 69.2% for AGIs $75k-100k, 163.4% for AGIs $100k-200k, 1013.0% for AGIs over 200k)
Earned income credit: $1,954 (reported on 9.0% of returns)
Here:
$1,954
State:
$2,100
(% of AGI for various income ranges: 58.2% for AGIs below $25k, 45.7% for AGIs $25k-50k)
Percentage of individuals using paid preparers for their 2020 taxes: 93.0%
Here:
93%
State:
92%
(% for various income ranges: 91.0% for AGIs below $25k, 94.0% for AGIs $25k-50k, 93.6% for AGIs $50k-75k, 92.9% for AGIs $75k-100k, 94.0% for AGIs $100k-200k, 96.6% for AGIs over 200k)
Averages for the 2012 tax year for zip code 17754, filed in 2013:
Average Adjusted Gross Income (AGI) in 2012: $60,577 (Individual Income Tax Returns)
Here:
$60,577
State:
$61,346
Salary/wage: $51,531 (reported on 78.6% of returns)
Here:
$51,531
State:
$51,902
(% of AGI for various income ranges: 64.1% for AGIs below $25k, 71.8% for AGIs $25k-50k, 73.3% for AGIs $50k-75k, 70.9% for AGIs $75k-100k, 71.6% for AGIs $100k-200k, 50.7% for AGIs over 200k)
Taxable interest for individuals: $1,441 (reported on 42.9% of returns)
This zip code:
$1,441
Pennsylvania:
$1,588
(% of AGI for various income ranges: 2.2% for AGIs below $25k, 1.0% for AGIs $25k-50k, 0.9% for AGIs $50k-75k, 0.7% for AGIs $75k-100k, 0.8% for AGIs $100k-200k, 1.2% for AGIs over 200k)
Ordinary dividends: $4,842 (reported on 30.1% of returns)
Here:
$4,842
State:
$5,827
(% of AGI for various income ranges: 3.3% for AGIs below $25k, 1.8% for AGIs $25k-50k, 1.9% for AGIs $50k-75k, 1.9% for AGIs $75k-100k, 1.9% for AGIs $100k-200k, 3.9% for AGIs over 200k)
Net capital gain/loss in AGI: +$8,596 (reported on 20.1% of returns)
Here:
+$8,596
State:
+$14,495
(% of AGI for various income ranges: 0.7% for AGIs $50k-75k, 0.6% for AGIs $75k-100k, 1.2% for AGIs $100k-200k, 11.1% for AGIs over 200k)
Profit/loss from business: +$13,951 (reported on 12.7% of returns)
Here:
+$13,951
State:
+$16,268
(% of AGI for various income ranges: 5.2% for AGIs below $25k, 3.1% for AGIs $25k-50k, 1.7% for AGIs $50k-75k, 2.6% for AGIs $75k-100k, 2.4% for AGIs $100k-200k, 3.9% for AGIs over 200k)
Taxable individual retirement arrangement distribution: $13,831 (reported on 16.6% of returns)
17754:
$13,831
Pennsylvania:
$14,550
(% of AGI for various income ranges: 6.7% for AGIs below $25k, 4.3% for AGIs $25k-50k, 3.1% for AGIs $50k-75k, 4.2% for AGIs $75k-100k, 4.3% for AGIs $100k-200k, 2.1% for AGIs over 200k)
Self-employment retirement plans: $14,400 (reported on 0.5% of returns)
17754:
$14,400
Pennsylvania:
$20,922
Total itemized deductions: $20,712 (18% of AGI, reported on 31.6% of returns)
Here:
$20,712
State:
$23,538
Here:
18.2% of AGI
State:
18.4% of AGI
(% of AGI for various income ranges: 8.5% for AGIs below $25k, 8.4% for AGIs $25k-50k, 10.3% for AGIs $50k-75k, 11.2% for AGIs $75k-100k, 12.6% for AGIs $100k-200k, 10.8% for AGIs over 200k)
Charity contributions: $4,410 (reported on 25.6% of returns)
Here:
$4,410
State:
$4,025
(% of AGI for various income ranges: 0.8% for AGIs below $25k, 1.0% for AGIs $25k-50k, 1.5% for AGIs $50k-75k, 1.6% for AGIs $75k-100k, 2.2% for AGIs $100k-200k, 2.7% for AGIs over 200k)
Taxes paid: $8,300 (reported on 31.6% of returns)
17754:
$8,300
State:
$9,982
(% of AGI for various income ranges: 1.8% for AGIs below $25k, 2.3% for AGIs $25k-50k, 3.4% for AGIs $50k-75k, 4.4% for AGIs $75k-100k, 5.4% for AGIs $100k-200k, 5.7% for AGIs over 200k)
Earned income credit: $1,763 (reported on 10.0% of returns)
Here:
$1,763
State:
$2,106
(% of AGI for various income ranges: 3.0% for AGIs below $25k, 0.7% for AGIs $25k-50k)
Percentage of individuals using paid preparers for their 2012 taxes: 58.1%
Here:
58%
State:
53%
(% for various income ranges: 50.9% for AGIs below $25k, 56.7% for AGIs $25k-50k, 62.4% for AGIs $50k-75k, 63.8% for AGIs $75k-100k, 63.4% for AGIs $100k-200k, 85.0% for AGIs over 200k)
Averages for the 2004 tax year for zip code 17754, filed in 2005:
Average Adjusted Gross Income (AGI) in 2004: $50,500 (Individual Income Tax Returns)
Here:
$50,500
State:
$48,049
Salary/wage: $40,249 (reported on 80.0% of returns)
Here:
$40,249
State:
$42,646
(% of AGI for various income ranges: 100.9% for AGIs below $10k, 63.5% for AGIs $10k-25k, 73.7% for AGIs $25k-50k, 78.6% for AGIs $50k-75k, 80.1% for AGIs $75k-100k, 45.8% for AGIs over 100k)
Taxable interest for individuals: $1,701 (reported on 58.1% of returns)
This zip code:
$1,701
Pennsylvania:
$1,657
(% of AGI for various income ranges: 7.3% for AGIs below $10k, 3.8% for AGIs $10k-25k, 2.2% for AGIs $25k-50k, 1.8% for AGIs $50k-75k, 1.4% for AGIs $75k-100k, 1.6% for AGIs over 100k)
Taxable dividends: $3,434 (reported on 37.1% of returns)
Here:
$3,434
State:
$3,566
(% of AGI for various income ranges: 6.6% for AGIs below $10k, 3.5% for AGIs $10k-25k, 1.8% for AGIs $25k-50k, 1.7% for AGIs $50k-75k, 2.0% for AGIs $75k-100k, 3.1% for AGIs over 100k)
Net capital gain/loss: +$10,879 (reported on 26.4% of returns)
Here:
+$10,879
State:
+$9,716
(% of AGI for various income ranges: -2.7% for AGIs below $10k, 0.8% for AGIs $10k-25k, 1.3% for AGIs $25k-50k, 0.7% for AGIs $50k-75k, 1.1% for AGIs $75k-100k, 12.7% for AGIs over 100k)
Profit/loss from business: +$12,383 (reported on 13.9% of returns)
Here:
+$12,383
State:
+$14,267
(% of AGI for various income ranges: 8.3% for AGIs below $10k, 4.2% for AGIs $10k-25k, 3.1% for AGIs $25k-50k, 2.8% for AGIs $50k-75k, 2.6% for AGIs $75k-100k, 3.7% for AGIs over 100k)
IRA payment deduction: $3,113 (reported on 3.5% of returns)
17754:
$3,113
Pennsylvania:
$2,903
(% of AGI for various income ranges: 0.4% for AGIs $10k-25k, 0.3% for AGIs $25k-50k, 0.3% for AGIs $50k-75k, 0.2% for AGIs $75k-100k, 0.1% for AGIs over 100k)
Self-employed pension: $11,550 (reported on 0.7% of returns)
Here:
$11,550
Pennsylvania:
$14,674
Total itemized deductions: $17,726 (17% of AGI, reported on 32.1% of returns)
Here:
$17,726
State:
$18,804
Here:
17.3% of AGI
State:
19.5% of AGI
(% of AGI for various income ranges: 10.6% for AGIs below $10k, 9.2% for AGIs $10k-25k, 10.8% for AGIs $25k-50k, 12.6% for AGIs $50k-75k, 15.1% for AGIs $75k-100k, 10.0% for AGIs over 100k)
Charity contributions deductions: $3,489 (3% of AGI, reported on 28.3% of returns)
Here:
$3,489
State:
$3,337
Here:
3.3% of AGI
State:
3.3% of AGI
(% of AGI for various income ranges: 0.5% for AGIs below $10k, 0.9% for AGIs $10k-25k, 1.2% for AGIs $25k-50k, 1.8% for AGIs $50k-75k, 1.8% for AGIs $75k-100k, 2.6% for AGIs over 100k)
Total tax: $8,725 (reported on 76.0% of returns)
17754:
$8,725
State:
$8,008
(% of AGI for various income ranges: 3.0% for AGIs below $10k, 3.9% for AGIs $10k-25k, 6.8% for AGIs $25k-50k, 8.4% for AGIs $50k-75k, 10.0% for AGIs $75k-100k, 21.1% for AGIs over 100k)
Earned income credit: $1,461 (reported on 9.6% of returns)
Here:
$1,461
State:
$1,643
Percentage of individuals using paid preparers for their 2004 taxes: 57.5%
Here:
57%
State:
56%
(% for various income ranges: 49.9% for AGIs below $10k, 57.8% for AGIs $10k-25k, 59.5% for AGIs $25k-50k, 60.6% for AGIs $50k-75k, 55.1% for AGIs $75k-100k, 67.4% for AGIs over 100k)
Likely homosexual households (counted as self-reported same-sex unmarried-partner households)
Lesbian couples: 0.0% of all households
Gay men: 0.2% of all households
Household received Food Stamps/SNAP in the past 12 months: 449 Household did not receive Food Stamps/SNAP in the past 12 months: 4,646
Women who had a birth in the past 12 months: 88 (74 now married, 16 unmarried) Women who did not have a birth in the past 12 months: 2,171 (1,246 now married, 911 unmarried)
Housing units in zip code 17754 with a mortgage: 2,120 (304 second mortgage, 2 home equity loan, 291 both second mortgage and home equity loan) Houses without a mortgage: 184
Median monthly owner costs for units with a mortgage: $1,587 Median monthly owner costs for units without a mortgage: $597
Residents with income below the poverty level in 2022:
This zip code:
4.5%
Whole state:
11.8%
Residents with income below 50% of the poverty level in 2022:
This zip code:
2.8%
Whole state:
6.1%
Median number of rooms in houses and condos:
Here:
7.0
State:
6.8
Median number of rooms in apartments:
Here:
4.6
State:
4.3
Notable locations in this zip code not listed on our city pages
Notable locations in zip code 17754: Fairfield Center (A), Williamsport Regional Airport Fire Brigade (B), Lysock-View County Home (C), Eldred Township Volunteer Fire Company (D), Willing Hand Fire Hose Company 1 (E). Display/hide their locations on the map
Churches in zip code 17754 include: Heilman Church (A), Lycoming Valley Baptist Church (B), First Christian Church (C), Fox Hollow Church (D), Church of the Good Shepherd (E), Fairfield Church (F), Mount Zion Church (G), Mill Creek Church (H). Display/hide their locations on the map
Cemeteries: Christian Hill Cemetery (1), Edgewood Cemetery (2), Ohey Sholem Cemetery (3), Edgewood Cemetery (4), Montoursville Cemetery (5). Display/hide their locations on the map
Streams, rivers, and creeks: Loyalsock Creek (A), Roaring Run (B), Tules Run (C), Joe Gray Run (D), Lick Run (E), Brewer Run (F), Dry Run (G), Butternut Grove Run (H), Rush Run (I). Display/hide their locations on the map
In group quarters: 392 (-1 institutionalized population)
Size of family households: 1,785 2-persons, 734 3-persons, 495 4-persons, 232 5-persons, 123 6-persons, 13 7-or-more-persons
Size of nonfamily households: 1,501 1-person, 194 2-persons, 25 4-persons
1,875 married couples with children.
410 single-parent households (103 men, 307 women).
96.3% of residents of 17754 zip code speak English at home.
0.7% of residents speak Spanish at home (52% very well, 44% well, 4% not well).
0.9% of residents speak other Indo-European language at home (94% very well, 6% not well).
1.7% of residents speak Asian or Pacific Island language at home (40% very well, 27% well, 24% not well, 8% not at all).
0.2% of residents speak other language at home (100% very well).
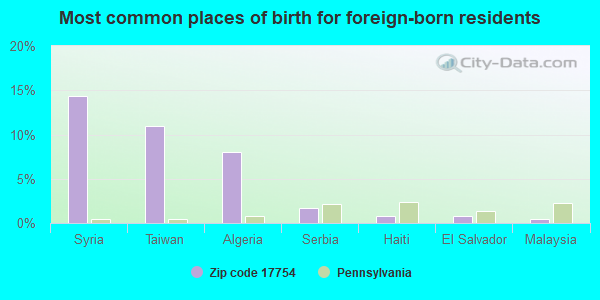
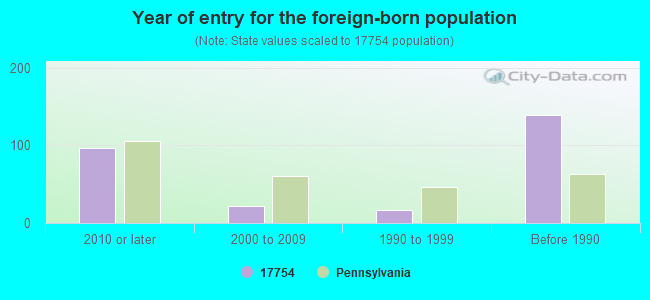
Foreign born population: 235 (1.9%) (36.3% of them are naturalized citizens)
This zip code:
1.9%
Whole state:
7.5%
14%Syria
11%Taiwan
8%Algeria
2%Serbia
1%Haiti
1%El Salvador
0%Malaysia
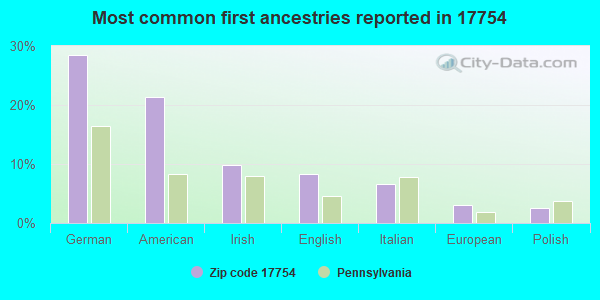
29%German
21%American
10%Irish
8%English
7%Italian
3%European
3%Polish
Year of entry for the foreign-born population
972010 or later
222000 to 2009
171990 to 1999
139Before 1990
Facilities with environmental interests located in this zip code:
ALEXANDER BLAISE CHEVROLET (933 BROAD ST in MONTOURSVILLE, PA)
(Integrated Compliance Information System) - ICIS-03-1996-0029, FORMAL ENFORCEMENT ACTION STATE MASTER (Pennsylvania database) - RCRIS-PAD039435623, HAZARDOUS WASTE PROGRAM Small Quantity Generators, between 100 kg and 1000 kg of hazardous waste/month (Resource Conservation and Recovery Act (tracking hazardous waste)) - notification Organizations: OPERNAME (CONTACT/OPERATOR)
, BLAISE ALEXANDER (CONTACT/OWNER)
Alternative names: BLAISE ALEXANDER CHEVROLET INCORPORATED
BIEBERS GARAGE (301 N LOYALSOCK AVENUE in MONTOURSVILLE, PA)
AIR MINOR (AIRS/AFS) STATE MASTER (Pennsylvania database) - RCRIS-PAD014417240, HAZARDOUS WASTE PROGRAM Small Quantity Generators, between 100 kg and 1000 kg of hazardous waste/month (Resource Conservation and Recovery Act (tracking hazardous waste)) - notification Business SIC classification: GENERAL AUTOMOTIVE REPAIR SHOPS; AUTOMOTIVE REPAIR SHOPS Organizations: OPERNAME (CONTACT/OPERATOR)
, BIEBER, E PHILLIP (CONTACT/OWNER)
ATOMERGIC CHEMETALS (RR 4 in MONTOURSVILLE, PA)
STATE MASTER (Pennsylvania database) - RCRIS-PAD980831952, HAZARDOUS WASTE PROGRAM (Resource Conservation and Recovery Act (tracking hazardous waste)) Organizations: OPERNAME (CONTACT/OPERATOR)
21ST CENTURY SIGN (4885 LYCOMING MALL RD in MONTOURSVILLE, PA)
STATE MASTER (Pennsylvania database) - RCRIS-PAR000039842, HAZARDOUS WASTE PROGRAM Small Quantity Generators, between 100 kg and 1000 kg of hazardous waste/month (Resource Conservation and Recovery Act (tracking hazardous waste)) - notification Organizations: CLAPPER ENTERPISES (CONTACT/OWNER)
Alternative names: 21ST CENTURY SIGNS
BLAISE ALEXANDER BODY SHOP (FAIRFIELD RD, RD #5 BOX 710 in MONTOURSVILLE, PA)
Small Quantity Generators, between 100 kg and 1000 kg of hazardous waste/month (Resource Conservation and Recovery Act (tracking hazardous waste)) - notification Business NAICS classification: AUTOMOTIVE BODY, PAINT, AND INTERIOR REPAIR AND MAINTENANCE. Organizations: OPERNAME (CONTACT/OPERATOR)
Housing units lacking complete plumbing facilities: 0.8% Housing units lacking complete kitchen facilities: 3.1%
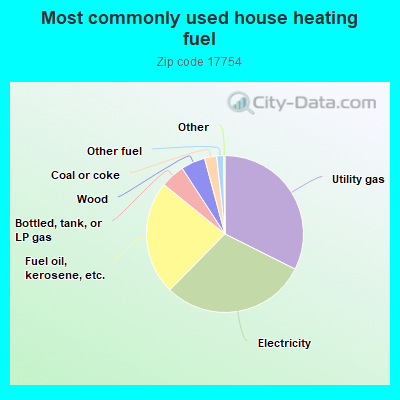
32.5%Utility gas
30.1%Electricity
23.5%Fuel oil, kerosene, etc.
5.0%Bottled, tank, or LP gas
5.0%Wood
2.5%Coal or coke
1.4%Other fuel
Population in 1990: 11,266. Population change in the 1990s: +915 (+8.1%).
Place of birth for U.S.-born residents:
This state: 10,063
Northeast: 831
Midwest: 303
South: 454
West: 229
65% of the 17754 zip code residents lived in the same house 5 years ago. Out of people who lived in different houses, 78% lived in this county. Out of people who lived in different counties, 50% lived in Pennsylvania.
93% of the 17754 zip code residents lived in the same house 1 year ago. Out of people who lived in different houses, 65% moved from this county. Out of people who lived in different houses, 18% moved from different county within same state. Out of people who lived in different houses, 14% moved from different state. Out of people who lived in different houses, 4% moved from abroad.
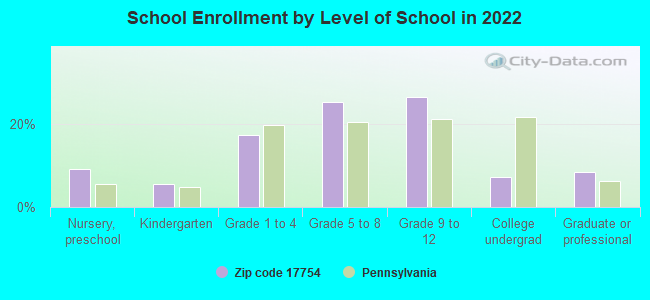
Private vs. public school enrollment:
Students in private schools in grades 1 to 8 (elementary and middle school): 95
Here:
9.6%
Pennsylvania:
15.7%
Students in private schools in grades 9 to 12 (high school): 32
Here:
5.2%
Pennsylvania:
13.4%
Students in private undergraduate colleges: 10
Here:
6.4%
Pennsylvania:
39.8%
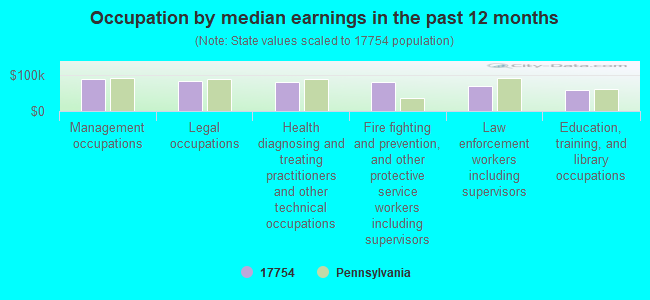
Occupation by median earnings in the past 12 months ($)
89,763Management occupations
84,824Legal occupations
82,814Health diagnosing and treating practitioners and other technical occupations
80,454Fire fighting and prevention, and other protective service workers including supervisors
68,931Law enforcement workers including supervisors
57,757Education, training, and library occupations
Companies with federal contracts located in this zip code:
SUNOCO, INC (112 BROAD ST in MONTOURSVILLE, PA; small business) : $147,382 in 5 contractsfrom 2003 to 2006
Contracts for Fuel Oils, Liquid Propellants and Fuels, Petroleum Base by Bureau of Prisoners/Federal Prison System, Army Signed by year:2000: $0; 2001: $0; 2002: $0; 2003: $144,368; 2004: $3,603; 2005: $0; 2006: -$589.
Biggest contracts:
$86,363 with Bureau of Prisoners/Federal Prison System for Fuel Oils. Signed on 2003-02-15. Completion date: 2003-03-15.
$58,005, same as above.Signed on 2003-02-15. Completion date: 2003-03-15.
$3,603 with Army for Liquid Propellants and Fuels, Petroleum Base. Signed on 2004-08-17. Completion date: 2004-08-19.
$0 with Army for Fuel Oils. Signed on 2006-07-06. Completion date: 2006-07-31.
RALPH S ALBERTS CO INC (60 CHOATE CIR in MONTOURSVILLE, PA; small business) : $75,241 in 3 contractsfrom 2003 to 2006
$54,749 with Navy for Invalid code: AD97. Signed on 2003-02-13. Completion date: 2003-05-16.
$16,029 with Air Force for Weapons -- Basic Research (R&D). Signed on 2006-02-27. Completion date: 2006-04-18.
$4,463 with Navy for Invalid code: AD97. Signed on 2004-02-25. Completion date: 2004-04-06.
CCT TECHNOLOGIES INC (1601 SYCAMORE RD in MONTOURSVILLE, PA; small business)
$3,580 with Army for ADP Support Equipment. Signed on 2003-04-15. Completion date: 2003-04-22.
Top industries in this zip code by the number of employees in 2005:
Health Care and Social Assistance: Nursing Care Facilities (100-249 employees: 2 establishments, 5-9 employees: 1 establishment, 1-4 employees: 2 establishments)
Utilities: Electric Power Distribution (100-249: 1)
Construction: Highway, Street, and Bridge Construction (100-249: 1)
Administrative and Support and Waste Management and Remediation Services: Telephone Answering Services (100-249: 1)
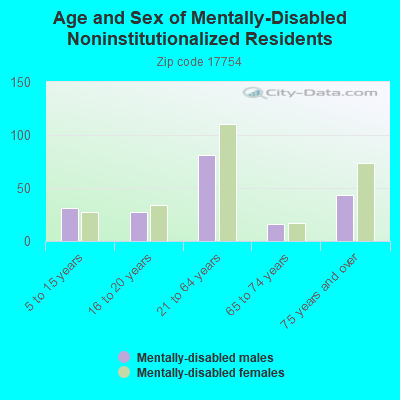
People in group quarters in 2010:
277 people in nursing facilities/skilled-nursing facilities
118 people in correctional residential facilities
4 people in residential treatment centers for adults
People in group quarters in 2000:
327 people in nursing homes
10 people in other noninstitutional group quarters
3 people in homes for the mentally retarded
Fatal accident statistics in 2013:
Fatal accident count: 2
Vehicles involved in fatal accidents: 4
Fatal accidents caused by drunken drivers: 0
Fatalities: 3
Persons involved in fatal accidents: 4
Pedestrians involved in fatal accidents: 0
Fatal accident statistics in 2012:
Fatal accident count: 3
Vehicles involved in fatal accidents: 3
Fatal accidents caused by drunken drivers: 0
Fatalities: 3
Persons involved in fatal accidents: 7
Pedestrians involved in fatal accidents: 1
Home Mortgage Disclosure Act Aggregated Statistics For Year 2009 (Based on 2 full and 10 partial tracts)
A) FHA, FSA/RHS & VA Home Purchase Loans
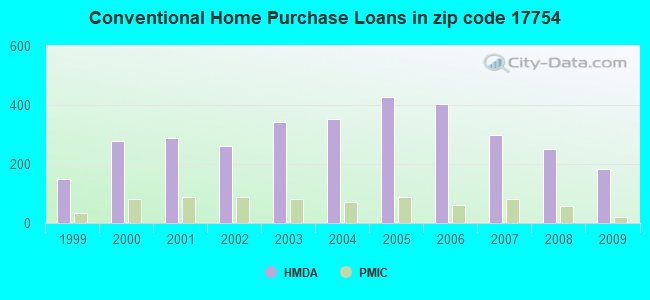
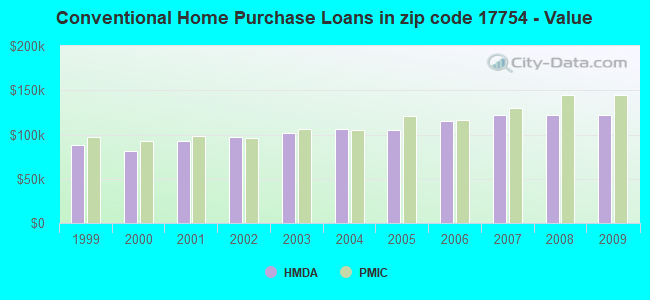
B) Conventional Home Purchase Loans
C) Refinancings
D) Home Improvement Loans
E) Loans on Dwellings For 5+ Families
F) Non-occupant Loans on < 5 Family Dwellings (A B C & D)
G) Loans On Manufactured Home Dwelling (A B C & D)
Number
Average Value
Number
Average Value
Number
Average Value
Number
Average Value
Number
Average Value
Number
Average Value
Number
Average Value
LOANS ORIGINATED
98
$135,475
184
$122,061
532
$124,063
120
$45,438
6
$904,297
43
$119,116
9
$63,042
APPLICATIONS APPROVED, NOT ACCEPTED
2
$120,155
6
$116,465
39
$123,981
11
$36,709
1
$2,291,520
1
$179,440
0
$0
APPLICATIONS DENIED
6
$131,145
12
$120,815
143
$132,046
39
$34,388
0
$0
3
$95,547
9
$55,289
APPLICATIONS WITHDRAWN
5
$141,260
12
$141,265
121
$142,631
8
$124,696
0
$0
2
$95,955
2
$49,780
FILES CLOSED FOR INCOMPLETENESS
2
$98,625
0
$0
13
$137,778
0
$0
0
$0
0
$0
0
$0
Aggregated Statistics For Year 2008 (Based on 2 full and 10 partial tracts)
A) FHA, FSA/RHS & VA Home Purchase Loans
B) Conventional Home Purchase Loans
C) Refinancings
D) Home Improvement Loans
E) Loans on Dwellings For 5+ Families
F) Non-occupant Loans on < 5 Family Dwellings (A B C & D)
G) Loans On Manufactured Home Dwelling (A B C & D)
Number
Average Value
Number
Average Value
Number
Average Value
Number
Average Value
Number
Average Value
Number
Average Value
Number
Average Value
LOANS ORIGINATED
52
$138,120
251
$122,416
294
$113,208
124
$42,761
3
$1,628,303
52
$113,779
7
$53,260
APPLICATIONS APPROVED, NOT ACCEPTED
5
$135,748
20
$111,544
37
$98,029
15
$28,507
1
$169,950
2
$64,090
2
$31,030
APPLICATIONS DENIED
3
$73,140
35
$132,015
195
$131,870
52
$44,799
0
$0
17
$57,946
2
$39,925
APPLICATIONS WITHDRAWN
3
$78,297
17
$207,490
90
$132,747
9
$132,689
0
$0
3
$105,710
0
$0
FILES CLOSED FOR INCOMPLETENESS
0
$0
4
$122,430
10
$159,166
5
$13,300
1
$4,498,250
0
$0
0
$0
Aggregated Statistics For Year 2007 (Based on 2 full and 10 partial tracts)
A) FHA, FSA/RHS & VA Home Purchase Loans
B) Conventional Home Purchase Loans
C) Refinancings
D) Home Improvement Loans
E) Loans on Dwellings For 5+ Families
F) Non-occupant Loans on < 5 Family Dwellings (A B C & D)
G) Loans On Manufactured Home Dwelling (A B C & D)
Number
Average Value
Number
Average Value
Number
Average Value
Number
Average Value
Number
Average Value
Number
Average Value
Number
Average Value
LOANS ORIGINATED
27
$113,910
299
$121,701
358
$90,192
146
$33,558
3
$1,528,693
40
$88,878
9
$69,576
APPLICATIONS APPROVED, NOT ACCEPTED
3
$131,720
24
$116,365
58
$112,031
14
$69,230
0
$0
4
$133,295
3
$37,320
APPLICATIONS DENIED
3
$151,817
61
$113,578
230
$122,888
73
$34,870
0
$0
17
$210,806
19
$38,972
APPLICATIONS WITHDRAWN
1
$188,320
39
$108,675
98
$112,322
11
$53,810
0
$0
1
$147,990
0
$0
FILES CLOSED FOR INCOMPLETENESS
0
$0
5
$97,906
31
$140,914
2
$44,855
0
$0
2
$128,355
0
$0
Aggregated Statistics For Year 2006 (Based on 2 full and 10 partial tracts)
A) FHA, FSA/RHS & VA Home Purchase Loans
B) Conventional Home Purchase Loans
C) Refinancings
D) Home Improvement Loans
E) Loans on Dwellings For 5+ Families
F) Non-occupant Loans on < 5 Family Dwellings (A B C & D)
G) Loans On Manufactured Home Dwelling (A B C & D)
Number
Average Value
Number
Average Value
Number
Average Value
Number
Average Value
Number
Average Value
Number
Average Value
Number
Average Value
LOANS ORIGINATED
28
$124,532
405
$115,046
467
$83,982
183
$33,051
4
$222,212
77
$93,990
20
$58,866
APPLICATIONS APPROVED, NOT ACCEPTED
3
$104,237
23
$131,499
58
$98,729
23
$26,099
0
$0
4
$67,632
1
$65,500
APPLICATIONS DENIED
2
$119,405
66
$98,112
302
$100,128
72
$39,295
3
$4,177
13
$72,706
16
$42,939
APPLICATIONS WITHDRAWN
0
$0
44
$113,436
187
$111,652
13
$48,492
0
$0
4
$158,055
5
$44,830
FILES CLOSED FOR INCOMPLETENESS
0
$0
4
$137,310
37
$100,996
2
$38,070
0
$0
2
$101,055
0
$0
Aggregated Statistics For Year 2005 (Based on 2 full and 10 partial tracts)
A) FHA, FSA/RHS & VA Home Purchase Loans
B) Conventional Home Purchase Loans
C) Refinancings
D) Home Improvement Loans
E) Loans on Dwellings For 5+ Families
F) Non-occupant Loans on < 5 Family Dwellings (A B C & D)
G) Loans On Manufactured Home Dwelling (A B C & D)
Number
Average Value
Number
Average Value
Number
Average Value
Number
Average Value
Number
Average Value
Number
Average Value
Number
Average Value
LOANS ORIGINATED
16
$121,669
427
$105,105
487
$89,422
129
$33,196
3
$97,020
64
$84,922
27
$41,274
APPLICATIONS APPROVED, NOT ACCEPTED
1
$155,630
24
$108,899
81
$84,571
21
$36,490
0
$0
7
$101,640
5
$61,612
APPLICATIONS DENIED
0
$0
54
$87,294
291
$97,749
72
$40,601
2
$174,600
8
$58,544
19
$37,403
APPLICATIONS WITHDRAWN
3
$96,547
45
$102,711
269
$115,732
28
$157,449
0
$0
12
$100,790
3
$143,723
FILES CLOSED FOR INCOMPLETENESS
0
$0
8
$124,978
23
$137,132
3
$33,293
0
$0
1
$108,850
0
$0
Aggregated Statistics For Year 2004 (Based on 2 full and 10 partial tracts)
A) FHA, FSA/RHS & VA Home Purchase Loans
B) Conventional Home Purchase Loans
C) Refinancings
D) Home Improvement Loans
E) Loans on Dwellings For 5+ Families
F) Non-occupant Loans on < 5 Family Dwellings (A B C & D)
G) Loans On Manufactured Home Dwelling (A B C & D)
Number
Average Value
Number
Average Value
Number
Average Value
Number
Average Value
Number
Average Value
Number
Average Value
Number
Average Value
LOANS ORIGINATED
12
$113,098
351
$106,762
602
$85,098
135
$31,198
4
$119,310
61
$86,235
23
$43,771
APPLICATIONS APPROVED, NOT ACCEPTED
0
$0
23
$85,330
116
$89,403
23
$36,196
0
$0
6
$73,298
4
$31,138
APPLICATIONS DENIED
1
$58,660
47
$84,715
392
$104,848
72
$34,572
0
$0
13
$76,078
25
$44,817
APPLICATIONS WITHDRAWN
2
$85,360
30
$101,934
227
$108,643
19
$32,473
0
$0
8
$95,111
2
$48,500
FILES CLOSED FOR INCOMPLETENESS
0
$0
1
$61,120
32
$112,551
6
$43,910
0
$0
0
$0
1
$80,870
Aggregated Statistics For Year 2003 (Based on 2 full and 10 partial tracts)
A) FHA, FSA/RHS & VA Home Purchase Loans
B) Conventional Home Purchase Loans
C) Refinancings
D) Home Improvement Loans
E) Loans on Dwellings For 5+ Families
F) Non-occupant Loans on < 5 Family Dwellings (A B C & D)
Number
Average Value
Number
Average Value
Number
Average Value
Number
Average Value
Number
Average Value
Number
Average Value
LOANS ORIGINATED
22
$103,801
342
$102,047
1,055
$95,547
111
$28,165
1
$527,680
58
$73,883
APPLICATIONS APPROVED, NOT ACCEPTED
3
$115,017
22
$74,957
142
$86,388
17
$27,152
0
$0
5
$59,806
APPLICATIONS DENIED
3
$92,297
58
$77,213
346
$88,972
53
$22,213
0
$0
4
$59,050
APPLICATIONS WITHDRAWN
0
$0
22
$91,783
212
$94,447
15
$33,279
0
$0
2
$60,180
FILES CLOSED FOR INCOMPLETENESS
0
$0
6
$114,002
35
$93,165
4
$18,185
0
$0
0
$0
Aggregated Statistics For Year 2002 (Based on 2 full and 10 partial tracts)
A) FHA, FSA/RHS & VA Home Purchase Loans
B) Conventional Home Purchase Loans
C) Refinancings
D) Home Improvement Loans
E) Loans on Dwellings For 5+ Families
F) Non-occupant Loans on < 5 Family Dwellings (A B C & D)
Number
Average Value
Number
Average Value
Number
Average Value
Number
Average Value
Number
Average Value
Number
Average Value
LOANS ORIGINATED
34
$93,633
260
$97,141
683
$95,587
117
$32,684
3
$1,299,073
42
$93,874
APPLICATIONS APPROVED, NOT ACCEPTED
3
$115,840
26
$65,628
99
$75,544
15
$34,290
0
$0
3
$89,310
APPLICATIONS DENIED
4
$80,578
49
$73,584
253
$83,814
38
$20,217
0
$0
3
$131,463
APPLICATIONS WITHDRAWN
0
$0
20
$101,159
109
$91,473
2
$41,605
0
$0
0
$0
FILES CLOSED FOR INCOMPLETENESS
0
$0
3
$21,717
20
$92,798
2
$219,610
0
$0
1
$112,380
Aggregated Statistics For Year 2001 (Based on 2 full and 10 partial tracts)
A) FHA, FSA/RHS & VA Home Purchase Loans
B) Conventional Home Purchase Loans
C) Refinancings
D) Home Improvement Loans
E) Loans on Dwellings For 5+ Families
F) Non-occupant Loans on < 5 Family Dwellings (A B C & D)
Number
Average Value
Number
Average Value
Number
Average Value
Number
Average Value
Number
Average Value
Number
Average Value
LOANS ORIGINATED
40
$92,979
288
$92,560
524
$87,528
170
$25,148
9
$452,156
45
$90,818
APPLICATIONS APPROVED, NOT ACCEPTED
1
$53,490
47
$57,403
104
$87,981
27
$35,663
0
$0
4
$63,362
APPLICATIONS DENIED
4
$90,890
77
$48,370
197
$69,104
43
$21,749
2
$487,910
4
$42,235
APPLICATIONS WITHDRAWN
0
$0
20
$93,707
121
$80,116
13
$34,618
0
$0
7
$84,327
FILES CLOSED FOR INCOMPLETENESS
0
$0
2
$54,320
13
$91,221
1
$14,210
0
$0
0
$0
Aggregated Statistics For Year 2000 (Based on 2 full and 10 partial tracts)
A) FHA, FSA/RHS & VA Home Purchase Loans
B) Conventional Home Purchase Loans
C) Refinancings
D) Home Improvement Loans
E) Loans on Dwellings For 5+ Families
F) Non-occupant Loans on < 5 Family Dwellings (A B C & D)
Number
Average Value
Number
Average Value
Number
Average Value
Number
Average Value
Number
Average Value
Number
Average Value
LOANS ORIGINATED
52
$81,867
279
$81,904
232
$68,385
223
$18,194
1
$27,690
35
$32,993
APPLICATIONS APPROVED, NOT ACCEPTED
3
$91,987
40
$58,802
63
$56,333
29
$21,377
0
$0
3
$36,313
APPLICATIONS DENIED
2
$101,930
86
$40,716
139
$66,378
77
$24,815
0
$0
11
$44,605
APPLICATIONS WITHDRAWN
0
$0
12
$99,311
77
$71,580
19
$44,842
0
$0
3
$136,243
FILES CLOSED FOR INCOMPLETENESS
0
$0
4
$54,300
15
$82,787
1
$18,910
0
$0
2
$77,600
Aggregated Statistics For Year 1999 (Based on 1 full and 5 partial tracts)
A) FHA, FSA/RHS & VA Home Purchase Loans
B) Conventional Home Purchase Loans
C) Refinancings
D) Home Improvement Loans
E) Loans on Dwellings For 5+ Families
F) Non-occupant Loans on < 5 Family Dwellings (A B C & D)
2005 - 2018 National Fire Incident Reporting System (NFIRS) incidents
According to the data from the years 2005 - 2018 the average number of fire incidents per year is 23. The highest number of reported fire incidents - 54 took place in 2007, and the least - 3 in 2010. The data has a dropping trend.
When looking into fire subcategories, the most incidents belonged to: Structure Fires (53.8%), and Outside Fires (24.5%).
Fire incident types reported to NFIRS in Zip Code 17754

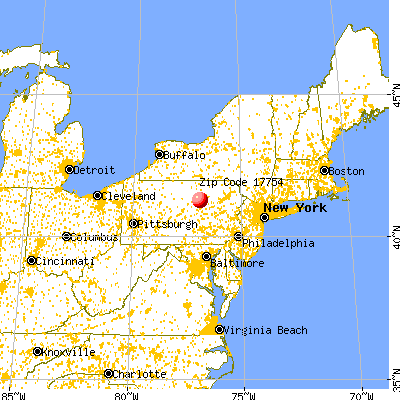


 Nearest zip codes: 17701, 17752, 17756, 17887, 17728, 17762.


 According to the data from the years 2005 - 2018 the average number of fire incidents per year is 23. The highest number of reported fire incidents - 54 took place in 2007, and the least - 3 in 2010. The data has a dropping trend.
 When looking into fire subcategories, the most incidents belonged to: Structure Fires (53.8%), and Outside Fires (24.5%).