Estimated zip code population in 2022: 18,645 Zip code population in 2010: 19,815 Zip code population in 2000: 17,623
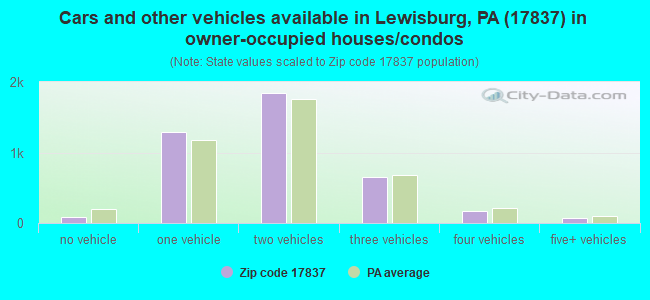
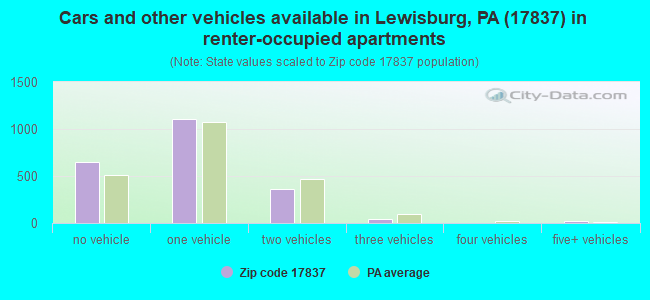
Houses and condos: 7,024 Renter-occupied apartments: 2,179
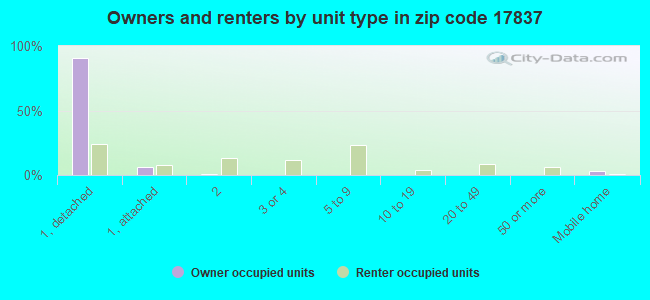
% of renters here:
35%
State:
31%
March 2022 cost of living index in zip code 17837: 88.7 (less than average, U.S. average is 100)
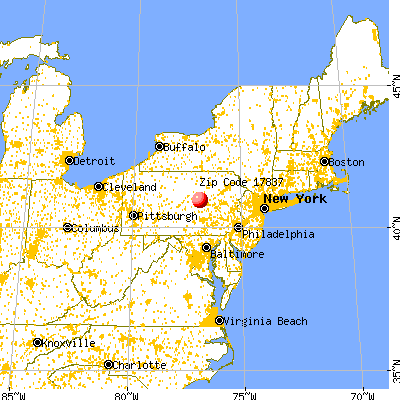
Land area: 62.3 sq. mi. Water area: 0.3 sq. mi.
Population density: 299 people per square mile
(very low).
OSM Map
General Map
Google Map
MSN Map
OSM Map
General Map
Google Map
MSN Map
OSM Map
General Map
Google Map
MSN Map
OSM Map
General Map
Google Map
MSN Map
Please wait while loading the map...
Real estate property taxes paid for housing units in 2022:
This zip code:
1.3% ($3,323)
Pennsylvania:
1.3% ($3,094)
Median real estate property taxes paid for housing units with mortgages in 2022: $3,865 (1.3%) Median real estate property taxes paid for housing units with no mortgage in 2022: $2,775 (1.2%)
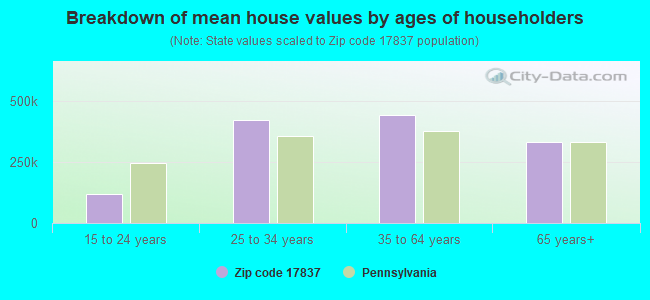
Estimated median house/condo value in 2022: $261,671
17837:
$261,671
Pennsylvania:
$245,500
According to our research of Pennsylvania and other state lists, there were 21 registered sex offenders living in 17837 zip code as of June 16, 2024. The ratio of all residents to sex offenders in zip code 17837 is 960 to 1. The ratio of registered sex offenders to all residents in this zip code is lower than the state average.
Median resident age:
This zip code:
36.8 years
Pennsylvania median age:
40.9 years
Average household size:
This zip code:
2.1 people
Pennsylvania:
2.4 people
Averages for the 2020 tax year for zip code 17837, filed in 2021:
Average Adjusted Gross Income (AGI) in 2020: $92,536 (Individual Income Tax Returns)
Here:
$92,536
State:
$75,707
Salary/wage: $77,111 (reported on 74.2% of returns)
Here:
$77,111
State:
$62,806
(% of AGI for various income ranges: 1039.7% for AGIs below $25k, 3367.5% for AGIs $25k-50k, 5957.1% for AGIs $50k-75k, 8786.2% for AGIs $75k-100k, 16387.4% for AGIs $100k-200k, 77497.7% for AGIs over 200k)
Taxable interest for individuals: $1,564 (reported on 46.3% of returns)
This zip code:
$1,564
Pennsylvania:
$1,633
(% of AGI for various income ranges: 33.3% for AGIs below $25k, 41.0% for AGIs $25k-50k, 79.2% for AGIs $50k-75k, 83.6% for AGIs $75k-100k, 306.3% for AGIs $100k-200k, 623.2% for AGIs over 200k)
Ordinary dividends: $10,041 (reported on 31.3% of returns)
Here:
$10,041
State:
$7,382
(% of AGI for various income ranges: 63.3% for AGIs below $25k, 116.7% for AGIs $25k-50k, 263.2% for AGIs $50k-75k, 298.2% for AGIs $75k-100k, 819.3% for AGIs $100k-200k, 5418.2% for AGIs over 200k)
Net capital gain/loss in AGI: +$24,281 (reported on 27.0% of returns)
Here:
+$24,281
State:
+$23,522
(% of AGI for various income ranges: 26.1% for AGIs below $25k, 71.4% for AGIs $25k-50k, 181.2% for AGIs $50k-75k, 285.4% for AGIs $75k-100k, 948.7% for AGIs $100k-200k, 16918.6% for AGIs over 200k)
Profit/loss from business: +$22,745 (reported on 15.8% of returns)
Here:
+$22,745
State:
+$16,274
(% of AGI for various income ranges: 115.7% for AGIs below $25k, 189.5% for AGIs $25k-50k, 315.3% for AGIs $50k-75k, 330.6% for AGIs $75k-100k, 684.4% for AGIs $100k-200k, 6444.5% for AGIs over 200k)
Taxable individual retirement arrangement distribution: $19,479 (reported on 16.1% of returns)
17837:
$19,479
Pennsylvania:
$18,583
(% of AGI for various income ranges: 124.4% for AGIs below $25k, 172.1% for AGIs $25k-50k, 427.9% for AGIs $50k-75k, 571.0% for AGIs $75k-100k, 1146.9% for AGIs $100k-200k, 2648.6% for AGIs over 200k)
Self-employed (Keogh) retirement plans: $27,500 (reported on 0.7% of returns)
17837:
$27,500
Pennsylvania:
$25,407
(% of AGI for various income ranges: 60.2% for AGIs $75k-100k, 488.2% for AGIs over 200k)
Total itemized deductions: $37,902 (reported on 9.2% of returns)
Here:
$37,902
State:
$34,850
(% of AGI for various income ranges: 69.7% for AGIs below $25k, 167.3% for AGIs $25k-50k, 335.8% for AGIs $50k-75k, 407.8% for AGIs $75k-100k, 938.4% for AGIs $100k-200k, 5366.4% for AGIs over 200k)
Charity contributions: $16,304 (reported on 7.6% of returns)
Here:
$16,304
State:
$12,392
(% of AGI for various income ranges: 32.6% for AGIs $25k-50k, 70.9% for AGIs $50k-75k, 67.2% for AGIs $75k-100k, 295.0% for AGIs $100k-200k, 2645.9% for AGIs over 200k)
Taxes paid: $8,256 (reported on 9.2% of returns)
17837:
$8,256
State:
$8,200
(% of AGI for various income ranges: 6.0% for AGIs below $25k, 30.1% for AGIs $25k-50k, 71.8% for AGIs $50k-75k, 105.0% for AGIs $75k-100k, 248.2% for AGIs $100k-200k, 1081.4% for AGIs over 200k)
Earned income credit: $1,999 (reported on 9.4% of returns)
Here:
$1,999
State:
$2,100
(% of AGI for various income ranges: 68.4% for AGIs below $25k, 50.9% for AGIs $25k-50k)
Percentage of individuals using paid preparers for their 2020 taxes: 92.9%
Here:
93%
State:
92%
(% for various income ranges: 91.0% for AGIs below $25k, 93.2% for AGIs $25k-50k, 93.1% for AGIs $50k-75k, 93.7% for AGIs $75k-100k, 93.6% for AGIs $100k-200k, 96.6% for AGIs over 200k)
Averages for the 2012 tax year for zip code 17837, filed in 2013:
Average Adjusted Gross Income (AGI) in 2012: $69,130 (Individual Income Tax Returns)
Here:
$69,130
State:
$61,346
Salary/wage: $57,738 (reported on 75.8% of returns)
Here:
$57,738
State:
$51,902
(% of AGI for various income ranges: 63.1% for AGIs below $25k, 67.0% for AGIs $25k-50k, 69.0% for AGIs $50k-75k, 68.2% for AGIs $75k-100k, 68.7% for AGIs $100k-200k, 53.2% for AGIs over 200k)
Taxable interest for individuals: $1,308 (reported on 48.5% of returns)
This zip code:
$1,308
Pennsylvania:
$1,588
(% of AGI for various income ranges: 1.9% for AGIs below $25k, 1.4% for AGIs $25k-50k, 0.9% for AGIs $50k-75k, 0.8% for AGIs $75k-100k, 0.9% for AGIs $100k-200k, 0.6% for AGIs over 200k)
Ordinary dividends: $6,246 (reported on 33.3% of returns)
Here:
$6,246
State:
$5,827
(% of AGI for various income ranges: 3.8% for AGIs below $25k, 2.9% for AGIs $25k-50k, 2.3% for AGIs $50k-75k, 2.5% for AGIs $75k-100k, 3.2% for AGIs $100k-200k, 3.3% for AGIs over 200k)
Net capital gain/loss in AGI: +$12,017 (reported on 25.7% of returns)
Here:
+$12,017
State:
+$14,495
(% of AGI for various income ranges: 0.3% for AGIs below $25k, 0.7% for AGIs $25k-50k, 1.5% for AGIs $50k-75k, 1.6% for AGIs $75k-100k, 2.7% for AGIs $100k-200k, 10.3% for AGIs over 200k)
Profit/loss from business: +$18,570 (reported on 15.9% of returns)
Here:
+$18,570
State:
+$16,268
(% of AGI for various income ranges: 5.9% for AGIs below $25k, 4.5% for AGIs $25k-50k, 4.0% for AGIs $50k-75k, 2.9% for AGIs $75k-100k, 3.7% for AGIs $100k-200k, 5.0% for AGIs over 200k)
Taxable individual retirement arrangement distribution: $16,243 (reported on 15.4% of returns)
17837:
$16,243
Pennsylvania:
$14,550
(% of AGI for various income ranges: 4.3% for AGIs below $25k, 4.0% for AGIs $25k-50k, 3.1% for AGIs $50k-75k, 4.0% for AGIs $75k-100k, 4.4% for AGIs $100k-200k, 2.8% for AGIs over 200k)
Self-employment retirement plans: $12,525 (reported on 1.1% of returns)
17837:
$12,525
Pennsylvania:
$20,922
(% of AGI for various income ranges: 0.3% for AGIs $100k-200k, 0.4% for AGIs over 200k)
Total itemized deductions: $23,754 (18% of AGI, reported on 35.2% of returns)
Here:
$23,754
State:
$23,538
Here:
17.6% of AGI
State:
18.4% of AGI
(% of AGI for various income ranges: 8.4% for AGIs below $25k, 9.9% for AGIs $25k-50k, 12.2% for AGIs $50k-75k, 12.9% for AGIs $75k-100k, 14.4% for AGIs $100k-200k, 11.2% for AGIs over 200k)
Charity contributions: $5,075 (reported on 28.8% of returns)
Here:
$5,075
State:
$4,025
(% of AGI for various income ranges: 1.0% for AGIs below $25k, 1.5% for AGIs $25k-50k, 1.8% for AGIs $50k-75k, 2.1% for AGIs $75k-100k, 2.6% for AGIs $100k-200k, 2.3% for AGIs over 200k)
Taxes paid: $10,364 (reported on 34.9% of returns)
17837:
$10,364
State:
$9,982
(% of AGI for various income ranges: 1.5% for AGIs below $25k, 2.7% for AGIs $25k-50k, 4.3% for AGIs $50k-75k, 5.3% for AGIs $75k-100k, 6.8% for AGIs $100k-200k, 5.7% for AGIs over 200k)
Earned income credit: $1,933 (reported on 10.0% of returns)
Here:
$1,933
State:
$2,106
(% of AGI for various income ranges: 3.7% for AGIs below $25k, 0.6% for AGIs $25k-50k)
Percentage of individuals using paid preparers for their 2012 taxes: 58.7%
Here:
59%
State:
53%
(% for various income ranges: 53.5% for AGIs below $25k, 56.6% for AGIs $25k-50k, 62.9% for AGIs $50k-75k, 58.6% for AGIs $75k-100k, 63.4% for AGIs $100k-200k, 80.0% for AGIs over 200k)
Averages for the 2004 tax year for zip code 17837, filed in 2005:
Average Adjusted Gross Income (AGI) in 2004: $51,873 (Individual Income Tax Returns)
Here:
$51,873
State:
$48,049
Salary/wage: $45,704 (reported on 74.8% of returns)
Here:
$45,704
State:
$42,646
(% of AGI for various income ranges: 95.5% for AGIs below $10k, 58.3% for AGIs $10k-25k, 69.8% for AGIs $25k-50k, 71.4% for AGIs $50k-75k, 72.5% for AGIs $75k-100k, 60.6% for AGIs over 100k)
Taxable interest for individuals: $1,790 (reported on 60.7% of returns)
This zip code:
$1,790
Pennsylvania:
$1,657
(% of AGI for various income ranges: 9.2% for AGIs below $10k, 4.1% for AGIs $10k-25k, 2.2% for AGIs $25k-50k, 2.0% for AGIs $50k-75k, 1.6% for AGIs $75k-100k, 1.8% for AGIs over 100k)
Taxable dividends: $4,721 (reported on 38.9% of returns)
Here:
$4,721
State:
$3,566
(% of AGI for various income ranges: 8.8% for AGIs below $10k, 4.4% for AGIs $10k-25k, 2.6% for AGIs $25k-50k, 2.6% for AGIs $50k-75k, 2.4% for AGIs $75k-100k, 4.3% for AGIs over 100k)
Net capital gain/loss: +$7,249 (reported on 29.5% of returns)
Here:
+$7,249
State:
+$9,716
(% of AGI for various income ranges: -2.0% for AGIs below $10k, 1.0% for AGIs $10k-25k, 1.2% for AGIs $25k-50k, 1.4% for AGIs $50k-75k, 1.9% for AGIs $75k-100k, 7.6% for AGIs over 100k)
Profit/loss from business: +$17,415 (reported on 17.0% of returns)
Here:
+$17,415
State:
+$14,267
(% of AGI for various income ranges: 6.9% for AGIs below $10k, 7.0% for AGIs $10k-25k, 5.3% for AGIs $25k-50k, 4.7% for AGIs $50k-75k, 4.2% for AGIs $75k-100k, 6.5% for AGIs over 100k)
Profit/loss from farming: +$3,184 (reported on 2.1% of returns)
Here:
+$3,184
State:
+$274
(% of AGI for various income ranges: -4.0% for AGIs below $10k, -0.1% for AGIs $10k-25k, 0.8% for AGIs $25k-50k, 0.9% for AGIs $50k-75k, -0.2% for AGIs over 100k)
IRA payment deduction: $2,965 (reported on 3.4% of returns)
17837:
$2,965
Pennsylvania:
$2,903
(% of AGI for various income ranges: 0.3% for AGIs $10k-25k, 0.3% for AGIs $25k-50k, 0.3% for AGIs $50k-75k, 0.2% for AGIs $75k-100k, 0.1% for AGIs over 100k)
Self-employed pension: $13,989 (reported on 1.3% of returns)
Here:
$13,989
Pennsylvania:
$14,674
(% of AGI for various income ranges: 0.1% for AGIs $25k-50k, 0.2% for AGIs $50k-75k, 0.2% for AGIs $75k-100k, 0.6% for AGIs over 100k)
Total itemized deductions: $18,789 (18% of AGI, reported on 34.7% of returns)
Here:
$18,789
State:
$18,804
Here:
18.5% of AGI
State:
19.5% of AGI
(% of AGI for various income ranges: 14.6% for AGIs below $10k, 10.4% for AGIs $10k-25k, 10.7% for AGIs $25k-50k, 13.9% for AGIs $50k-75k, 14.7% for AGIs $75k-100k, 12.2% for AGIs over 100k)
Charity contributions deductions: $4,126 (4% of AGI, reported on 29.8% of returns)
Here:
$4,126
State:
$3,337
Here:
3.8% of AGI
State:
3.3% of AGI
(% of AGI for various income ranges: 0.8% for AGIs below $10k, 1.2% for AGIs $10k-25k, 1.8% for AGIs $25k-50k, 2.1% for AGIs $50k-75k, 2.6% for AGIs $75k-100k, 2.8% for AGIs over 100k)
Total tax: $9,440 (reported on 75.0% of returns)
17837:
$9,440
State:
$8,008
(% of AGI for various income ranges: 2.8% for AGIs below $10k, 4.5% for AGIs $10k-25k, 7.4% for AGIs $25k-50k, 9.2% for AGIs $50k-75k, 10.6% for AGIs $75k-100k, 20.2% for AGIs over 100k)
Earned income credit: $1,419 (reported on 8.7% of returns)
Here:
$1,419
State:
$1,643
Percentage of individuals using paid preparers for their 2004 taxes: 58.9%
Here:
59%
State:
56%
(% for various income ranges: 53.1% for AGIs below $10k, 59.1% for AGIs $10k-25k, 61.7% for AGIs $25k-50k, 59.3% for AGIs $50k-75k, 54.3% for AGIs $75k-100k, 69.0% for AGIs over 100k)
Likely homosexual households (counted as self-reported same-sex unmarried-partner households)
Lesbian couples: 0.4% of all households
Gay men: 0.3% of all households
Household received Food Stamps/SNAP in the past 12 months: 854 Household did not receive Food Stamps/SNAP in the past 12 months: 5,431
Women who had a birth in the past 12 months: 146 (150 now married, 5 unmarried) Women who did not have a birth in the past 12 months: 3,967 (1,153 now married, 2,828 unmarried)
Housing units in zip code 17837 with a mortgage: 2,095 (262 second mortgage, 246 both second mortgage and home equity loan) Houses without a mortgage: 242
Median monthly owner costs for units with a mortgage: $1,619 Median monthly owner costs for units without a mortgage: $574
Residents with income below the poverty level in 2022:
This zip code:
11.4%
Whole state:
11.8%
Residents with income below 50% of the poverty level in 2022:
This zip code:
8.1%
Whole state:
6.1%
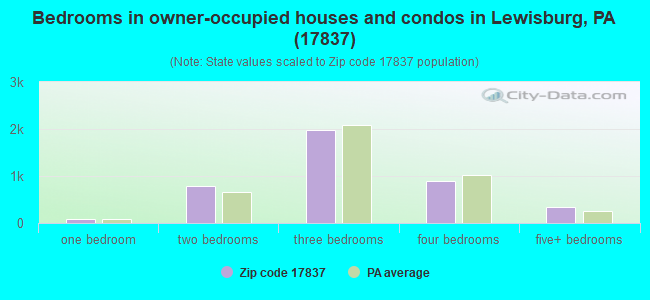
Median number of rooms in houses and condos:
Here:
7.0
State:
6.8
Median number of rooms in apartments:
Here:
4.3
State:
4.3
Notable locations in this zip code not listed on our city pages
Notable locations in zip code 17837: Colonial Crest Golf Course (A), Bucknell University Golf Course (B), Northeast Federal Penitentiary (C), Art Barn Complex (D), Gateway Residence Center (E), Ziegler Health Center (F), Weis Music Building (G), Weis Center (H), Vaughan Literature Building (I), Tustin Building (J), Tau Kappa Epsilon (K), Spratt House (L), Sojka Pavilion (M), Sigma Phi Epsilon (N), Sigma Chi (O), Sigma Alpha Epsilon (P), Rush H Kress Hall (Q), Rooke Chemistry Building (R), Robert and Margaret Farrell Smith Hall (S), President's House-Bucknell University (T). Display/hide their locations on the map
Churches in zip code 17837 include: Union Church (A), United Church (B), Rooke Chapel (C), Saint Johns Church of Christ (D), Reformed Baptist Church (E), Lewisburg Assembley of God Church (F), Old Order Mennonite Church (G), Lewisburg Alliance Church (H), Shady Grove Christian Church (I). Display/hide their locations on the map
Streams, rivers, and creeks: Muddy Run (A), Spruce Run (B), Little Buffalo Creek (C), Limestone Run (D), Mill Race (E), Black Run (F), Beaver Run (G). Display/hide their locations on the map
In group quarters: 5,389 (-1 institutionalized population)
Size of family households: 2,127 2-persons, 734 3-persons, 419 4-persons, 293 5-persons, 67 6-persons, 29 7-or-more-persons
Size of nonfamily households: 2,318 1-person, 296 2-persons, 19 3-persons
2,308 married couples with children.
257 single-parent households (63 men, 194 women).
89.1% of residents of 17837 zip code speak English at home.
5.4% of residents speak Spanish at home (58% very well, 20% well, 20% not well, 2% not at all).
3.3% of residents speak other Indo-European language at home (61% very well, 35% well, 4% not well).
1.4% of residents speak Asian or Pacific Island language at home (53% very well, 47% well).
1.0% of residents speak other language at home (78% very well, 22% well).
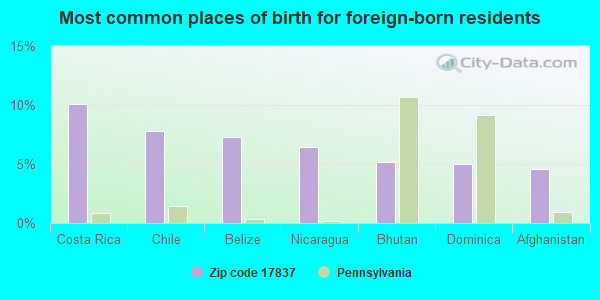
Foreign born population: 737 (4.0%) (44.0% of them are naturalized citizens)
Facilities with environmental interests located in this zip code:
B Z MOTORS CP (2015 MARKET ST in LEWISBURG, PA)
AIR MINOR (AIRS/AFS) STATE MASTER (Pennsylvania database) - RCRIS-PAD987398195, HAZARDOUS WASTE PROGRAM Conditionally Exempt Small Quantity Generators, less than 100 kg/month of hazardous waste (Resource Conservation and Recovery Act (tracking hazardous waste)) - notification Business SIC classification: GENERAL AUTOMOTIVE REPAIR SHOPS; AUTOMOTIVE REPAIR SHOPS Organizations: AIKEY ROGER (CONTACT/OWNER)
B Z MOTORS (625 N DERR DRIVE RT 15 in LEWISBURG, PA)
STATE MASTER (Pennsylvania database) - RCRIS-PAD981739485, HAZARDOUS WASTE PROGRAM Conditionally Exempt Small Quantity Generators, less than 100 kg/month of hazardous waste (Resource Conservation and Recovery Act (tracking hazardous waste)) - notification Business NAICS classification: ALL OTHER AUTOMOTIVE REPAIR AND MAINTENANCE. Organizations: OPERNAME (CONTACT/OPERATOR)
, BZ MOTORS OLDS-PONTIAC-GMC (CONTACT/OWNER)
Alternative names: BZ MOTORS OLDS-PONTIAC-GMC
BEAVER RUN SCHOOL (RD 2 in LEWISBURG, PA)
(Integrated Compliance Information System) - ICIS-03-1989-0875, FORMAL ENFORCEMENT ACTION COMPLIANCE ACTIVITY (Tracking inspections of insecticide, fungicide, and rodenticide, and toxic substances)
AUTO M.D. (1205 BULLALO RD. in LEWISBURG, PA)
AIR MINOR (AIRS/AFS) Business SIC classification: AUTOMOTIVE REPAIR SHOPS
BISON MOTORS (532 N. DERR DRIVE in LEWISBURG, PA)
AIR MINOR (AIRS/AFS) Business SIC classification: MOTOR VEHICLE DEALERS (NEW AND USED)
B Z MOTORS BODY SHOP (2040 WEST MARKET ST in LEWISBURG, PA)
Conditionally Exempt Small Quantity Generators, less than 100 kg/month of hazardous waste (Resource Conservation and Recovery Act (tracking hazardous waste)) - notification Business NAICS classification: AUTOMOTIVE BODY, PAINT, AND INTERIOR REPAIR AND MAINTENANCE. Organizations: B Z MOTORS C P INC (CONTACT/OWNER)
Housing units lacking complete plumbing facilities: 2.1% Housing units lacking complete kitchen facilities: 5.1%
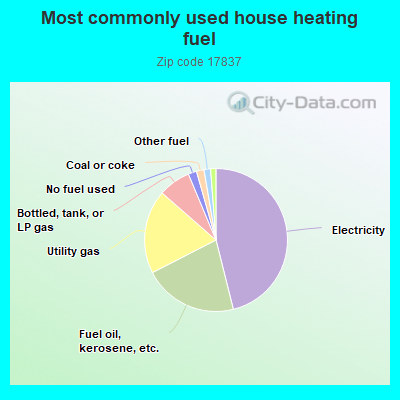
46.2%Electricity
21.4%Fuel oil, kerosene, etc.
19.0%Utility gas
7.3%Bottled, tank, or LP gas
1.9%No fuel used
1.7%Coal or coke
1.5%Other fuel
1.2%Wood
Population in 1990: 18,821.
Place of birth for U.S.-born residents:
This state: 10,432
Northeast: 3,847
Midwest: 946
South: 1,755
West: 781
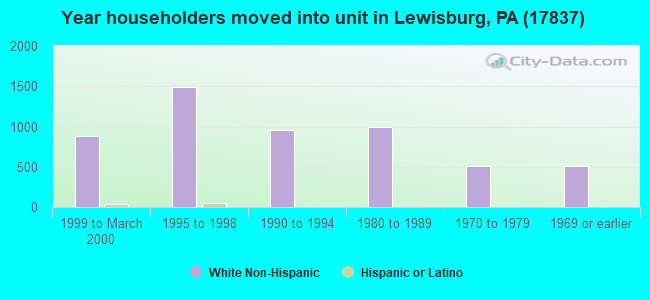
52% of the 17837 zip code residents lived in the same house 5 years ago. Out of people who lived in different houses, 24% lived in this county. Out of people who lived in different counties, 50% lived in Pennsylvania.
85% of the 17837 zip code residents lived in the same house 1 year ago. Out of people who lived in different houses, 26% moved from this county. Out of people who lived in different houses, 44% moved from different county within same state. Out of people who lived in different houses, 26% moved from different state. Out of people who lived in different houses, 3% moved from abroad.
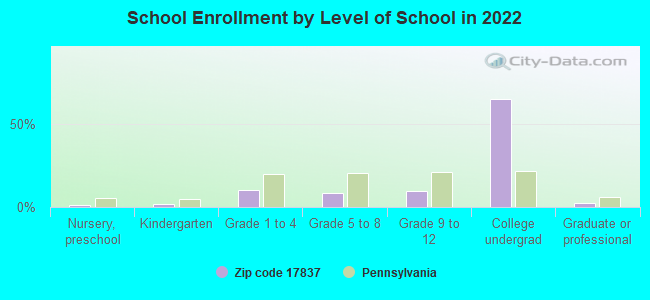
Private vs. public school enrollment:
Students in private schools in grades 1 to 8 (elementary and middle school): 183
Here:
16.1%
Pennsylvania:
15.7%
Students in private schools in grades 9 to 12 (high school): 50
Here:
8.5%
Pennsylvania:
13.4%
Students in private undergraduate colleges: 3,780
Here:
95.5%
Pennsylvania:
39.8%
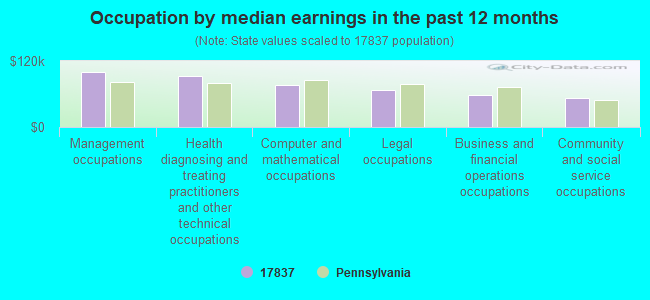
Occupation by median earnings in the past 12 months ($)
99,326Management occupations
92,362Health diagnosing and treating practitioners and other technical occupations
76,881Computer and mathematical occupations
67,042Legal occupations
58,655Business and financial operations occupations
52,863Community and social service occupations
Top industries in this zip code by the number of employees in 2005:
Health Care and Social Assistance: General Medical and Surgical Hospitals (over 1000 employees: 1 establishment, 5-9 employees: 1 establishment)
Educational Services: Colleges, Universities, and Professional Schools (over 1000: 1)
Health Care and Social Assistance: Offices of Physicians (except Mental Health Specialists) (100-249: 1, 50-99: 2, 20-49: 3, 10-19: 6, 5-9: 13, 1-4: 5)
Health Care and Social Assistance: Continuing Care Retirement Communities (250-499: 1, 20-49: 1)
Accommodation and Food Services: Food Service Contractors (100-249: 1, 20-49: 1, 1-4: 2)
People in group quarters in 2010:
2,815 people in college/university student housing
1,774 people in federal prisons
318 people in nursing facilities/skilled-nursing facilities
34 people in local jails and other municipal confinement facilities
20 people in residential treatment centers for juveniles (non-correctional)
People in group quarters in 2000:
2,684 people in college dormitories (includes college quarters off campus)
1,611 people in federal prisons and detention centers
422 people in nursing homes
31 people in local jails and other confinement facilities (including police lockups)
22 people in other noninstitutional group quarters
17 people in homes for the mentally retarded
2 people in religious group quarters
Fatal accident statistics in 2014:
Fatal accident count: 2
Vehicles involved in fatal accidents: 2
Fatal accidents caused by drunken drivers: 1
Fatalities: 2
Persons involved in fatal accidents: 2
Pedestrians involved in fatal accidents: 0
Fatal accident statistics in 2013:
Fatal accident count: 1
Vehicles involved in fatal accidents: 5
Fatal accidents caused by drunken drivers: 0
Fatalities: 1
Persons involved in fatal accidents: 6
Pedestrians involved in fatal accidents: 0
2006 - 2018 National Fire Incident Reporting System (NFIRS) incidents
Based on the data from the years 2006 - 2018 the average number of fire incidents per year is 22. The highest number of fires - 57 took place in 2016, and the least - 0 in 2013. The data has a growing trend.
When looking into fire subcategories, the most incidents belonged to: Structure Fires (60.1%), and Outside Fires (19.2%).
Fire incident types reported to NFIRS in Zip Code 17837


 Nearest zip codes: 17886, 17855, 17850, 17856, 17889, 17847.


 Based on the data from the years 2006 - 2018 the average number of fire incidents per year is 22. The highest number of fires - 57 took place in 2016, and the least - 0 in 2013. The data has a growing trend.
 When looking into fire subcategories, the most incidents belonged to: Structure Fires (60.1%), and Outside Fires (19.2%).