Estimated zip code population in 2022: 3,461 Zip code population in 2010: 3,091 Zip code population in 2000: 3,085
Houses and condos: 1,458 Renter-occupied apartments: 69
% of renters here:
5%
State:
31%
March 2022 cost of living index in zip code 18038: 99.9 (near average, U.S. average is 100)
Land area: 13.0 sq. mi. Water area: 0.3 sq. mi.
Population density: 266 people per square mile
(very low).
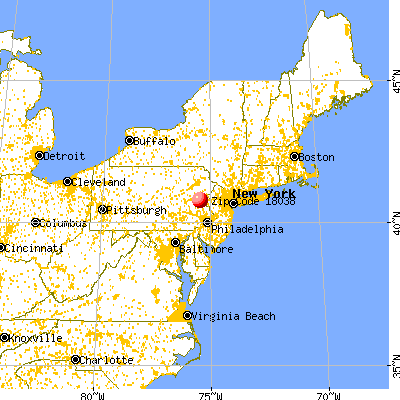
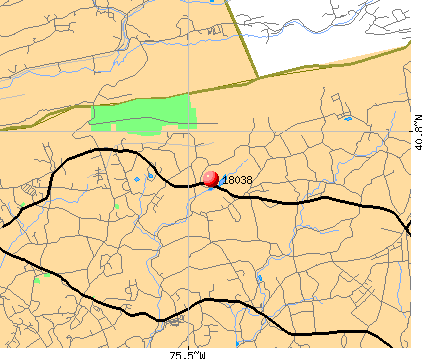
OSM Map
General Map
Google Map
MSN Map
OSM Map
General Map
Google Map
MSN Map
OSM Map
General Map
Google Map
MSN Map
OSM Map
General Map
Google Map
MSN Map
Please wait while loading the map...
Real estate property taxes paid for housing units in 2022:
This zip code:
1.6% ($3,913)
Pennsylvania:
1.3% ($3,094)
Median real estate property taxes paid for housing units with mortgages in 2022: $4,800 (1.6%) Median real estate property taxes paid for housing units with no mortgage in 2022: $3,594 (2.3%)
Business Search- 14 Million verified businesses
Males: 1,889
(54.6%)
Females: 1,571
(45.4%)
For population 25 years and over in 18038:
High school or higher: 95.4%
Bachelor's degree or higher: 18.2%
Graduate or professional degree: 4.2%
Unemployed: 2.8%
Mean travel time to work (commute): 27.9 minutes
For population 15 years and over in 18038:
Never married: 31.6%
Now married: 57.0%
Separated: 2.1%
Widowed: 6.5%
Divorced: 2.8%
Zip code 18038 compared to state average:
Black race population percentage significantly below state average.
Hispanic race population percentage significantly below state average.
Median age above state average.
Foreign-born population percentage significantly below state average.
Renting percentage significantly below state average.
Length of stay since moving in significantly above state average.
Percentage of population with a bachelor's degree or higher below state average.
Estimated median house/condo value in 2022: $240,508
18038:
$240,508
Pennsylvania:
$245,500
Median resident age:
This zip code:
48.3 years
Pennsylvania median age:
40.9 years
Average household size:
This zip code:
2.4 people
Pennsylvania:
2.4 people
Averages for the 2020 tax year for zip code 18038, filed in 2021:
Average Adjusted Gross Income (AGI) in 2020: $69,261 (Individual Income Tax Returns)
Here:
$69,261
State:
$75,707
Salary/wage: $62,686 (reported on 79.5% of returns)
Here:
$62,686
State:
$62,806
(% of AGI for various income ranges: 1044.1% for AGIs below $25k, 3325.8% for AGIs $25k-50k, 6230.0% for AGIs $50k-75k, 8710.0% for AGIs $75k-100k, 17905.0% for AGIs $100k-200k, 43010.0% for AGIs over 200k)
Taxable interest for individuals: $716 (reported on 33.1% of returns)
This zip code:
$716
Pennsylvania:
$1,633
(% of AGI for various income ranges: 28.5% for AGIs below $25k, 22.7% for AGIs $25k-50k, 35.7% for AGIs $50k-75k, 57.3% for AGIs $75k-100k, 34.4% for AGIs $100k-200k, 116.7% for AGIs over 200k)
Ordinary dividends: $2,785 (reported on 24.1% of returns)
Here:
$2,785
State:
$7,382
(% of AGI for various income ranges: 66.3% for AGIs below $25k, 76.5% for AGIs $25k-50k, 37.1% for AGIs $50k-75k, 156.0% for AGIs $75k-100k, 114.4% for AGIs $100k-200k, 726.7% for AGIs over 200k)
Net capital gain/loss in AGI: +$7,959 (reported on 19.3% of returns)
Here:
+$7,959
State:
+$23,522
(% of AGI for various income ranges: 37.7% for AGIs $25k-50k, 66.2% for AGIs $50k-75k, 60.0% for AGIs $75k-100k, 328.9% for AGIs $100k-200k, 5466.7% for AGIs over 200k)
Profit/loss from business: +$10,156 (reported on 10.8% of returns)
Here:
+$10,156
State:
+$16,274
(% of AGI for various income ranges: 73.3% for AGIs below $25k, 125.0% for AGIs $25k-50k, 182.9% for AGIs $50k-75k, 143.3% for AGIs $75k-100k, 392.2% for AGIs $100k-200k)
Taxable individual retirement arrangement distribution: $16,468 (reported on 11.4% of returns)
18038:
$16,468
Pennsylvania:
$18,583
(% of AGI for various income ranges: 99.6% for AGIs below $25k, 146.2% for AGIs $25k-50k, 305.2% for AGIs $50k-75k, 414.0% for AGIs $75k-100k, 676.7% for AGIs $100k-200k)
Total itemized deductions: $24,273 (reported on 6.6% of returns)
Here:
$24,273
State:
$34,850
(% of AGI for various income ranges: 457.6% for AGIs $50k-75k, 312.0% for AGIs $75k-100k, 689.4% for AGIs $100k-200k)
Charity contributions: $3,978 (reported on 5.4% of returns)
Here:
$3,978
State:
$12,392
(% of AGI for various income ranges: 42.4% for AGIs $50k-75k, 149.4% for AGIs $100k-200k)
Taxes paid: $7,891 (reported on 6.6% of returns)
18038:
$7,891
State:
$8,200
(% of AGI for various income ranges: 138.6% for AGIs $50k-75k, 112.7% for AGIs $75k-100k, 226.7% for AGIs $100k-200k)
Earned income credit: $1,867 (reported on 7.2% of returns)
Here:
$1,867
State:
$2,100
(% of AGI for various income ranges: 46.7% for AGIs below $25k, 37.7% for AGIs $25k-50k)
Percentage of individuals using paid preparers for their 2020 taxes: 91.0%
Here:
91%
State:
92%
(% for various income ranges: 89.1% for AGIs below $25k, 91.4% for AGIs $25k-50k, 92.9% for AGIs $50k-75k, 95.0% for AGIs $75k-100k, 87.1% for AGIs $100k-200k, 100.0% for AGIs over 200k)
Averages for the 2012 tax year for zip code 18038, filed in 2013:
Average Adjusted Gross Income (AGI) in 2012: $53,213 (Individual Income Tax Returns)
Here:
$53,213
State:
$61,346
Salary/wage: $49,841 (reported on 82.9% of returns)
Here:
$49,841
State:
$51,902
(% of AGI for various income ranges: 65.9% for AGIs below $25k, 74.5% for AGIs $25k-50k, 80.2% for AGIs $50k-75k, 79.7% for AGIs $75k-100k, 78.3% for AGIs $100k-200k)
Taxable interest for individuals: $707 (reported on 38.6% of returns)
This zip code:
$707
Pennsylvania:
$1,588
(% of AGI for various income ranges: 2.2% for AGIs below $25k, 0.8% for AGIs $25k-50k, 0.5% for AGIs $50k-75k, 0.4% for AGIs $75k-100k, 0.2% for AGIs $100k-200k)
Ordinary dividends: $1,863 (reported on 25.9% of returns)
Here:
$1,863
State:
$5,827
(% of AGI for various income ranges: 2.5% for AGIs below $25k, 1.5% for AGIs $25k-50k, 0.6% for AGIs $50k-75k, 0.7% for AGIs $75k-100k, 0.7% for AGIs $100k-200k)
Net capital gain/loss in AGI: +$940 (reported on 15.8% of returns)
Here:
+$940
State:
+$14,495
(% of AGI for various income ranges: 0.8% for AGIs $50k-75k, 0.3% for AGIs $75k-100k, 0.3% for AGIs $100k-200k)
Profit/loss from business: +$9,385 (reported on 12.7% of returns)
Here:
+$9,385
State:
+$16,268
(% of AGI for various income ranges: 4.0% for AGIs below $25k, 3.4% for AGIs $25k-50k, 1.5% for AGIs $50k-75k, 2.5% for AGIs $75k-100k, 1.7% for AGIs $100k-200k)
Taxable individual retirement arrangement distribution: $11,724 (reported on 10.8% of returns)
18038:
$11,724
Pennsylvania:
$14,550
(% of AGI for various income ranges: 3.8% for AGIs below $25k, 2.0% for AGIs $25k-50k, 2.2% for AGIs $50k-75k, 2.9% for AGIs $75k-100k, 2.0% for AGIs $100k-200k)
Total itemized deductions: $19,300 (23% of AGI, reported on 39.2% of returns)
Here:
$19,300
State:
$23,538
Here:
23.2% of AGI
State:
18.4% of AGI
(% of AGI for various income ranges: 14.5% for AGIs below $25k, 12.1% for AGIs $25k-50k, 13.9% for AGIs $50k-75k, 14.4% for AGIs $75k-100k, 15.2% for AGIs $100k-200k)
Charity contributions: $1,654 (reported on 31.6% of returns)
Here:
$1,654
State:
$4,025
(% of AGI for various income ranges: 0.8% for AGIs below $25k, 0.7% for AGIs $25k-50k, 0.9% for AGIs $50k-75k, 1.0% for AGIs $75k-100k, 1.2% for AGIs $100k-200k)
Taxes paid: $7,877 (reported on 39.2% of returns)
18038:
$7,877
State:
$9,982
(% of AGI for various income ranges: 3.9% for AGIs below $25k, 3.9% for AGIs $25k-50k, 5.8% for AGIs $50k-75k, 5.6% for AGIs $75k-100k, 7.1% for AGIs $100k-200k)
Earned income credit: $1,553 (reported on 9.5% of returns)
Here:
$1,553
State:
$2,106
(% of AGI for various income ranges: 3.0% for AGIs below $25k, 0.6% for AGIs $25k-50k)
Percentage of individuals using paid preparers for their 2012 taxes: 56.3%
Here:
56%
State:
53%
(% for various income ranges: 52.9% for AGIs below $25k, 54.5% for AGIs $25k-50k, 60.0% for AGIs $50k-75k, 59.1% for AGIs $75k-100k, 59.1% for AGIs $100k-200k)
Averages for the 2004 tax year for zip code 18038, filed in 2005:
Average Adjusted Gross Income (AGI) in 2004: $43,980 (Individual Income Tax Returns)
Here:
$43,980
State:
$48,049
Salary/wage: $42,435 (reported on 88.0% of returns)
Here:
$42,435
State:
$42,646
(% of AGI for various income ranges: 95.1% for AGIs below $10k, 68.2% for AGIs $10k-25k, 85.7% for AGIs $25k-50k, 89.8% for AGIs $50k-75k, 88.2% for AGIs $75k-100k, 78.2% for AGIs over 100k)
Taxable interest for individuals: $507 (reported on 57.5% of returns)
This zip code:
$507
Pennsylvania:
$1,657
(% of AGI for various income ranges: 3.6% for AGIs below $10k, 1.6% for AGIs $10k-25k, 1.0% for AGIs $25k-50k, 0.3% for AGIs $50k-75k, 0.2% for AGIs $75k-100k, 0.8% for AGIs over 100k)
Taxable dividends: $1,076 (reported on 28.8% of returns)
Here:
$1,076
State:
$3,566
(% of AGI for various income ranges: 3.1% for AGIs below $10k, 1.4% for AGIs $10k-25k, 0.6% for AGIs $25k-50k, 0.3% for AGIs $50k-75k, 0.4% for AGIs $75k-100k, 1.3% for AGIs over 100k)
Net capital gain/loss: +$4,237 (reported on 16.1% of returns)
Here:
+$4,237
State:
+$9,716
(% of AGI for various income ranges: 3.0% for AGIs below $10k, -0.2% for AGIs $10k-25k, 0.4% for AGIs $25k-50k, 0.6% for AGIs $50k-75k, 1.2% for AGIs $75k-100k, 5.2% for AGIs over 100k)
Profit/loss from business: +$8,133 (reported on 14.3% of returns)
Here:
+$8,133
State:
+$14,267
(% of AGI for various income ranges: 8.1% for AGIs below $10k, 10.8% for AGIs $10k-25k, 4.0% for AGIs $25k-50k, 2.2% for AGIs $50k-75k, 1.4% for AGIs $75k-100k, -0.1% for AGIs over 100k)
IRA payment deduction: $2,723 (reported on 3.2% of returns)
18038:
$2,723
Pennsylvania:
$2,903
Total itemized deductions: $15,318 (22% of AGI, reported on 39.1% of returns)
Here:
$15,318
State:
$18,804
Here:
22.4% of AGI
State:
19.5% of AGI
(% of AGI for various income ranges: 10.1% for AGIs $10k-25k, 12.6% for AGIs $25k-50k, 14.1% for AGIs $50k-75k, 16.9% for AGIs $75k-100k, 12.4% for AGIs over 100k)
Charity contributions deductions: $1,572 (2% of AGI, reported on 34.3% of returns)
Here:
$1,572
State:
$3,337
Here:
2.2% of AGI
State:
3.3% of AGI
(% of AGI for various income ranges: 0.8% for AGIs $10k-25k, 1.0% for AGIs $25k-50k, 1.2% for AGIs $50k-75k, 1.4% for AGIs $75k-100k, 1.6% for AGIs over 100k)
Total tax: $5,052 (reported on 80.2% of returns)
18038:
$5,052
State:
$8,008
(% of AGI for various income ranges: 3.9% for AGIs below $10k, 5.7% for AGIs $10k-25k, 7.1% for AGIs $25k-50k, 8.0% for AGIs $50k-75k, 9.7% for AGIs $75k-100k, 14.7% for AGIs over 100k)
Earned income credit: $1,510 (reported on 6.7% of returns)
Here:
$1,510
State:
$1,643
Percentage of individuals using paid preparers for their 2004 taxes: 54.5%
Here:
55%
State:
56%
(% for various income ranges: 42.9% for AGIs below $10k, 52.3% for AGIs $10k-25k, 57.6% for AGIs $25k-50k, 62.9% for AGIs $50k-75k, 55.2% for AGIs $75k-100k, 53.3% for AGIs over 100k)
Household received Food Stamps/SNAP in the past 12 months: 26 Household did not receive Food Stamps/SNAP in the past 12 months: 1,395
Women who had a birth in the past 12 months: 8 (8 now married, 0 unmarried) Women who did not have a birth in the past 12 months: 690 (420 now married, 265 unmarried)
Housing units in zip code 18038 with a mortgage: 707 (65 second mortgage, 60 both second mortgage and home equity loan) Houses without a mortgage: 56
Median monthly owner costs for units with a mortgage: $1,911 Median monthly owner costs for units without a mortgage: $621
Residents with income below the poverty level in 2022:
This zip code:
1.8%
Whole state:
11.8%
Residents with income below 50% of the poverty level in 2022:
This zip code:
1.1%
Whole state:
6.1%
Median number of rooms in houses and condos:
Here:
6.2
State:
6.8
Median number of rooms in apartments:
Here:
6.0
State:
4.3
Notable locations in this zip code not listed on our city pages
Size of family households: 469 2-persons, 232 3-persons, 287 4-persons, 23 5-persons
Size of nonfamily households: 361 1-person, 49 2-persons
208 married couples with children.
31 single-parent households (31 women).
96.3% of residents of 18038 zip code speak English at home.
2.1% of residents speak other Indo-European language at home (100% very well).
0.2% of residents speak Asian or Pacific Island language at home (100% very well).
0.4% of residents speak other language at home (100% very well).
Foreign born population: 58 (1.7%) (86.2% of them are naturalized citizens)
This zip code:
1.7%
Whole state:
7.5%
34%Denmark
22%France
12%Ireland
12%Italy
9%Hong Kong
42%German
14%Pennsylvania German
13%American
13%Irish
6%Italian
2%Ukrainian
1%Lithuanian
Year of entry for the foreign-born population
92010 or later
02000 to 2009
131990 to 1999
30Before 1990
Facilities with environmental interests located in this zip code:
BUCHA, PAUL (1215 N MINK RD in DANIELSVILLE, PA)
(Integrated Compliance Information System) - ICIS-03-2002-0020, FORMAL ENFORCEMENT ACTION, ICIS-03-2002-0058, ENFORCEMENT/COMPLIANCE ACTIVITY (Integrated Compliance Information System) Business SIC classification: PRIVATE HOUSEHOLDS Alternative names: PAUL BUCHA
Housing units lacking complete kitchen facilities: 1.1%
67.0%Fuel oil, kerosene, etc.
13.0%Electricity
8.4%Bottled, tank, or LP gas
8.4%Wood
1.4%Utility gas
1.1%Other fuel
0.9%Coal or coke
Population in 1990: 2,004. Population change in the 1990s: +1,081 (+53.9%).
Place of birth for U.S.-born residents:
This state: 3,084
Northeast: 166
South: 125
77% of the 18038 zip code residents lived in the same house 5 years ago. Out of people who lived in different houses, 57% lived in this county. Out of people who lived in different counties, 50% lived in Pennsylvania.
100% of the 18038 zip code residents lived in the same house 1 year ago.
Private vs. public school enrollment:
Students in private schools in grades 1 to 8 (elementary and middle school): 17
Here:
31.6%
Pennsylvania:
15.7%
Students in private schools in grades 9 to 12 (high school):
Here:
0.0%
Pennsylvania:
13.4%
Students in private undergraduate colleges: 17
Here:
5.7%
Pennsylvania:
39.8%
Occupation by median earnings in the past 12 months ($)
130,617Architecture and engineering occupations
126,618Management occupations
83,260Education, training, and library occupations
78,448Transportation occupations
71,410Health diagnosing and treating practitioners and other technical occupations
62,729Business and financial operations occupations
Companies with federal contracts located in this zip code:
SHOCK SOLUTIONS, INC (3807 CINNAMON DR in DANIELSVILLE, PA; small business) : $203,935 in 4 contractsfrom 2005 to 2006
$158,030 with Defense Logistics Agency for Hardware, Weapon System. Signed on 2006-02-17. Completion date: 2007-03-22.
$22,050, same as above.Signed on 2005-11-12. Completion date: 2005-12-27.
$12,680, same as above.Signed on 2005-08-13. Completion date: 2005-11-09.
$11,175 with Navy for ADP Components. Signed on 2006-05-26. Completion date: 2006-07-05.
Top industries in this zip code by the number of employees in 2005:
Accommodation and Food Services: Full-Service Restaurants (20-49 employees: 1 establishment)
Construction: Poured Concrete Foundation and Structure Contractors (10-19: 1, 5-9: 1, 1-4: 1)
Accommodation and Food Services: Limited-Service Restaurants (10-19: 1)
Construction: Masonry Contractors (10-19: 1)
Health Care and Social Assistance: Offices of Physicians (except Mental Health Specialists) (10-19: 1)
Administrative and Support and Waste Management and Remediation Services: Landscaping Services (5-9: 1, 1-4: 1)
Construction: Commercial and Institutional Building Construction (5-9: 1)
People in group quarters in 2000:
18 people in other noninstitutional group quarters
Fatal accident statistics in 2014:
Fatal accident count: 1
Vehicles involved in fatal accidents: 1
Fatal accidents caused by drunken drivers: 0
Fatalities: 1
Persons involved in fatal accidents: 1
Pedestrians involved in fatal accidents: 0
Home Mortgage Disclosure Act Aggregated Statistics For Year 2009 (Based on 4 partial tracts)
A) FHA, FSA/RHS & VA Home Purchase Loans
B) Conventional Home Purchase Loans
C) Refinancings
D) Home Improvement Loans
F) Non-occupant Loans on < 5 Family Dwellings (A B C & D)
G) Loans On Manufactured Home Dwelling (A B C & D)
Number
Average Value
Number
Average Value
Number
Average Value
Number
Average Value
Number
Average Value
Number
Average Value
LOANS ORIGINATED
27
$203,720
40
$160,726
238
$178,005
41
$90,002
3
$82,440
11
$86,868
APPLICATIONS APPROVED, NOT ACCEPTED
3
$110,810
5
$122,434
16
$175,862
5
$26,130
1
$141,980
3
$69,940
APPLICATIONS DENIED
4
$126,050
7
$125,520
89
$198,062
13
$55,838
1
$103,510
3
$96,733
APPLICATIONS WITHDRAWN
6
$178,312
3
$170,897
38
$204,133
5
$182,256
2
$191,185
0
$0
FILES CLOSED FOR INCOMPLETENESS
1
$238,630
0
$0
8
$238,296
1
$45,460
0
$0
1
$90,920
Aggregated Statistics For Year 2008 (Based on 4 partial tracts)
A) FHA, FSA/RHS & VA Home Purchase Loans
B) Conventional Home Purchase Loans
C) Refinancings
D) Home Improvement Loans
F) Non-occupant Loans on < 5 Family Dwellings (A B C & D)
G) Loans On Manufactured Home Dwelling (A B C & D)
Number
Average Value
Number
Average Value
Number
Average Value
Number
Average Value
Number
Average Value
Number
Average Value
LOANS ORIGINATED
16
$204,288
46
$196,515
153
$167,651
56
$58,478
4
$302,588
4
$128,340
APPLICATIONS APPROVED, NOT ACCEPTED
1
$238,630
4
$185,845
28
$142,267
6
$24,803
2
$261,375
2
$54,945
APPLICATIONS DENIED
2
$251,475
3
$107,473
89
$178,518
15
$55,159
2
$155,615
7
$102,000
APPLICATIONS WITHDRAWN
1
$346,900
6
$147,332
35
$183,345
6
$55,527
0
$0
2
$77,500
FILES CLOSED FOR INCOMPLETENESS
0
$0
2
$226,605
6
$243,927
2
$39,925
0
$0
0
$0
Aggregated Statistics For Year 2007 (Based on 4 partial tracts)
A) FHA, FSA/RHS & VA Home Purchase Loans
B) Conventional Home Purchase Loans
C) Refinancings
D) Home Improvement Loans
F) Non-occupant Loans on < 5 Family Dwellings (A B C & D)
G) Loans On Manufactured Home Dwelling (A B C & D)
Number
Average Value
Number
Average Value
Number
Average Value
Number
Average Value
Number
Average Value
Number
Average Value
LOANS ORIGINATED
3
$240,360
95
$196,237
192
$135,382
80
$60,711
6
$294,447
13
$76,979
APPLICATIONS APPROVED, NOT ACCEPTED
0
$0
13
$175,612
32
$132,868
17
$63,769
1
$20,980
2
$120,850
APPLICATIONS DENIED
0
$0
15
$210,241
89
$186,917
33
$96,352
1
$87,420
9
$63,501
APPLICATIONS WITHDRAWN
0
$0
13
$207,567
35
$186,404
6
$101,782
0
$0
1
$31,470
FILES CLOSED FOR INCOMPLETENESS
0
$0
3
$278,827
19
$229,593
1
$49,660
0
$0
0
$0
Aggregated Statistics For Year 2006 (Based on 4 partial tracts)
A) FHA, FSA/RHS & VA Home Purchase Loans
B) Conventional Home Purchase Loans
C) Refinancings
D) Home Improvement Loans
E) Loans on Dwellings For 5+ Families
F) Non-occupant Loans on < 5 Family Dwellings (A B C & D)
G) Loans On Manufactured Home Dwelling (A B C & D)
Number
Average Value
Number
Average Value
Number
Average Value
Number
Average Value
Number
Average Value
Number
Average Value
Number
Average Value
LOANS ORIGINATED
2
$280,475
122
$184,765
225
$132,384
125
$46,144
0
$0
8
$162,139
13
$72,788
APPLICATIONS APPROVED, NOT ACCEPTED
0
$0
17
$208,832
36
$152,872
12
$79,199
1
$183,940
3
$110,040
5
$61,030
APPLICATIONS DENIED
0
$0
24
$179,115
107
$168,068
28
$74,417
0
$0
5
$122,418
7
$58,104
APPLICATIONS WITHDRAWN
1
$120,300
14
$179,321
69
$153,813
7
$35,977
0
$0
2
$115,825
1
$17,480
FILES CLOSED FOR INCOMPLETENESS
0
$0
3
$201,610
24
$166,779
4
$62,870
0
$0
0
$0
0
$0
Aggregated Statistics For Year 2005 (Based on 4 partial tracts)
A) FHA, FSA/RHS & VA Home Purchase Loans
B) Conventional Home Purchase Loans
C) Refinancings
D) Home Improvement Loans
F) Non-occupant Loans on < 5 Family Dwellings (A B C & D)
G) Loans On Manufactured Home Dwelling (A B C & D)
Number
Average Value
Number
Average Value
Number
Average Value
Number
Average Value
Number
Average Value
Number
Average Value
LOANS ORIGINATED
7
$183,629
144
$174,847
249
$131,306
97
$52,002
10
$165,425
14
$69,219
APPLICATIONS APPROVED, NOT ACCEPTED
0
$0
16
$165,802
63
$126,951
13
$40,279
1
$196,530
2
$98,850
APPLICATIONS DENIED
0
$0
35
$172,528
118
$164,194
25
$46,986
6
$104,300
9
$55,040
APPLICATIONS WITHDRAWN
0
$0
14
$205,506
78
$170,321
10
$68,967
1
$183,560
3
$111,437
FILES CLOSED FOR INCOMPLETENESS
0
$0
7
$175,289
18
$188,317
2
$91,245
0
$0
1
$90,920
Aggregated Statistics For Year 2004 (Based on 4 partial tracts)
A) FHA, FSA/RHS & VA Home Purchase Loans
B) Conventional Home Purchase Loans
C) Refinancings
D) Home Improvement Loans
E) Loans on Dwellings For 5+ Families
F) Non-occupant Loans on < 5 Family Dwellings (A B C & D)
G) Loans On Manufactured Home Dwelling (A B C & D)
Number
Average Value
Number
Average Value
Number
Average Value
Number
Average Value
Number
Average Value
Number
Average Value
Number
Average Value
LOANS ORIGINATED
8
$165,858
140
$172,846
261
$119,620
80
$41,781
2
$82,670
6
$256,073
7
$68,197
APPLICATIONS APPROVED, NOT ACCEPTED
0
$0
14
$181,754
55
$135,667
12
$44,011
0
$0
2
$285,705
1
$133,590
APPLICATIONS DENIED
1
$92,320
17
$170,401
130
$135,667
25
$40,581
2
$123,905
4
$152,295
5
$90,306
APPLICATIONS WITHDRAWN
0
$0
9
$154,386
102
$156,149
5
$72,524
0
$0
2
$135,550
1
$101,410
FILES CLOSED FOR INCOMPLETENESS
0
$0
6
$128,993
23
$143,730
3
$26,617
0
$0
0
$0
0
$0
Aggregated Statistics For Year 2003 (Based on 4 partial tracts)
A) FHA, FSA/RHS & VA Home Purchase Loans
B) Conventional Home Purchase Loans
C) Refinancings
D) Home Improvement Loans
F) Non-occupant Loans on < 5 Family Dwellings (A B C & D)
Number
Average Value
Number
Average Value
Number
Average Value
Number
Average Value
Number
Average Value
LOANS ORIGINATED
4
$162,615
118
$138,337
537
$112,612
58
$38,926
17
$67,492
APPLICATIONS APPROVED, NOT ACCEPTED
0
$0
11
$138,248
67
$118,720
7
$28,407
1
$208,340
APPLICATIONS DENIED
0
$0
13
$95,336
135
$123,824
12
$38,263
3
$82,297
APPLICATIONS WITHDRAWN
0
$0
8
$172,018
112
$140,289
5
$47,278
1
$78,330
FILES CLOSED FOR INCOMPLETENESS
0
$0
2
$156,670
20
$142,344
1
$34,970
0
$0
Aggregated Statistics For Year 2002 (Based on 4 partial tracts)
A) FHA, FSA/RHS & VA Home Purchase Loans
B) Conventional Home Purchase Loans
C) Refinancings
D) Home Improvement Loans
E) Loans on Dwellings For 5+ Families
F) Non-occupant Loans on < 5 Family Dwellings (A B C & D)
Number
Average Value
Number
Average Value
Number
Average Value
Number
Average Value
Number
Average Value
Number
Average Value
LOANS ORIGINATED
9
$147,891
116
$121,644
298
$101,307
59
$34,274
0
$0
23
$71,637
APPLICATIONS APPROVED, NOT ACCEPTED
1
$55,250
11
$86,830
55
$90,676
10
$19,696
0
$0
1
$13,990
APPLICATIONS DENIED
0
$0
14
$66,103
95
$102,966
16
$36,968
1
$585,560
3
$139,743
APPLICATIONS WITHDRAWN
1
$74,840
8
$125,455
68
$119,848
4
$33,210
0
$0
1
$59,450
FILES CLOSED FOR INCOMPLETENESS
0
$0
2
$141,240
17
$148,754
1
$58,750
0
$0
0
$0
Aggregated Statistics For Year 2001 (Based on 4 partial tracts)
A) FHA, FSA/RHS & VA Home Purchase Loans
B) Conventional Home Purchase Loans
C) Refinancings
D) Home Improvement Loans
F) Non-occupant Loans on < 5 Family Dwellings (A B C & D)
Number
Average Value
Number
Average Value
Number
Average Value
Number
Average Value
Number
Average Value
LOANS ORIGINATED
5
$115,998
104
$113,983
222
$99,952
61
$27,346
6
$59,628
APPLICATIONS APPROVED, NOT ACCEPTED
0
$0
6
$130,475
33
$93,490
7
$24,577
1
$123,090
APPLICATIONS DENIED
3
$59,963
25
$73,353
87
$99,137
24
$26,062
3
$158,650
APPLICATIONS WITHDRAWN
0
$0
3
$105,143
50
$97,075
6
$16,158
1
$48,260
FILES CLOSED FOR INCOMPLETENESS
0
$0
0
$0
10
$126,837
0
$0
1
$193,660
Aggregated Statistics For Year 2000 (Based on 4 partial tracts)
A) FHA, FSA/RHS & VA Home Purchase Loans
B) Conventional Home Purchase Loans
C) Refinancings
D) Home Improvement Loans
F) Non-occupant Loans on < 5 Family Dwellings (A B C & D)
Number
Average Value
Number
Average Value
Number
Average Value
Number
Average Value
Number
Average Value
LOANS ORIGINATED
8
$118,298
87
$111,901
97
$74,803
46
$23,889
5
$54,150
APPLICATIONS APPROVED, NOT ACCEPTED
1
$42,660
18
$85,388
27
$76,691
12
$28,733
2
$115,805
APPLICATIONS DENIED
0
$0
29
$75,358
62
$97,332
15
$28,709
4
$104,610
APPLICATIONS WITHDRAWN
1
$53,150
10
$111,334
36
$88,769
7
$73,829
2
$93,370
FILES CLOSED FOR INCOMPLETENESS
1
$59,660
1
$91,780
28
$111,317
0
$0
0
$0
Aggregated Statistics For Year 1999 (Based on 2 partial tracts)
A) FHA, FSA/RHS & VA Home Purchase Loans
B) Conventional Home Purchase Loans
C) Refinancings
D) Home Improvement Loans
F) Non-occupant Loans on < 5 Family Dwellings (A B C & D)


 Nearest zip codes: 18035, 18088, 18071, 18067, 18014, 18086.


