Estimated zip code population in 2022: 3,147 Zip code population in 2010: 2,662 Zip code population in 2000: 2,384
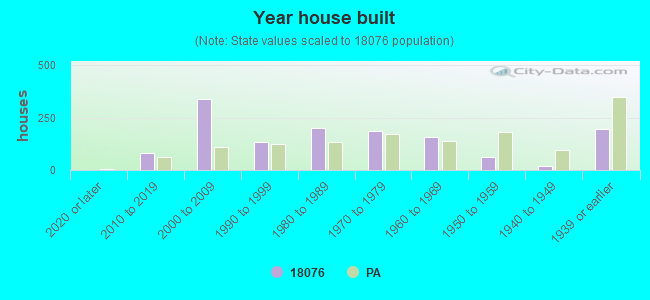
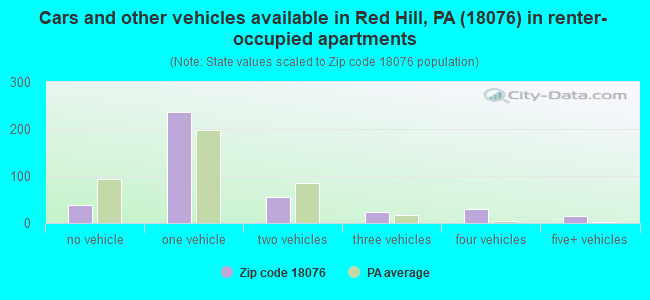
Houses and condos: 1,361 Renter-occupied apartments: 394
% of renters here:
30%
State:
31%
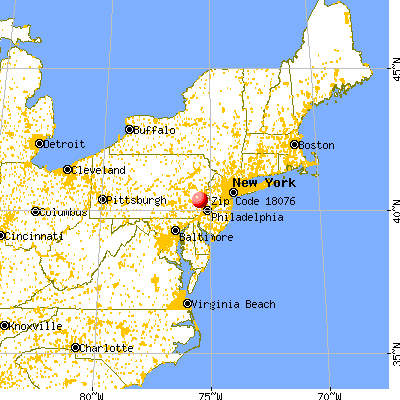
March 2022 cost of living index in zip code 18076: 101.8 (near average, U.S. average is 100)
Land area: 1.2 sq. mi. Water area: 0.0 sq. mi.
Population density: 2,622 people per square mile
(average).
OSM Map
General Map
Google Map
MSN Map
OSM Map
General Map
Google Map
MSN Map
OSM Map
General Map
Google Map
MSN Map
OSM Map
General Map
Google Map
MSN Map
Please wait while loading the map...
Real estate property taxes paid for housing units in 2022:
This zip code:
1.4% ($3,570)
Pennsylvania:
1.3% ($3,094)
Median real estate property taxes paid for housing units with mortgages in 2022: $4,061 (1.5%) Median real estate property taxes paid for housing units with no mortgage in 2022: $2,843 (1.4%)
Business Search- 14 Million verified businesses
Males: 1,589
(50.5%)
Females: 1,558
(49.5%)
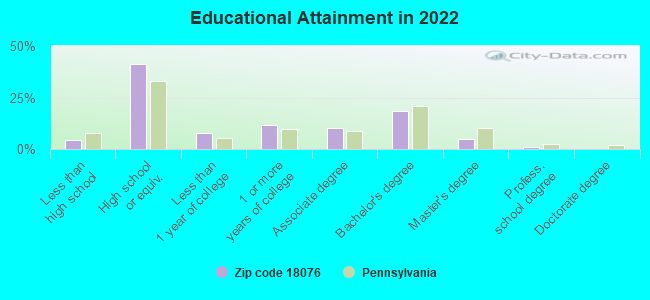
For population 25 years and over in 18076:
High school or higher: 94.7%
Bachelor's degree or higher: 23.8%
Graduate or professional degree: 5.5%
Unemployed: 3.7%
Mean travel time to work (commute): 27.6 minutes
For population 15 years and over in 18076:
Never married: 30.4%
Now married: 46.4%
Separated: 1.6%
Widowed: 7.9%
Divorced: 13.7%
Zip code 18076 compared to state average:
Foreign-born population percentage significantly below state average.
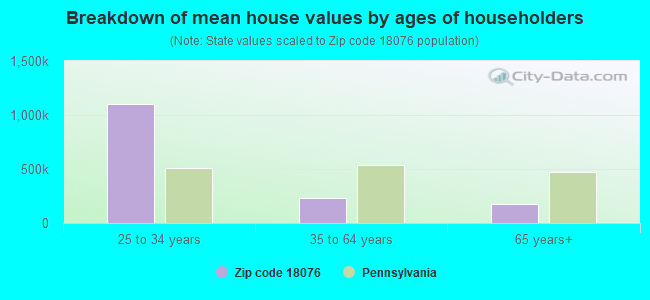
Estimated median house/condo value in 2022: $255,485
18076:
$255,485
Pennsylvania:
$245,500
Median resident age:
This zip code:
42.9 years
Pennsylvania median age:
40.9 years
Average household size:
This zip code:
2.4 people
Pennsylvania:
2.4 people
Averages for the 2020 tax year for zip code 18076, filed in 2021:
Average Adjusted Gross Income (AGI) in 2020: $61,016 (Individual Income Tax Returns)
Here:
$61,016
State:
$75,707
Salary/wage: $56,695 (reported on 78.7% of returns)
Here:
$56,695
State:
$62,806
(% of AGI for various income ranges: 905.2% for AGIs below $25k, 3630.0% for AGIs $25k-50k, 6294.4% for AGIs $50k-75k, 9497.5% for AGIs $75k-100k, 16142.7% for AGIs $100k-200k)
Taxable interest for individuals: $662 (reported on 34.7% of returns)
This zip code:
$662
Pennsylvania:
$1,633
(% of AGI for various income ranges: 23.9% for AGIs below $25k, 13.9% for AGIs $25k-50k, 35.6% for AGIs $50k-75k, 24.2% for AGIs $75k-100k, 53.3% for AGIs $100k-200k)
Ordinary dividends: $2,214 (reported on 18.7% of returns)
Here:
$2,214
State:
$7,382
(% of AGI for various income ranges: 31.0% for AGIs below $25k, 21.8% for AGIs $25k-50k, 38.9% for AGIs $50k-75k, 84.2% for AGIs $75k-100k, 194.7% for AGIs $100k-200k)
Net capital gain/loss in AGI: +$4,391 (reported on 15.3% of returns)
Here:
+$4,391
State:
+$23,522
(% of AGI for various income ranges: 14.5% for AGIs below $25k, 13.6% for AGIs $25k-50k, 42.2% for AGIs $50k-75k, 14.2% for AGIs $75k-100k, 556.0% for AGIs $100k-200k)
Profit/loss from business: +$8,769 (reported on 10.7% of returns)
Here:
+$8,769
State:
+$16,274
(% of AGI for various income ranges: 90.3% for AGIs below $25k, 40.0% for AGIs $25k-50k, 199.4% for AGIs $50k-75k, 434.7% for AGIs $100k-200k)
Taxable individual retirement arrangement distribution: $12,248 (reported on 15.3% of returns)
18076:
$12,248
Pennsylvania:
$18,583
(% of AGI for various income ranges: 144.8% for AGIs below $25k, 146.1% for AGIs $25k-50k, 373.9% for AGIs $50k-75k, 416.7% for AGIs $75k-100k, 524.0% for AGIs $100k-200k)
Total itemized deductions: $22,875 (reported on 8.0% of returns)
Here:
$22,875
State:
$34,850
(% of AGI for various income ranges: 151.9% for AGIs below $25k, 220.6% for AGIs $50k-75k, 577.5% for AGIs $75k-100k, 789.3% for AGIs $100k-200k)
Charity contributions: $6,543 (reported on 4.7% of returns)
Here:
$6,543
State:
$12,392
(% of AGI for various income ranges: 77.2% for AGIs $50k-75k, 212.7% for AGIs $100k-200k)
Taxes paid: $7,058 (reported on 8.0% of returns)
18076:
$7,058
State:
$8,200
(% of AGI for various income ranges: 41.9% for AGIs below $25k, 83.9% for AGIs $50k-75k, 174.2% for AGIs $75k-100k, 238.0% for AGIs $100k-200k)
Earned income credit: $1,857 (reported on 9.3% of returns)
Here:
$1,857
State:
$2,100
(% of AGI for various income ranges: 51.0% for AGIs below $25k, 36.4% for AGIs $25k-50k)
Percentage of individuals using paid preparers for their 2020 taxes: 91.3%
Here:
91%
State:
92%
(% for various income ranges: 89.4% for AGIs below $25k, 91.7% for AGIs $25k-50k, 91.7% for AGIs $50k-75k, 94.1% for AGIs $75k-100k, 91.3% for AGIs $100k-200k, 100.0% for AGIs over 200k)
Averages for the 2012 tax year for zip code 18076, filed in 2013:
Average Adjusted Gross Income (AGI) in 2012: $49,365 (Individual Income Tax Returns)
Here:
$49,365
State:
$61,346
Salary/wage: $48,162 (reported on 82.1% of returns)
Here:
$48,162
State:
$51,902
(% of AGI for various income ranges: 62.1% for AGIs below $25k, 77.0% for AGIs $25k-50k, 81.6% for AGIs $50k-75k, 88.9% for AGIs $75k-100k, 80.6% for AGIs $100k-200k)
Taxable interest for individuals: $417 (reported on 37.2% of returns)
This zip code:
$417
Pennsylvania:
$1,588
(% of AGI for various income ranges: 1.4% for AGIs below $25k, 0.4% for AGIs $25k-50k, 0.2% for AGIs $50k-75k, 0.1% for AGIs $75k-100k, 0.2% for AGIs $100k-200k)
Ordinary dividends: $1,220 (reported on 20.7% of returns)
Here:
$1,220
State:
$5,827
(% of AGI for various income ranges: 1.8% for AGIs below $25k, 0.6% for AGIs $25k-50k, 0.2% for AGIs $50k-75k, 0.2% for AGIs $75k-100k, 0.4% for AGIs $100k-200k)
Net capital gain/loss in AGI: +$3,228 (reported on 12.4% of returns)
Here:
+$3,228
State:
+$14,495
(% of AGI for various income ranges: 2.5% for AGIs $100k-200k)
Profit/loss from business: +$8,012 (reported on 11.7% of returns)
Here:
+$8,012
State:
+$16,268
(% of AGI for various income ranges: 4.9% for AGIs below $25k, 3.9% for AGIs $25k-50k, 2.4% for AGIs $50k-75k, 0.7% for AGIs $75k-100k, 0.5% for AGIs $100k-200k)
Taxable individual retirement arrangement distribution: $10,923 (reported on 15.2% of returns)
18076:
$10,923
Pennsylvania:
$14,550
(% of AGI for various income ranges: 8.0% for AGIs below $25k, 3.4% for AGIs $25k-50k, 5.7% for AGIs $50k-75k, 2.8% for AGIs $100k-200k)
Total itemized deductions: $17,479 (22% of AGI, reported on 36.6% of returns)
Here:
$17,479
State:
$23,538
Here:
21.6% of AGI
State:
18.4% of AGI
(% of AGI for various income ranges: 9.6% for AGIs below $25k, 13.2% for AGIs $25k-50k, 12.9% for AGIs $50k-75k, 14.3% for AGIs $75k-100k, 12.9% for AGIs $100k-200k)
Charity contributions: $2,044 (reported on 26.9% of returns)
Here:
$2,044
State:
$4,025
(% of AGI for various income ranges: 0.5% for AGIs below $25k, 0.9% for AGIs $25k-50k, 1.0% for AGIs $50k-75k, 1.4% for AGIs $75k-100k, 1.3% for AGIs $100k-200k)
Taxes paid: $6,749 (reported on 36.6% of returns)
18076:
$6,749
State:
$9,982
(% of AGI for various income ranges: 2.6% for AGIs below $25k, 3.9% for AGIs $25k-50k, 4.4% for AGIs $50k-75k, 6.0% for AGIs $75k-100k, 5.9% for AGIs $100k-200k)
Earned income credit: $2,036 (reported on 9.7% of returns)
Here:
$2,036
State:
$2,106
(% of AGI for various income ranges: 3.2% for AGIs below $25k, 0.5% for AGIs $25k-50k)
Percentage of individuals using paid preparers for their 2012 taxes: 53.8%
Here:
54%
State:
53%
(% for various income ranges: 50.0% for AGIs below $25k, 52.9% for AGIs $25k-50k, 54.5% for AGIs $50k-75k, 56.2% for AGIs $75k-100k, 64.7% for AGIs $100k-200k)
Averages for the 2004 tax year for zip code 18076, filed in 2005:
Average Adjusted Gross Income (AGI) in 2004: $40,647 (Individual Income Tax Returns)
Here:
$40,647
State:
$48,049
Salary/wage: $39,256 (reported on 83.7% of returns)
Here:
$39,256
State:
$42,646
(% of AGI for various income ranges: 70.8% for AGIs below $10k, 66.5% for AGIs $10k-25k, 80.8% for AGIs $25k-50k, 86.9% for AGIs $50k-75k, 87.7% for AGIs $75k-100k, 73.6% for AGIs over 100k)
Taxable interest for individuals: $1,047 (reported on 51.6% of returns)
This zip code:
$1,047
Pennsylvania:
$1,657
(% of AGI for various income ranges: 6.1% for AGIs below $10k, 3.7% for AGIs $10k-25k, 1.6% for AGIs $25k-50k, 0.6% for AGIs $50k-75k, 1.1% for AGIs $75k-100k, 0.5% for AGIs over 100k)
Taxable dividends: $1,345 (reported on 27.5% of returns)
Here:
$1,345
State:
$3,566
(% of AGI for various income ranges: 5.1% for AGIs below $10k, 2.4% for AGIs $10k-25k, 0.9% for AGIs $25k-50k, 0.2% for AGIs $50k-75k, 1.2% for AGIs $75k-100k, 0.4% for AGIs over 100k)
Net capital gain/loss: +$1,518 (reported on 17.0% of returns)
Here:
+$1,518
State:
+$9,716
(% of AGI for various income ranges: -4.1% for AGIs below $10k, 0.2% for AGIs $10k-25k, 0.1% for AGIs $25k-50k, 0.1% for AGIs $50k-75k, 2.3% for AGIs $75k-100k, 0.9% for AGIs over 100k)
Profit/loss from business: +$13,567 (reported on 11.5% of returns)
Here:
+$13,567
State:
+$14,267
(% of AGI for various income ranges: 5.9% for AGIs below $10k, 4.8% for AGIs $10k-25k, 2.1% for AGIs $25k-50k, 2.3% for AGIs $50k-75k, 0.8% for AGIs $75k-100k, 10.5% for AGIs over 100k)
IRA payment deduction: $2,829 (reported on 2.7% of returns)
18076:
$2,829
Pennsylvania:
$2,903
Total itemized deductions: $14,909 (22% of AGI, reported on 36.0% of returns)
Here:
$14,909
State:
$18,804
Here:
22.3% of AGI
State:
19.5% of AGI
(% of AGI for various income ranges: 15.0% for AGIs below $10k, 11.7% for AGIs $10k-25k, 10.9% for AGIs $25k-50k, 15.1% for AGIs $50k-75k, 14.9% for AGIs $75k-100k, 12.3% for AGIs over 100k)
Charity contributions deductions: $1,918 (3% of AGI, reported on 31.6% of returns)
Here:
$1,918
State:
$3,337
Here:
2.8% of AGI
State:
3.3% of AGI
(% of AGI for various income ranges: 1.2% for AGIs $10k-25k, 1.2% for AGIs $25k-50k, 1.4% for AGIs $50k-75k, 1.7% for AGIs $75k-100k, 2.1% for AGIs over 100k)
Total tax: $5,052 (reported on 78.0% of returns)
18076:
$5,052
State:
$8,008
(% of AGI for various income ranges: 2.2% for AGIs below $10k, 4.5% for AGIs $10k-25k, 7.5% for AGIs $25k-50k, 8.6% for AGIs $50k-75k, 9.9% for AGIs $75k-100k, 17.0% for AGIs over 100k)
Earned income credit: $1,333 (reported on 7.6% of returns)
Here:
$1,333
State:
$1,643
Percentage of individuals using paid preparers for their 2004 taxes: 60.3%
Here:
60%
State:
56%
(% for various income ranges: 52.8% for AGIs below $10k, 62.0% for AGIs $10k-25k, 61.8% for AGIs $25k-50k, 65.3% for AGIs $50k-75k, 55.1% for AGIs $75k-100k, 68.1% for AGIs over 100k)
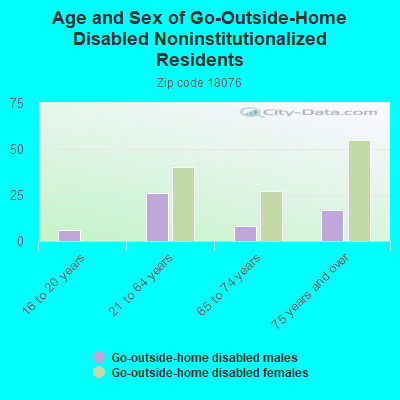
In group quarters: 4 (-1 institutionalized population)
Size of family households: 309 2-persons, 178 3-persons, 201 4-persons, 49 5-persons, 21 6-persons, 32 7-or-more-persons
Size of nonfamily households: 445 1-person, 63 2-persons
450 married couples with children.
145 single-parent households (39 men, 106 women).
95.0% of residents of 18076 zip code speak English at home.
2.3% of residents speak Spanish at home (56% very well, 31% well, 11% not well, 1% not at all).
0.7% of residents speak other Indo-European language at home (100% well).
0.2% of residents speak Asian or Pacific Island language at home (100% well).
1.6% of residents speak other language at home (100% very well).
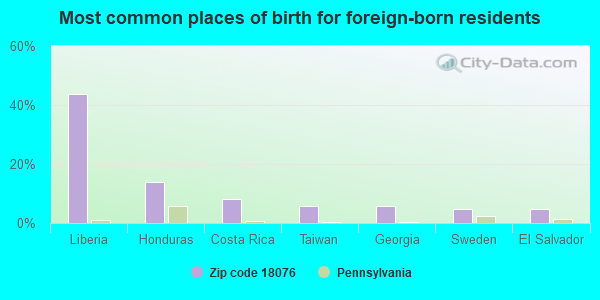
Foreign born population: 88 (2.8%) (98.9% of them are naturalized citizens)
This zip code:
2.8%
Whole state:
7.5%
44%Liberia
14%Honduras
8%Costa Rica
6%Taiwan
6%Georgia
5%Sweden
5%El Salvador
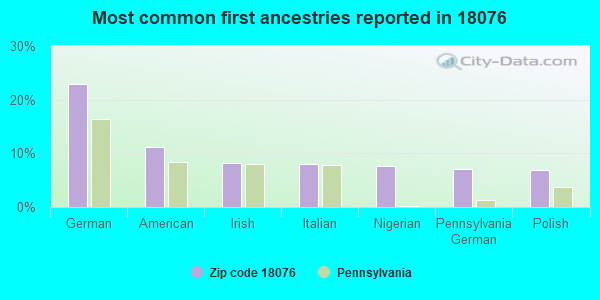
23%German
11%American
8%Irish
8%Italian
8%Nigerian
7%Pennsylvania German
7%Polish
Year of entry for the foreign-born population
82010 or later
492000 to 2009
41990 to 1999
38Before 1990
Facilities with environmental interests located in this zip code:
ARTISAN DISPLAY INC (1239 JAMES ROAD in RED HILL, PA)
Small Quantity Generators, between 100 kg and 1000 kg of hazardous waste/month (Resource Conservation and Recovery Act (tracking hazardous waste)) - notification Business NAICS classification: INSTITUTIONAL FURNITURE MANUFACTURING. Organizations: WASSMER JOHN (CONTACT/OWNER)
Housing units lacking complete plumbing facilities: 1.2%
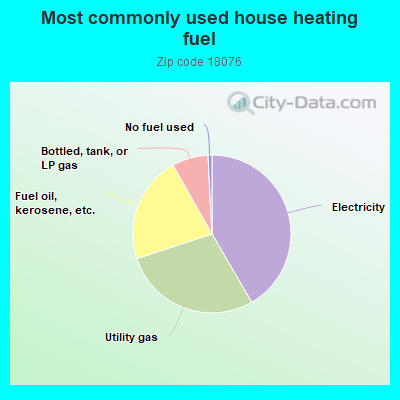
41.7%Electricity
28.4%Utility gas
21.9%Fuel oil, kerosene, etc.
7.4%Bottled, tank, or LP gas
0.8%No fuel used
Population in 1990: 1,807. Population change in the 1990s: +577 (+31.9%).
Place of birth for U.S.-born residents:
This state: 2,649
Northeast: 135
Midwest: 99
South: 88
West: 50
63% of the 18076 zip code residents lived in the same house 5 years ago. Out of people who lived in different houses, 67% lived in this county. Out of people who lived in different counties, 50% lived in Pennsylvania.
94% of the 18076 zip code residents lived in the same house 1 year ago. Out of people who lived in different houses, 65% moved from this county. Out of people who lived in different houses, 18% moved from different county within same state. Out of people who lived in different houses, 18% moved from different state.
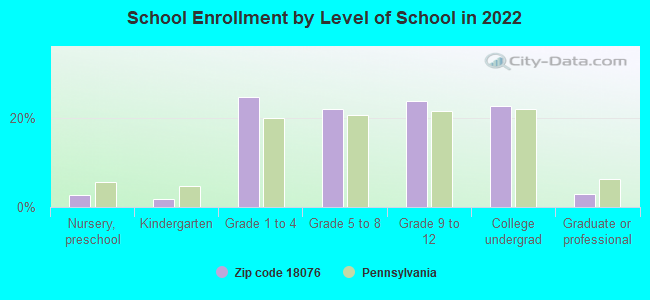
Private vs. public school enrollment:
Students in private schools in grades 1 to 8 (elementary and middle school): 72
Here:
20.4%
Pennsylvania:
15.7%
Students in private schools in grades 9 to 12 (high school): 27
Here:
15.3%
Pennsylvania:
13.4%
Students in private undergraduate colleges: 88
Here:
51.3%
Pennsylvania:
39.8%
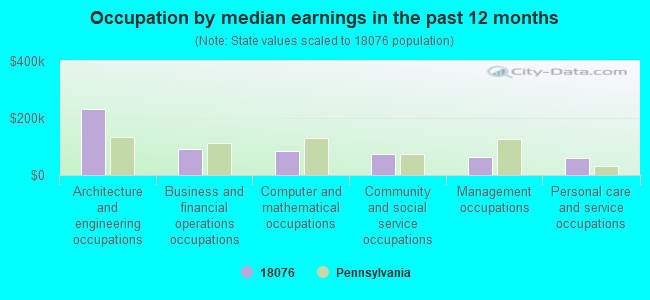
Occupation by median earnings in the past 12 months ($)
232,843Architecture and engineering occupations
92,056Business and financial operations occupations
83,377Computer and mathematical occupations
74,608Community and social service occupations
63,618Management occupations
58,566Personal care and service occupations
Companies with federal contracts located in this zip code:
HELIX, INC (4TH & ADAMS STS in RED HILL, PA; small business) : $912,447 in 43 contractsfrom 2000 to 2006
Contracts for Valves, Nonpowered, Valves, Powered, Submarines, Nuts and Washers by Navy Signed by year:2000: $77,052; 2001: $209,542; 2002: $120,283; 2003: $127,498; 2004: $108,581; 2005: $135,272; 2006: $134,219.
Biggest contracts:
$78,406 with Navy for Valves, Nonpowered. Signed on 2004-07-22. Completion date: 2005-01-22.
$75,143 with Navy for Valves, Powered. Signed on 2001-04-25. Completion date: 2001-07-01.
$64,043 with Navy for Valves, Nonpowered. Signed on 2006-03-26. Completion date: 2006-08-18.
$49,273, same as above.Signed on 2000-08-15. Completion date: 2001-02-12.
Top industries in this zip code by the number of employees in 2005:
Wholesale Trade: Medical, Dental, and Hospital Equipment and Supplies Merchant Wholesalers (100-249 employees: 1 establishment)
Other Services (except Public Administration): Religious Organizations (20-49: 1, 1-4: 1)
Health Care and Social Assistance: Offices of Dentists (20-49: 1)
Construction: Plumbing, Heating, and Air-Conditioning Contractors (10-19: 1, 1-4: 1)
Home Mortgage Disclosure Act Aggregated Statistics For Year 2009 (Based on 2 full tracts)
A) FHA, FSA/RHS & VA Home Purchase Loans
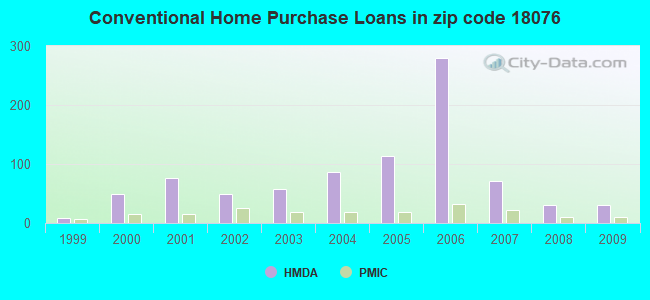
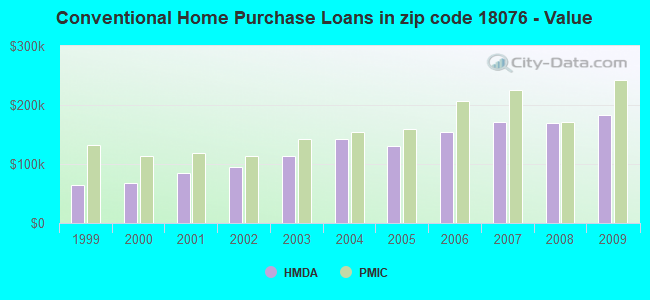
B) Conventional Home Purchase Loans
C) Refinancings
D) Home Improvement Loans
F) Non-occupant Loans on < 5 Family Dwellings (A B C & D)
G) Loans On Manufactured Home Dwelling (A B C & D)
Number
Average Value
Number
Average Value
Number
Average Value
Number
Average Value
Number
Average Value
Number
Average Value
LOANS ORIGINATED
22
$196,400
30
$183,132
109
$163,633
14
$51,556
8
$193,620
6
$59,652
APPLICATIONS APPROVED, NOT ACCEPTED
2
$186,910
0
$0
14
$148,846
0
$0
0
$0
2
$105,385
APPLICATIONS DENIED
2
$150,125
4
$163,545
26
$190,504
4
$74,068
0
$0
2
$23,860
APPLICATIONS WITHDRAWN
2
$362,885
0
$0
28
$173,133
2
$109,360
0
$0
0
$0
FILES CLOSED FOR INCOMPLETENESS
0
$0
0
$0
0
$0
0
$0
0
$0
0
$0
Aggregated Statistics For Year 2008 (Based on 2 full tracts)
A) FHA, FSA/RHS & VA Home Purchase Loans
B) Conventional Home Purchase Loans
C) Refinancings
D) Home Improvement Loans
F) Non-occupant Loans on < 5 Family Dwellings (A B C & D)
G) Loans On Manufactured Home Dwelling (A B C & D)
Number
Average Value
Number
Average Value
Number
Average Value
Number
Average Value
Number
Average Value
Number
Average Value
LOANS ORIGINATED
28
$195,929
30
$169,611
70
$146,289
14
$50,136
6
$184,922
4
$102,900
APPLICATIONS APPROVED, NOT ACCEPTED
0
$0
4
$177,465
10
$181,143
2
$25,850
2
$188,900
2
$71,580
APPLICATIONS DENIED
0
$0
6
$97,432
34
$176,149
6
$20,547
4
$154,100
8
$82,270
APPLICATIONS WITHDRAWN
0
$0
0
$0
10
$194,267
2
$9,940
0
$0
2
$9,940
FILES CLOSED FOR INCOMPLETENESS
0
$0
0
$0
0
$0
0
$0
0
$0
0
$0
Aggregated Statistics For Year 2007 (Based on 2 full tracts)
A) FHA, FSA/RHS & VA Home Purchase Loans
B) Conventional Home Purchase Loans
C) Refinancings
D) Home Improvement Loans
F) Non-occupant Loans on < 5 Family Dwellings (A B C & D)
G) Loans On Manufactured Home Dwelling (A B C & D)
Number
Average Value
Number
Average Value
Number
Average Value
Number
Average Value
Number
Average Value
Number
Average Value
LOANS ORIGINATED
6
$206,462
72
$170,561
113
$121,627
32
$31,379
16
$160,688
4
$20,878
APPLICATIONS APPROVED, NOT ACCEPTED
0
$0
8
$72,080
32
$151,056
6
$36,453
2
$242,585
2
$37,780
APPLICATIONS DENIED
0
$0
16
$119,801
76
$191,122
12
$34,466
4
$36,785
8
$52,941
APPLICATIONS WITHDRAWN
0
$0
0
$0
36
$155,151
2
$1,990
0
$0
0
$0
FILES CLOSED FOR INCOMPLETENESS
0
$0
6
$142,502
14
$165,464
0
$0
2
$238,610
0
$0
Aggregated Statistics For Year 2006 (Based on 2 full tracts)
A) FHA, FSA/RHS & VA Home Purchase Loans
B) Conventional Home Purchase Loans
C) Refinancings
D) Home Improvement Loans
F) Non-occupant Loans on < 5 Family Dwellings (A B C & D)
G) Loans On Manufactured Home Dwelling (A B C & D)
Number
Average Value
Number
Average Value
Number
Average Value
Number
Average Value
Number
Average Value
Number
Average Value
LOANS ORIGINATED
10
$191,284
280
$154,626
103
$113,802
42
$48,669
97
$154,829
8
$56,670
APPLICATIONS APPROVED, NOT ACCEPTED
0
$0
14
$85,644
22
$170,822
4
$42,252
6
$146,478
4
$32,312
APPLICATIONS DENIED
0
$0
24
$130,820
62
$138,835
18
$33,803
2
$237,615
2
$34,795
APPLICATIONS WITHDRAWN
0
$0
20
$122,883
40
$144,109
8
$91,218
6
$179,950
0
$0
FILES CLOSED FOR INCOMPLETENESS
0
$0
4
$195,858
10
$167,821
0
$0
0
$0
0
$0
Aggregated Statistics For Year 2005 (Based on 2 full tracts)
A) FHA, FSA/RHS & VA Home Purchase Loans
B) Conventional Home Purchase Loans
C) Refinancings
D) Home Improvement Loans
E) Loans on Dwellings For 5+ Families
F) Non-occupant Loans on < 5 Family Dwellings (A B C & D)
G) Loans On Manufactured Home Dwelling (A B C & D)
Number
Average Value
Number
Average Value
Number
Average Value
Number
Average Value
Number
Average Value
Number
Average Value
Number
Average Value
LOANS ORIGINATED
2
$128,250
113
$130,742
139
$117,788
30
$56,471
2
$994,200
12
$121,955
6
$53,687
APPLICATIONS APPROVED, NOT ACCEPTED
0
$0
10
$134,416
14
$127,684
4
$35,295
0
$0
4
$118,310
6
$77,878
APPLICATIONS DENIED
0
$0
20
$121,193
68
$128,778
12
$44,407
0
$0
0
$0
4
$82,518
APPLICATIONS WITHDRAWN
0
$0
10
$155,692
34
$159,715
10
$56,272
0
$0
4
$217,730
0
$0
FILES CLOSED FOR INCOMPLETENESS
0
$0
4
$104,390
30
$133,090
0
$0
0
$0
0
$0
0
$0
Aggregated Statistics For Year 2004 (Based on 2 full tracts)
A) FHA, FSA/RHS & VA Home Purchase Loans
B) Conventional Home Purchase Loans
C) Refinancings
D) Home Improvement Loans
F) Non-occupant Loans on < 5 Family Dwellings (A B C & D)
G) Loans On Manufactured Home Dwelling (A B C & D)
Number
Average Value
Number
Average Value
Number
Average Value
Number
Average Value
Number
Average Value
Number
Average Value
LOANS ORIGINATED
6
$157,415
87
$142,296
143
$114,229
30
$39,635
10
$126,661
0
$0
APPLICATIONS APPROVED, NOT ACCEPTED
0
$0
10
$89,478
24
$122,121
2
$129,245
2
$15,905
2
$19,885
APPLICATIONS DENIED
2
$210,770
0
$0
52
$116,283
26
$25,008
2
$2,985
4
$43,745
APPLICATIONS WITHDRAWN
0
$0
8
$133,222
46
$112,690
4
$23,362
0
$0
4
$85,998
FILES CLOSED FOR INCOMPLETENESS
0
$0
0
$0
2
$95,445
2
$121,290
0
$0
0
$0
Aggregated Statistics For Year 2003 (Based on 2 full tracts)
A) FHA, FSA/RHS & VA Home Purchase Loans
B) Conventional Home Purchase Loans
C) Refinancings
D) Home Improvement Loans
F) Non-occupant Loans on < 5 Family Dwellings (A B C & D)
Number
Average Value
Number
Average Value
Number
Average Value
Number
Average Value
Number
Average Value
LOANS ORIGINATED
12
$130,903
58
$114,024
237
$102,625
38
$31,762
8
$103,149
APPLICATIONS APPROVED, NOT ACCEPTED
2
$128,250
6
$91,798
34
$93,162
4
$122,288
6
$91,798
APPLICATIONS DENIED
2
$159,070
2
$56,670
64
$120,081
16
$26,222
0
$0
APPLICATIONS WITHDRAWN
0
$0
2
$225,685
46
$107,330
4
$21,872
0
$0
FILES CLOSED FOR INCOMPLETENESS
0
$0
0
$0
6
$135,873
4
$32,312
0
$0
Aggregated Statistics For Year 2002 (Based on 2 full tracts)
A) FHA, FSA/RHS & VA Home Purchase Loans
B) Conventional Home Purchase Loans
C) Refinancings
D) Home Improvement Loans
F) Non-occupant Loans on < 5 Family Dwellings (A B C & D)
Number
Average Value
Number
Average Value
Number
Average Value
Number
Average Value
Number
Average Value
LOANS ORIGINATED
12
$139,851
50
$94,131
127
$99,404
28
$39,058
6
$98,425
APPLICATIONS APPROVED, NOT ACCEPTED
0
$0
4
$81,525
26
$94,296
4
$12,428
2
$143,165
APPLICATIONS DENIED
0
$0
8
$59,652
26
$73,800
4
$13,422
4
$33,305
APPLICATIONS WITHDRAWN
0
$0
0
$0
36
$100,911
2
$9,940
2
$114,335
FILES CLOSED FOR INCOMPLETENESS
0
$0
0
$0
8
$75,311
2
$10,935
0
$0
Aggregated Statistics For Year 2001 (Based on 2 full tracts)
A) FHA, FSA/RHS & VA Home Purchase Loans
B) Conventional Home Purchase Loans
C) Refinancings
D) Home Improvement Loans
F) Non-occupant Loans on < 5 Family Dwellings (A B C & D)
Number
Average Value
Number
Average Value
Number
Average Value
Number
Average Value
Number
Average Value
LOANS ORIGINATED
14
$119,304
76
$85,554
64
$91,031
24
$16,404
10
$82,320
APPLICATIONS APPROVED, NOT ACCEPTED
0
$0
4
$21,375
10
$77,548
0
$0
0
$0
APPLICATIONS DENIED
0
$0
10
$40,365
50
$80,689
6
$10,273
0
$0
APPLICATIONS WITHDRAWN
0
$0
2
$48,715
34
$94,215
2
$995
0
$0
FILES CLOSED FOR INCOMPLETENESS
0
$0
0
$0
6
$81,525
2
$14,915
0
$0
Aggregated Statistics For Year 2000 (Based on 2 full tracts)
A) FHA, FSA/RHS & VA Home Purchase Loans
B) Conventional Home Purchase Loans
C) Refinancings
D) Home Improvement Loans
F) Non-occupant Loans on < 5 Family Dwellings (A B C & D)
Number
Average Value
Number
Average Value
Number
Average Value
Number
Average Value
Number
Average Value
LOANS ORIGINATED
14
$109,788
50
$67,645
34
$70,530
28
$20,523
4
$82,518
APPLICATIONS APPROVED, NOT ACCEPTED
0
$0
2
$79,535
8
$96,686
2
$14,915
0
$0
APPLICATIONS DENIED
4
$102,402
12
$33,637
28
$76,766
12
$27,009
0
$0
APPLICATIONS WITHDRAWN
2
$100,415
6
$107,705
24
$76,388
2
$1,990
2
$191,880
FILES CLOSED FOR INCOMPLETENESS
0
$0
0
$0
2
$24,855
0
$0
0
$0
Aggregated Statistics For Year 1999 (Based on 1 full tract)
A) FHA, FSA/RHS & VA Home Purchase Loans
B) Conventional Home Purchase Loans
C) Refinancings
D) Home Improvement Loans
F) Non-occupant Loans on < 5 Family Dwellings (A B C & D)


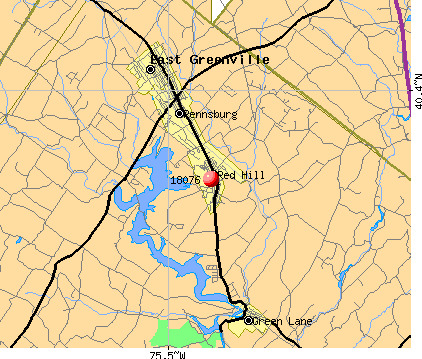 Nearest zip codes: 18073, 18054, 18041, 18074, 18070, 19492.