Estimated zip code population in 2022: 5,995 Zip code population in 2010: 6,017 Zip code population in 2000: 5,970
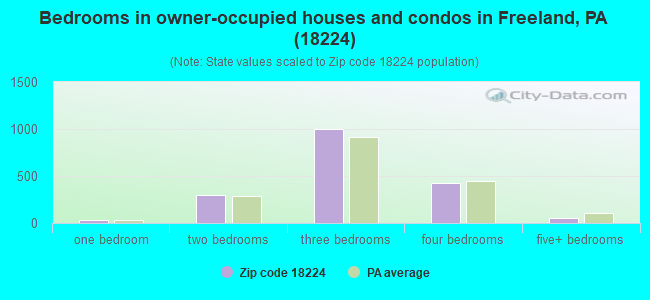
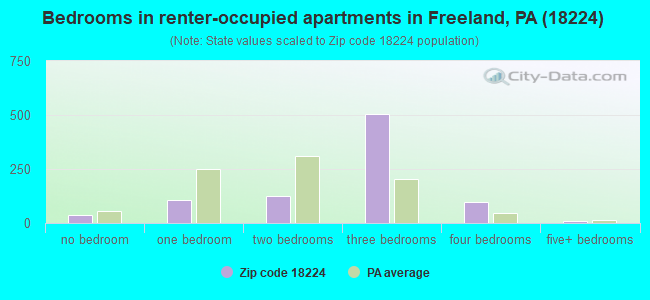
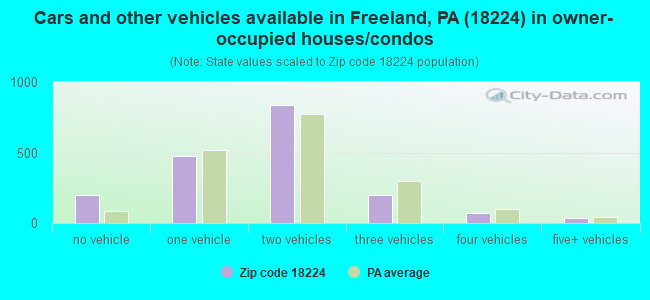
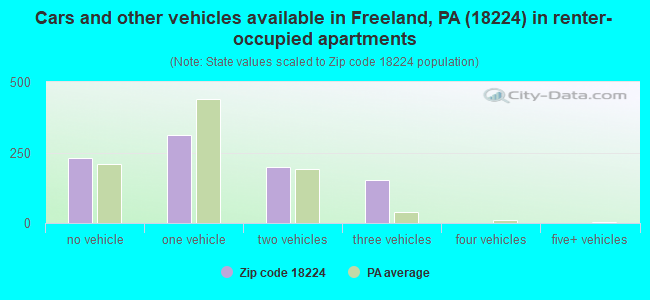
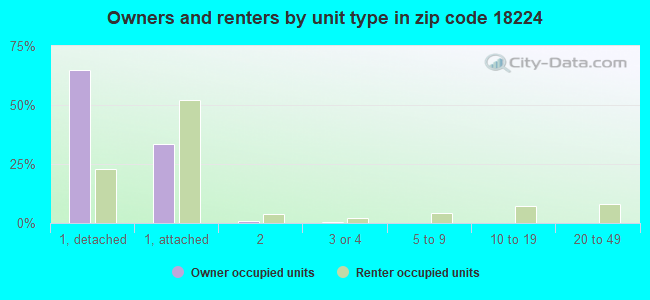
Houses and condos: 3,041 Renter-occupied apartments: 897
% of renters here:
33%
State:
31%
March 2022 cost of living index in zip code 18224: 92.6 (less than average, U.S. average is 100)
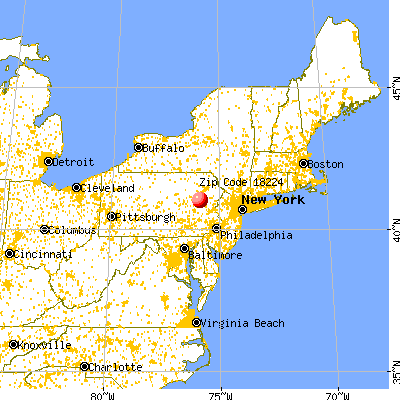
Land area: 15.9 sq. mi. Water area: 0.1 sq. mi.
Population density: 376 people per square mile
(very low).
OSM Map
General Map
Google Map
MSN Map
OSM Map
General Map
Google Map
MSN Map
OSM Map
General Map
Google Map
MSN Map
OSM Map
General Map
Google Map
MSN Map
Please wait while loading the map...
Real estate property taxes paid for housing units in 2022:
This zip code:
1.2% ($1,354)
Pennsylvania:
1.3% ($3,094)
Median real estate property taxes paid for housing units with mortgages in 2022: $1,357 (1.2%) Median real estate property taxes paid for housing units with no mortgage in 2022: $1,351 (1.1%)
Business Search- 14 Million verified businesses
Males: 2,983
(49.8%)
Females: 3,011
(50.2%)
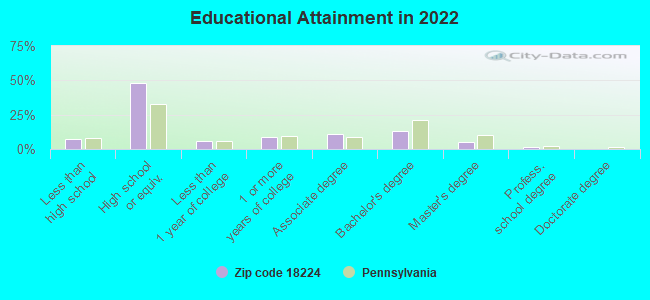
For population 25 years and over in 18224:
High school or higher: 92.0%
Bachelor's degree or higher: 19.4%
Graduate or professional degree: 6.1%
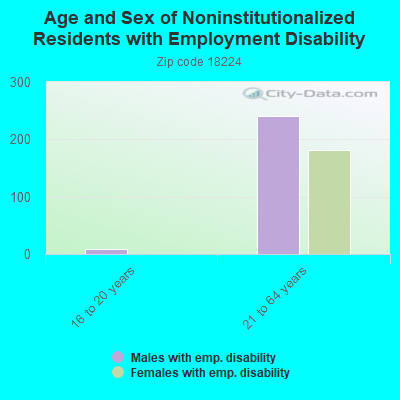
Unemployed: 5.7%
Mean travel time to work (commute): 22.9 minutes
For population 15 years and over in 18224:
Never married: 27.7%
Now married: 51.8%
Separated: 1.4%
Widowed: 12.2%
Divorced: 7.0%
Zip code 18224 compared to state average:
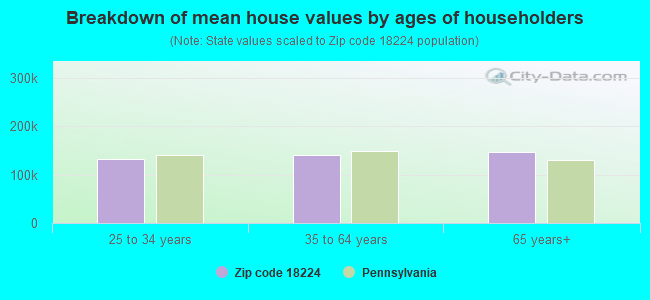
Median house value below state average.
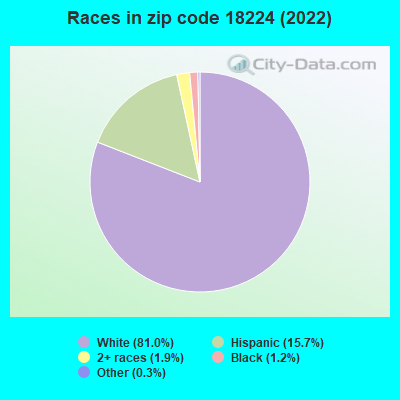
Black race population percentage significantly below state average.
Hispanic race population percentage above state average.
Length of stay since moving in above state average.
Percentage of population with a bachelor's degree or higher below state average.
Estimated median house/condo value in 2022: $115,044
18224:
$115,044
Pennsylvania:
$245,500
According to our research of Pennsylvania and other state lists, there were 6 registered sex offenders living in 18224 zip code as of June 15, 2024. The ratio of all residents to sex offenders in zip code 18224 is 938 to 1. The ratio of registered sex offenders to all residents in this zip code is lower than the state average.
Median resident age:
This zip code:
44.7 years
Pennsylvania median age:
40.9 years
Average household size:
This zip code:
2.2 people
Pennsylvania:
2.4 people
Averages for the 2020 tax year for zip code 18224, filed in 2021:
Average Adjusted Gross Income (AGI) in 2020: $41,345 (Individual Income Tax Returns)
Here:
$41,345
State:
$75,707
Salary/wage: $37,686 (reported on 79.3% of returns)
Here:
$37,686
State:
$62,806
(% of AGI for various income ranges: 877.6% for AGIs below $25k, 3271.5% for AGIs $25k-50k, 5520.5% for AGIs $50k-75k, 9047.6% for AGIs $75k-100k, 15108.8% for AGIs $100k-200k)
Taxable interest for individuals: $857 (reported on 18.9% of returns)
This zip code:
$857
Pennsylvania:
$1,633
(% of AGI for various income ranges: 13.2% for AGIs below $25k, 8.1% for AGIs $25k-50k, 29.0% for AGIs $50k-75k, 35.9% for AGIs $75k-100k, 100.6% for AGIs $100k-200k)
Ordinary dividends: $2,084 (reported on 12.9% of returns)
Here:
$2,084
State:
$7,382
(% of AGI for various income ranges: 18.0% for AGIs below $25k, 17.4% for AGIs $25k-50k, 29.0% for AGIs $50k-75k, 75.9% for AGIs $75k-100k, 200.6% for AGIs $100k-200k)
Net capital gain/loss in AGI: +$4,311 (reported on 8.4% of returns)
Here:
+$4,311
State:
+$23,522
(% of AGI for various income ranges: 6.1% for AGIs below $25k, 17.7% for AGIs $25k-50k, 41.7% for AGIs $50k-75k, 28.8% for AGIs $75k-100k, 480.6% for AGIs $100k-200k)
Profit/loss from business: +$5,480 (reported on 9.0% of returns)
Here:
+$5,480
State:
+$16,274
(% of AGI for various income ranges: 57.2% for AGIs below $25k, 75.5% for AGIs $25k-50k, 86.7% for AGIs $50k-75k, 38.8% for AGIs $75k-100k, 4.4% for AGIs $100k-200k)
Taxable individual retirement arrangement distribution: $9,721 (reported on 8.4% of returns)
18224:
$9,721
Pennsylvania:
$18,583
(% of AGI for various income ranges: 58.2% for AGIs below $25k, 61.5% for AGIs $25k-50k, 124.8% for AGIs $50k-75k, 198.2% for AGIs $75k-100k, 479.4% for AGIs $100k-200k)
Total itemized deductions: $25,350 (reported on 1.8% of returns)
Here:
$25,350
State:
$34,850
(% of AGI for various income ranges: 57.2% for AGIs $25k-50k, 242.4% for AGIs $50k-75k)
Charity contributions: $4,050 (reported on 1.2% of returns)
Here:
$4,050
State:
$12,392
(% of AGI for various income ranges: 38.6% for AGIs $50k-75k)
Taxes paid: $6,333 (reported on 1.8% of returns)
18224:
$6,333
State:
$8,200
(% of AGI for various income ranges: 9.0% for AGIs $25k-50k, 71.7% for AGIs $50k-75k)
Earned income credit: $2,323 (reported on 22.2% of returns)
Here:
$2,323
State:
$2,100
(% of AGI for various income ranges: 109.8% for AGIs below $25k, 76.8% for AGIs $25k-50k)
Percentage of individuals using paid preparers for their 2020 taxes: 94.0%
Here:
94%
State:
92%
(% for various income ranges: 93.2% for AGIs below $25k, 95.2% for AGIs $25k-50k, 94.1% for AGIs $50k-75k, 91.3% for AGIs $75k-100k, 95.7% for AGIs $100k-200k)
Averages for the 2012 tax year for zip code 18224, filed in 2013:
Average Adjusted Gross Income (AGI) in 2012: $36,094 (Individual Income Tax Returns)
Here:
$36,094
State:
$61,346
Salary/wage: $33,483 (reported on 82.0% of returns)
Here:
$33,483
State:
$51,902
(% of AGI for various income ranges: 64.7% for AGIs below $25k, 82.7% for AGIs $25k-50k, 79.5% for AGIs $50k-75k, 77.3% for AGIs $75k-100k, 68.6% for AGIs $100k-200k)
Taxable interest for individuals: $787 (reported on 27.3% of returns)
This zip code:
$787
Pennsylvania:
$1,588
(% of AGI for various income ranges: 1.2% for AGIs below $25k, 0.5% for AGIs $25k-50k, 0.4% for AGIs $50k-75k, 0.7% for AGIs $75k-100k, 0.5% for AGIs $100k-200k)
Ordinary dividends: $1,728 (reported on 18.0% of returns)
Here:
$1,728
State:
$5,827
(% of AGI for various income ranges: 1.4% for AGIs below $25k, 0.6% for AGIs $25k-50k, 0.7% for AGIs $50k-75k, 1.1% for AGIs $75k-100k, 0.9% for AGIs $100k-200k)
Net capital gain/loss in AGI: +$346 (reported on 9.3% of returns)
Here:
+$346
State:
+$14,495
(% of AGI for various income ranges: 0.4% for AGIs $75k-100k, 0.5% for AGIs $100k-200k)
Profit/loss from business: +$8,108 (reported on 8.7% of returns)
Here:
+$8,108
State:
+$16,268
(% of AGI for various income ranges: 5.2% for AGIs below $25k, 1.6% for AGIs $25k-50k, 1.9% for AGIs $50k-75k, 1.8% for AGIs $75k-100k)
Taxable individual retirement arrangement distribution: $8,945 (reported on 11.0% of returns)
18224:
$8,945
Pennsylvania:
$14,550
(% of AGI for various income ranges: 4.4% for AGIs below $25k, 1.5% for AGIs $25k-50k, 2.2% for AGIs $50k-75k, 2.3% for AGIs $75k-100k, 4.7% for AGIs $100k-200k)
Total itemized deductions: $15,856 (21% of AGI, reported on 10.7% of returns)
Here:
$15,856
State:
$23,538
Here:
21.0% of AGI
State:
18.4% of AGI
(% of AGI for various income ranges: 1.9% for AGIs below $25k, 3.8% for AGIs $25k-50k, 3.9% for AGIs $50k-75k, 6.3% for AGIs $75k-100k, 7.9% for AGIs $100k-200k)
Charity contributions: $2,092 (reported on 8.3% of returns)
Here:
$2,092
State:
$4,025
(% of AGI for various income ranges: 0.3% for AGIs $25k-50k, 0.2% for AGIs $50k-75k, 1.0% for AGIs $75k-100k, 1.0% for AGIs $100k-200k)
Taxes paid: $5,041 (reported on 10.7% of returns)
18224:
$5,041
State:
$9,982
(% of AGI for various income ranges: 0.3% for AGIs below $25k, 1.0% for AGIs $25k-50k, 1.2% for AGIs $50k-75k, 1.8% for AGIs $75k-100k, 3.4% for AGIs $100k-200k)
Earned income credit: $2,056 (reported on 20.7% of returns)
Here:
$2,056
State:
$2,106
(% of AGI for various income ranges: 6.3% for AGIs below $25k, 1.0% for AGIs $25k-50k)
Percentage of individuals using paid preparers for their 2012 taxes: 57.7%
Here:
58%
State:
53%
(% for various income ranges: 55.8% for AGIs below $25k, 58.8% for AGIs $25k-50k, 54.8% for AGIs $50k-75k, 63.6% for AGIs $75k-100k, 69.2% for AGIs $100k-200k)
Averages for the 2004 tax year for zip code 18224, filed in 2005:
Average Adjusted Gross Income (AGI) in 2004: $30,440 (Individual Income Tax Returns)
Here:
$30,440
State:
$48,049
Salary/wage: $28,388 (reported on 83.2% of returns)
Here:
$28,388
State:
$42,646
(% of AGI for various income ranges: 74.4% for AGIs below $10k, 72.8% for AGIs $10k-25k, 84.0% for AGIs $25k-50k, 81.6% for AGIs $50k-75k, 86.3% for AGIs $75k-100k, 50.9% for AGIs over 100k)
Taxable interest for individuals: $1,483 (reported on 43.1% of returns)
This zip code:
$1,483
Pennsylvania:
$1,657
(% of AGI for various income ranges: 3.9% for AGIs below $10k, 2.4% for AGIs $10k-25k, 1.6% for AGIs $25k-50k, 2.0% for AGIs $50k-75k, 0.7% for AGIs $75k-100k, 4.2% for AGIs over 100k)
Taxable dividends: $1,680 (reported on 23.4% of returns)
Here:
$1,680
State:
$3,566
(% of AGI for various income ranges: 2.2% for AGIs below $10k, 1.9% for AGIs $10k-25k, 0.9% for AGIs $25k-50k, 1.9% for AGIs $50k-75k, 0.5% for AGIs $75k-100k, 1.1% for AGIs over 100k)
Net capital gain/loss: +$546 (reported on 12.9% of returns)
Here:
+$546
State:
+$9,716
(% of AGI for various income ranges: -0.8% for AGIs below $10k, -0.1% for AGIs $10k-25k, 0.2% for AGIs $25k-50k, 0.3% for AGIs $50k-75k, -0.1% for AGIs $75k-100k, 1.2% for AGIs over 100k)
Profit/loss from business: +$9,775 (reported on 8.5% of returns)
Here:
+$9,775
State:
+$14,267
(% of AGI for various income ranges: 2.8% for AGIs below $10k, 3.4% for AGIs $10k-25k, 1.0% for AGIs $25k-50k, 1.8% for AGIs $50k-75k, 0.1% for AGIs $75k-100k, 10.9% for AGIs over 100k)
IRA payment deduction: $2,672 (reported on 2.2% of returns)
18224:
$2,672
Pennsylvania:
$2,903
Total itemized deductions: $13,284 (19% of AGI, reported on 10.2% of returns)
Here:
$13,284
State:
$18,804
Here:
18.9% of AGI
State:
19.5% of AGI
(% of AGI for various income ranges: 2.8% for AGIs $10k-25k, 3.2% for AGIs $25k-50k, 5.4% for AGIs $50k-75k, 5.6% for AGIs $75k-100k, 8.2% for AGIs over 100k)
Charity contributions deductions: $1,957 (3% of AGI, reported on 8.7% of returns)
Here:
$1,957
State:
$3,337
Here:
2.6% of AGI
State:
3.3% of AGI
(% of AGI for various income ranges: 0.1% for AGIs $10k-25k, 0.2% for AGIs $25k-50k, 0.8% for AGIs $50k-75k, 0.7% for AGIs $75k-100k, 1.6% for AGIs over 100k)
Total tax: $3,801 (reported on 70.7% of returns)
18224:
$3,801
State:
$8,008
(% of AGI for various income ranges: 1.5% for AGIs below $10k, 4.2% for AGIs $10k-25k, 7.0% for AGIs $25k-50k, 9.0% for AGIs $50k-75k, 11.0% for AGIs $75k-100k, 19.5% for AGIs over 100k)
Earned income credit: $1,522 (reported on 15.9% of returns)
Here:
$1,522
State:
$1,643
Percentage of individuals using paid preparers for their 2004 taxes: 56.8%
Here:
57%
State:
56%
(% for various income ranges: 54.1% for AGIs below $10k, 59.0% for AGIs $10k-25k, 55.1% for AGIs $25k-50k, 61.4% for AGIs $50k-75k, 50.8% for AGIs $75k-100k, 68.6% for AGIs over 100k)
Household received Food Stamps/SNAP in the past 12 months: 758 Household did not receive Food Stamps/SNAP in the past 12 months: 1,971
Women who had a birth in the past 12 months: 6 (0 now married, 5 unmarried) Women who did not have a birth in the past 12 months: 1,255 (541 now married, 712 unmarried)
Housing units in zip code 18224 with a mortgage: 914 (43 second mortgage, 13 home equity loan, 24 both second mortgage and home equity loan) Houses without a mortgage: 45
Median monthly owner costs for units with a mortgage: $995 Median monthly owner costs for units without a mortgage: $571
Residents with income below the poverty level in 2022:
This zip code:
9.7%
Whole state:
11.8%
Residents with income below 50% of the poverty level in 2022:
This zip code:
6.3%
Whole state:
6.1%
Median number of rooms in houses and condos:
Here:
6.8
State:
6.8
Median number of rooms in apartments:
Here:
6.2
State:
4.3
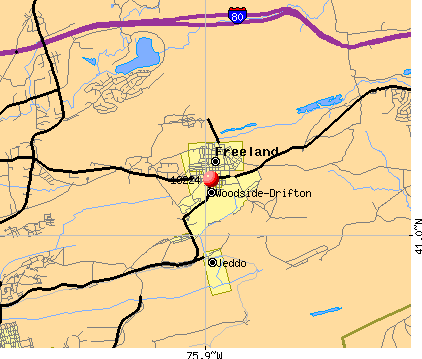
Notable locations in this zip code not listed on our city pages
Notable locations in zip code 18224: Pond Creek Junction (A), Fearnots Volunteer Fire Company (B), Freeland Fire Department (C), Sandy Run Colliery (D). Display/hide their locations on the map
909 married couples with children.
202 single-parent households (11 men, 191 women).
86.3% of residents of 18224 zip code speak English at home.
12.0% of residents speak Spanish at home (43% very well, 16% well, 26% not well, 15% not at all).
1.7% of residents speak other Indo-European language at home (100% very well).
0.2% of residents speak Asian or Pacific Island language at home (100% very well).
0.2% of residents speak other language at home (100% well).
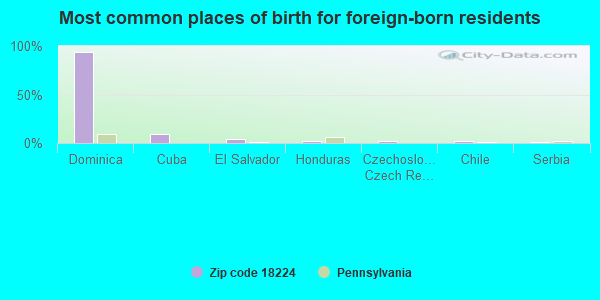
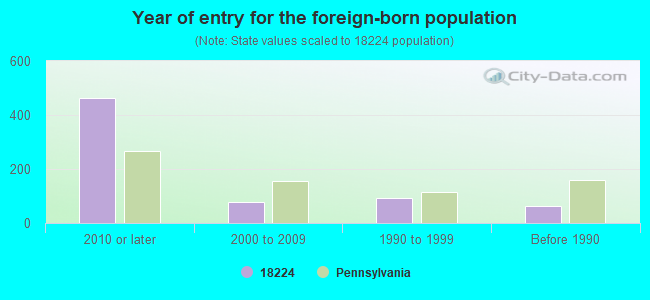
Foreign born population: 333 (5.6%) (35.8% of them are naturalized citizens)
This zip code:
5.6%
Whole state:
7.5%
94%Dominica
9%Cuba
4%El Salvador
2%Honduras
2%Czechoslovakia (includes Czech Republic and Slovakia)
2%Chile
1%Serbia
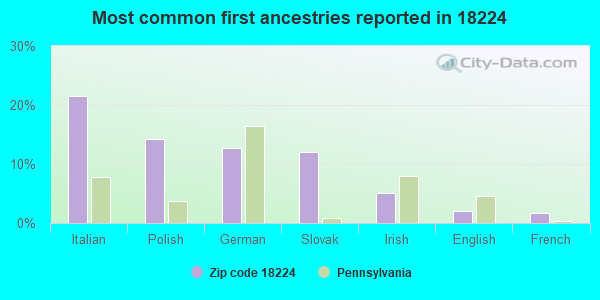
22%Italian
14%Polish
13%German
12%Slovak
5%Irish
2%English
2%French
Year of entry for the foreign-born population
4642010 or later
792000 to 2009
921990 to 1999
64Before 1990
Facilities with environmental interests located in this zip code:
AG-MAR WWTP (LAKESIDE RD in FREELAND, PA)
National Pollutant Discharge Elimination System NON-MAJOR (Tracking pollutant discharge elimination systems) - permit Business SIC classification: SEWERAGE SYSTEMS Alternative names: FOSTER TOWNSHIP
Housing units lacking complete plumbing facilities: 1.5% Housing units lacking complete kitchen facilities: 2.0%
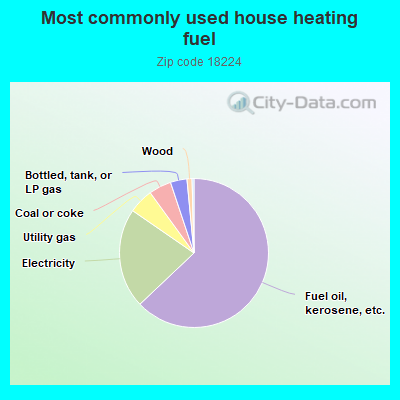
63.0%Fuel oil, kerosene, etc.
21.7%Electricity
5.4%Utility gas
4.9%Coal or coke
3.6%Bottled, tank, or LP gas
1.1%Wood
Population in 1990: 6,311.
Place of birth for U.S.-born residents:
This state: 4,201
Northeast: 686
Midwest: 60
South: 347
West: 44
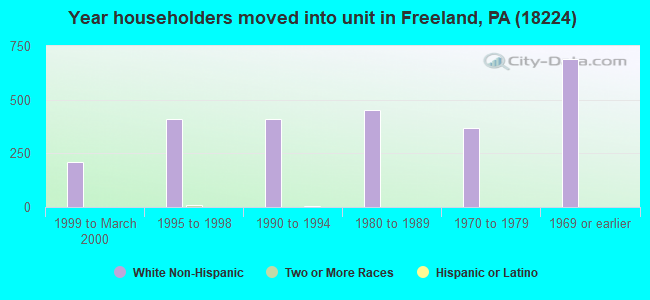
76% of the 18224 zip code residents lived in the same house 5 years ago. Out of people who lived in different houses, 77% lived in this county. Out of people who lived in different counties, 50% lived in Pennsylvania.
96% of the 18224 zip code residents lived in the same house 1 year ago. Out of people who lived in different houses, 59% moved from this county. Out of people who lived in different houses, 17% moved from different county within same state. Out of people who lived in different houses, 29% moved from different state.
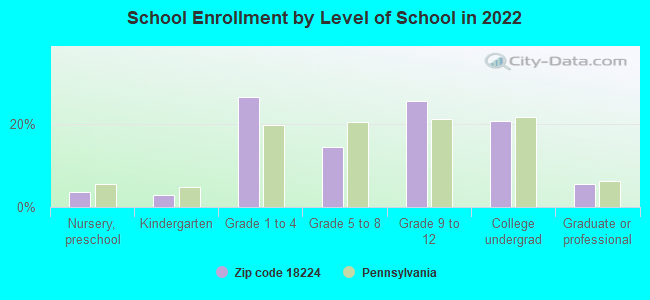
Private vs. public school enrollment:
Students in private schools in grades 1 to 8 (elementary and middle school): 43
Here:
8.1%
Pennsylvania:
15.7%
Students in private schools in grades 9 to 12 (high school): 13
Here:
3.9%
Pennsylvania:
13.4%
Students in private undergraduate colleges: 47
Here:
17.4%
Pennsylvania:
39.8%
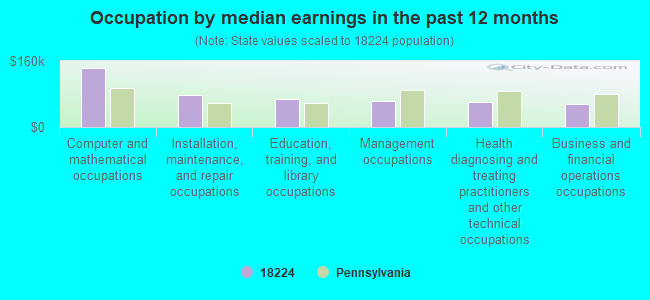
Occupation by median earnings in the past 12 months ($)
142,302Computer and mathematical occupations
78,135Installation, maintenance, and repair occupations
68,653Education, training, and library occupations
62,133Management occupations
59,986Health diagnosing and treating practitioners and other technical occupations
55,295Business and financial operations occupations
Companies with federal contracts located in this zip code:
BERGER CONSTRUCTION COMPANY (ROUTE 940 JAPAN-JEDDO in FREELAND, PA; small business) : $4,070,854 in 8 contractsfrom 2004 to 2006
Contracts for Maintenance, Repair or Alteration of Real Property -- Production Buildings, Construction of Structures and Facilities -- Other Industrial Buildings, Maintenance, Repair or Alteration of Real Property -- Maintenance Buildings by Army Signed by year:2000: $0; 2001: $0; 2002: $0; 2003: $0; 2004: $380,425; 2005: $3,656,554; 2006: $33,875.
Biggest contracts:
$2,059,280 with Army for Maintenance, Repair or Alteration of Real Property -- Production Buildings. Signed on 2005-12-07. Completion date: 2006-06-30.
$1,576,636 with Army for Construction of Structures and Facilities -- Other Industrial Buildings. Signed on 2005-05-18. Completion date: 2005-12-15.
$359,943 with Army for Maintenance, Repair or Alteration of Real Property -- Maintenance Buildings. Signed on 2004-04-16. Completion date: 2004-10-29.
$33,875 with Army for Construction of Structures and Facilities -- Other Industrial Buildings. Signed on 2006-03-30. Completion date: 2006-06-16.
Top industries in this zip code by the number of employees in 2005:
Construction: Commercial and Institutional Building Construction (20-49 employees: 1 establishment)
Educational Services: Elementary and Secondary Schools (20-49: 1)
Health Care and Social Assistance: Offices of Dentists (10-19: 1, 5-9: 2, 1-4: 1)
Other Services (except Public Administration): Religious Organizations (10-19: 1, 5-9: 1, 1-4: 3)
Other Services (except Public Administration): Civic and Social Organizations (5-9: 3, 1-4: 1)
Fatal accident statistics in 2014:
Fatal accident count: 1
Vehicles involved in fatal accidents: 2
Fatal accidents caused by drunken drivers: 1
Fatalities: 1
Persons involved in fatal accidents: 2
Pedestrians involved in fatal accidents: 0
Home Mortgage Disclosure Act Aggregated Statistics For Year 2009 (Based on 1 full and 2 partial tracts)
A) FHA, FSA/RHS & VA Home Purchase Loans
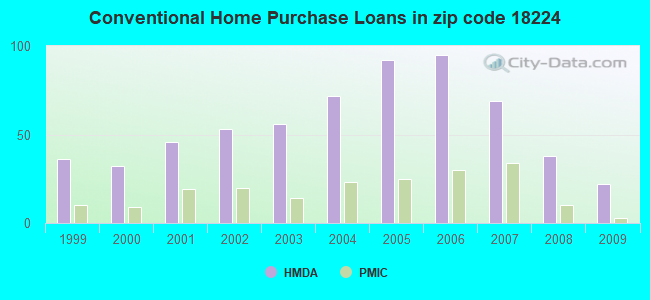
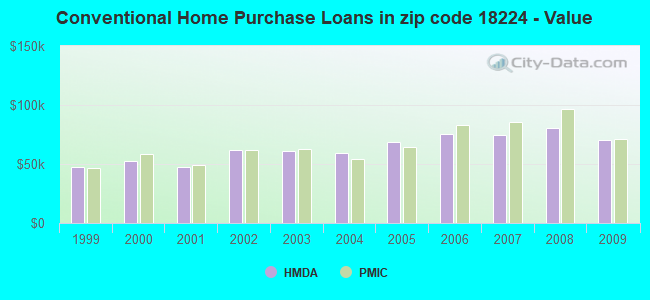
B) Conventional Home Purchase Loans
C) Refinancings
D) Home Improvement Loans
F) Non-occupant Loans on < 5 Family Dwellings (A B C & D)
G) Loans On Manufactured Home Dwelling (A B C & D)
Number
Average Value
Number
Average Value
Number
Average Value
Number
Average Value
Number
Average Value
Number
Average Value
LOANS ORIGINATED
16
$98,066
22
$70,595
50
$90,756
19
$28,059
9
$58,877
1
$62,810
APPLICATIONS APPROVED, NOT ACCEPTED
1
$31,000
0
$0
7
$82,937
1
$10,370
0
$0
0
$0
APPLICATIONS DENIED
7
$91,523
3
$62,687
65
$101,381
24
$20,252
6
$116,373
1
$24,390
APPLICATIONS WITHDRAWN
1
$220,750
3
$91,027
27
$100,304
1
$59,000
1
$148,790
0
$0
FILES CLOSED FOR INCOMPLETENESS
2
$78,625
2
$38,490
6
$86,835
0
$0
1
$41,000
2
$46,990
Aggregated Statistics For Year 2008 (Based on 1 full and 2 partial tracts)
A) FHA, FSA/RHS & VA Home Purchase Loans
B) Conventional Home Purchase Loans
C) Refinancings
D) Home Improvement Loans
F) Non-occupant Loans on < 5 Family Dwellings (A B C & D)
G) Loans On Manufactured Home Dwelling (A B C & D)
Number
Average Value
Number
Average Value
Number
Average Value
Number
Average Value
Number
Average Value
Number
Average Value
LOANS ORIGINATED
10
$98,662
38
$80,547
56
$98,288
23
$35,470
17
$65,886
4
$49,270
APPLICATIONS APPROVED, NOT ACCEPTED
1
$61,000
5
$89,950
16
$98,082
4
$19,635
2
$62,550
1
$72,570
APPLICATIONS DENIED
5
$94,020
8
$82,356
86
$96,772
26
$32,206
6
$66,478
2
$17,075
APPLICATIONS WITHDRAWN
0
$0
3
$60,723
30
$116,924
3
$52,280
2
$91,165
1
$130,500
FILES CLOSED FOR INCOMPLETENESS
1
$82,000
3
$55,603
4
$131,268
2
$60,320
1
$31,000
0
$0
Aggregated Statistics For Year 2007 (Based on 1 full and 2 partial tracts)
A) FHA, FSA/RHS & VA Home Purchase Loans
B) Conventional Home Purchase Loans
C) Refinancings
D) Home Improvement Loans
F) Non-occupant Loans on < 5 Family Dwellings (A B C & D)
G) Loans On Manufactured Home Dwelling (A B C & D)
Number
Average Value
Number
Average Value
Number
Average Value
Number
Average Value
Number
Average Value
Number
Average Value
LOANS ORIGINATED
7
$72,949
69
$74,996
77
$83,929
39
$25,130
26
$83,914
3
$36,213
APPLICATIONS APPROVED, NOT ACCEPTED
2
$59,320
11
$63,687
15
$82,382
9
$25,677
8
$59,216
1
$39,640
APPLICATIONS DENIED
2
$65,355
17
$78,355
110
$98,520
54
$36,084
15
$72,799
1
$8,540
APPLICATIONS WITHDRAWN
3
$84,197
4
$58,998
38
$108,076
4
$40,215
4
$80,575
1
$61,590
FILES CLOSED FOR INCOMPLETENESS
0
$0
3
$69,667
12
$91,104
1
$43,910
1
$39,030
0
$0
Aggregated Statistics For Year 2006 (Based on 1 full and 2 partial tracts)
A) FHA, FSA/RHS & VA Home Purchase Loans
B) Conventional Home Purchase Loans
C) Refinancings
D) Home Improvement Loans
E) Loans on Dwellings For 5+ Families
F) Non-occupant Loans on < 5 Family Dwellings (A B C & D)
G) Loans On Manufactured Home Dwelling (A B C & D)
Number
Average Value
Number
Average Value
Number
Average Value
Number
Average Value
Number
Average Value
Number
Average Value
Number
Average Value
LOANS ORIGINATED
6
$73,535
95
$75,477
99
$74,346
45
$29,454
1
$2,680,000
29
$73,997
4
$66,150
APPLICATIONS APPROVED, NOT ACCEPTED
1
$21,340
10
$46,340
22
$69,590
7
$35,469
0
$0
5
$61,850
1
$17,680
APPLICATIONS DENIED
1
$26,830
27
$73,617
137
$71,883
57
$42,483
0
$0
18
$67,161
4
$80,198
APPLICATIONS WITHDRAWN
2
$119,930
20
$88,582
56
$91,471
9
$39,137
0
$0
6
$93,817
1
$43,300
FILES CLOSED FOR INCOMPLETENESS
0
$0
4
$74,545
10
$98,786
1
$25,000
0
$0
1
$23,780
0
$0
Aggregated Statistics For Year 2005 (Based on 1 full and 2 partial tracts)
A) FHA, FSA/RHS & VA Home Purchase Loans
B) Conventional Home Purchase Loans
C) Refinancings
D) Home Improvement Loans
E) Loans on Dwellings For 5+ Families
F) Non-occupant Loans on < 5 Family Dwellings (A B C & D)
G) Loans On Manufactured Home Dwelling (A B C & D)
Number
Average Value
Number
Average Value
Number
Average Value
Number
Average Value
Number
Average Value
Number
Average Value
Number
Average Value
LOANS ORIGINATED
4
$62,855
92
$68,889
86
$65,322
32
$28,401
0
$0
29
$51,566
4
$55,188
APPLICATIONS APPROVED, NOT ACCEPTED
0
$0
12
$61,852
23
$59,629
7
$59,741
0
$0
3
$56,260
3
$56,113
APPLICATIONS DENIED
1
$115,000
30
$69,942
146
$70,423
72
$27,529
2
$88,000
16
$40,983
2
$60,085
APPLICATIONS WITHDRAWN
0
$0
13
$71,099
42
$77,356
4
$109,888
1
$1,748,000
8
$63,368
1
$11,590
FILES CLOSED FOR INCOMPLETENESS
0
$0
3
$90,943
7
$70,599
1
$42,690
0
$0
1
$18,290
0
$0
Aggregated Statistics For Year 2004 (Based on 1 full and 2 partial tracts)
A) FHA, FSA/RHS & VA Home Purchase Loans
B) Conventional Home Purchase Loans
C) Refinancings
D) Home Improvement Loans
F) Non-occupant Loans on < 5 Family Dwellings (A B C & D)
G) Loans On Manufactured Home Dwelling (A B C & D)
Number
Average Value
Number
Average Value
Number
Average Value
Number
Average Value
Number
Average Value
Number
Average Value
LOANS ORIGINATED
8
$62,982
72
$59,727
105
$66,181
28
$24,909
33
$52,064
4
$66,632
APPLICATIONS APPROVED, NOT ACCEPTED
0
$0
9
$55,550
24
$69,373
5
$18,722
5
$41,046
1
$26,000
APPLICATIONS DENIED
2
$52,000
17
$47,985
112
$66,985
35
$27,860
13
$33,898
3
$38,513
APPLICATIONS WITHDRAWN
1
$69,000
8
$61,850
60
$72,656
5
$52,042
2
$121,350
1
$62,810
FILES CLOSED FOR INCOMPLETENESS
0
$0
1
$23,780
7
$73,181
0
$0
0
$0
0
$0
Aggregated Statistics For Year 2003 (Based on 1 full and 2 partial tracts)
A) FHA, FSA/RHS & VA Home Purchase Loans
B) Conventional Home Purchase Loans
C) Refinancings
D) Home Improvement Loans
F) Non-occupant Loans on < 5 Family Dwellings (A B C & D)
Number
Average Value
Number
Average Value
Number
Average Value
Number
Average Value
Number
Average Value
LOANS ORIGINATED
6
$59,115
56
$61,130
145
$59,619
36
$25,233
14
$50,603
APPLICATIONS APPROVED, NOT ACCEPTED
0
$0
8
$54,575
34
$50,464
7
$18,251
6
$34,502
APPLICATIONS DENIED
3
$52,553
13
$67,136
116
$54,518
28
$21,528
9
$58,900
APPLICATIONS WITHDRAWN
0
$0
4
$69,958
62
$65,838
5
$24,200
3
$58,197
FILES CLOSED FOR INCOMPLETENESS
0
$0
4
$71,710
7
$56,609
1
$9,760
3
$35,733
Aggregated Statistics For Year 2002 (Based on 1 full and 2 partial tracts)
A) FHA, FSA/RHS & VA Home Purchase Loans
B) Conventional Home Purchase Loans
C) Refinancings
D) Home Improvement Loans
E) Loans on Dwellings For 5+ Families
F) Non-occupant Loans on < 5 Family Dwellings (A B C & D)
Number
Average Value
Number
Average Value
Number
Average Value
Number
Average Value
Number
Average Value
Number
Average Value
LOANS ORIGINATED
10
$55,852
53
$61,445
107
$50,519
21
$19,740
0
$0
21
$47,454
APPLICATIONS APPROVED, NOT ACCEPTED
1
$71,000
4
$82,998
25
$78,459
6
$19,017
0
$0
2
$58,540
APPLICATIONS DENIED
0
$0
5
$27,548
89
$56,373
18
$22,329
1
$66,000
5
$35,040
APPLICATIONS WITHDRAWN
0
$0
5
$40,148
51
$69,840
1
$27,440
0
$0
2
$49,735
FILES CLOSED FOR INCOMPLETENESS
0
$0
1
$25,610
7
$64,987
1
$18,000
0
$0
1
$25,610
Aggregated Statistics For Year 2001 (Based on 1 full and 2 partial tracts)
A) FHA, FSA/RHS & VA Home Purchase Loans
B) Conventional Home Purchase Loans
C) Refinancings
D) Home Improvement Loans
E) Loans on Dwellings For 5+ Families
F) Non-occupant Loans on < 5 Family Dwellings (A B C & D)
Number
Average Value
Number
Average Value
Number
Average Value
Number
Average Value
Number
Average Value
Number
Average Value
LOANS ORIGINATED
6
$60,228
46
$47,214
107
$52,358
38
$22,536
0
$0
12
$47,274
APPLICATIONS APPROVED, NOT ACCEPTED
0
$0
8
$45,035
20
$44,928
6
$20,115
0
$0
1
$6,710
APPLICATIONS DENIED
0
$0
13
$64,463
91
$47,834
21
$24,039
0
$0
7
$46,030
APPLICATIONS WITHDRAWN
1
$34,150
3
$62,667
48
$60,912
9
$14,544
1
$68,000
1
$43,300
FILES CLOSED FOR INCOMPLETENESS
0
$0
2
$46,915
7
$80,650
0
$0
0
$0
1
$82,320
Aggregated Statistics For Year 2000 (Based on 1 full and 2 partial tracts)
A) FHA, FSA/RHS & VA Home Purchase Loans
B) Conventional Home Purchase Loans
C) Refinancings
D) Home Improvement Loans
E) Loans on Dwellings For 5+ Families
F) Non-occupant Loans on < 5 Family Dwellings (A B C & D)
Number
Average Value
Number
Average Value
Number
Average Value
Number
Average Value
Number
Average Value
Number
Average Value
LOANS ORIGINATED
7
$60,227
32
$52,372
47
$39,112
23
$18,804
1
$45,000
3
$29,870
APPLICATIONS APPROVED, NOT ACCEPTED
0
$0
5
$34,104
21
$46,206
12
$33,888
0
$0
0
$0
APPLICATIONS DENIED
0
$0
14
$45,545
67
$47,986
16
$18,349
0
$0
2
$18,000
APPLICATIONS WITHDRAWN
0
$0
0
$0
37
$62,330
2
$33,500
0
$0
0
$0
FILES CLOSED FOR INCOMPLETENESS
1
$33,000
2
$41,000
7
$86,146
0
$0
0
$0
0
$0
Aggregated Statistics For Year 1999 (Based on 1 full and 1 partial tracts)
A) FHA, FSA/RHS & VA Home Purchase Loans
B) Conventional Home Purchase Loans
C) Refinancings
D) Home Improvement Loans
F) Non-occupant Loans on < 5 Family Dwellings (A B C & D)
Detailed PMIC statistics for the following Tracts:2167.00
, 2168.00
2005 - 2018 National Fire Incident Reporting System (NFIRS) incidents
Based on the data from the years 2005 - 2018 the average number of fire incidents per year is 26. The highest number of fires - 60 took place in 2016, and the least - 0 in 2007. The data has an increasing trend.
When looking into fire subcategories, the most reports belonged to: Structure Fires (74.8%), and Outside Fires (17.0%).
Fire incident types reported to NFIRS in Zip Code 18224


 Nearest zip codes: 18221, 18216, 18223, 18234, 18255, 18225.


 Based on the data from the years 2005 - 2018 the average number of fire incidents per year is 26. The highest number of fires - 60 took place in 2016, and the least - 0 in 2007. The data has an increasing trend.
 When looking into fire subcategories, the most reports belonged to: Structure Fires (74.8%), and Outside Fires (17.0%).