Estimated zip code population in 2022: 12,388 Zip code population in 2010: 12,012 Zip code population in 2000: 9,803
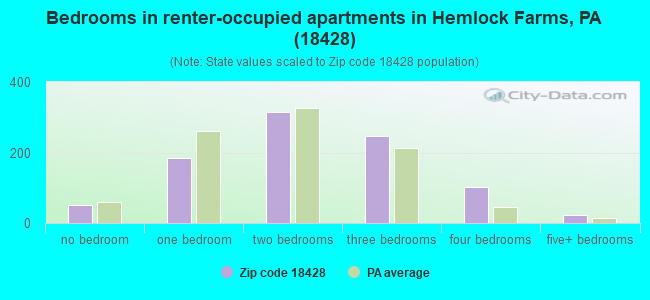
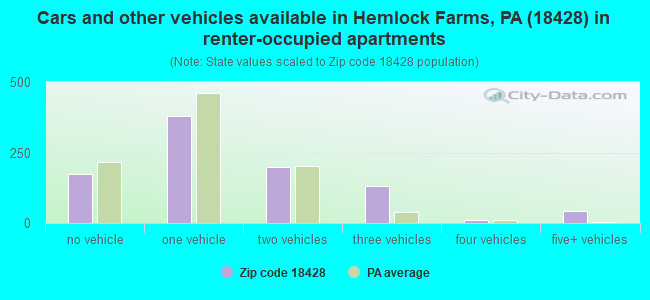
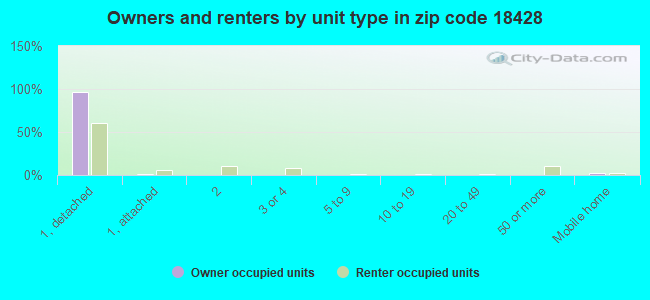
Houses and condos: 9,790 Renter-occupied apartments: 928
% of renters here:
17%
State:
31%
March 2022 cost of living index in zip code 18428: 106.0 (more than average, U.S. average is 100)
Land area: 166.0 sq. mi. Water area: 5.1 sq. mi.
Population density: 75 people per square mile
(very low).
OSM Map
General Map
Google Map
MSN Map
OSM Map
General Map
Google Map
MSN Map
OSM Map
General Map
Google Map
MSN Map
OSM Map
General Map
Google Map
MSN Map
Please wait while loading the map...
Real estate property taxes paid for housing units in 2022:
This zip code:
1.1% ($2,792)
Pennsylvania:
1.3% ($3,094)
Median real estate property taxes paid for housing units with mortgages in 2022: $2,910 (1.1%) Median real estate property taxes paid for housing units with no mortgage in 2022: $2,669 (1.1%)
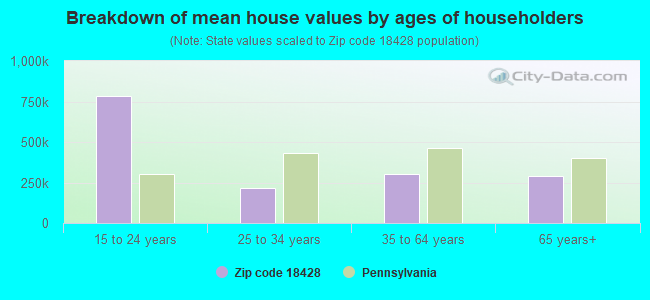
Estimated median house/condo value in 2022: $253,423
18428:
$253,423
Pennsylvania:
$245,500
According to our research of Pennsylvania and other state lists, there were 18 registered sex offenders living in 18428 zip code as of June 19, 2024. The ratio of all residents to sex offenders in zip code 18428 is 690 to 1. The ratio of registered sex offenders to all residents in this zip code is near the state average.
Median resident age:
This zip code:
51.9 years
Pennsylvania median age:
40.9 years
Average household size:
This zip code:
2.3 people
Pennsylvania:
2.4 people
Averages for the 2020 tax year for zip code 18428, filed in 2021:
Average Adjusted Gross Income (AGI) in 2020: $70,348 (Individual Income Tax Returns)
Here:
$70,348
State:
$75,707
Salary/wage: $53,594 (reported on 71.6% of returns)
Here:
$53,594
State:
$62,806
(% of AGI for various income ranges: 1029.0% for AGIs below $25k, 3096.0% for AGIs $25k-50k, 5460.3% for AGIs $50k-75k, 7718.3% for AGIs $75k-100k, 14604.0% for AGIs $100k-200k, 73658.6% for AGIs over 200k)
Taxable interest for individuals: $1,493 (reported on 36.9% of returns)
This zip code:
$1,493
Pennsylvania:
$1,633
(% of AGI for various income ranges: 28.9% for AGIs below $25k, 37.0% for AGIs $25k-50k, 66.9% for AGIs $50k-75k, 69.3% for AGIs $75k-100k, 163.7% for AGIs $100k-200k, 1597.1% for AGIs over 200k)
Ordinary dividends: $7,571 (reported on 26.1% of returns)
Here:
$7,571
State:
$7,382
(% of AGI for various income ranges: 47.5% for AGIs below $25k, 77.2% for AGIs $25k-50k, 185.9% for AGIs $50k-75k, 259.5% for AGIs $75k-100k, 510.2% for AGIs $100k-200k, 8497.1% for AGIs over 200k)
Net capital gain/loss in AGI: +$19,529 (reported on 22.1% of returns)
Here:
+$19,529
State:
+$23,522
(% of AGI for various income ranges: 15.0% for AGIs below $25k, 36.3% for AGIs $25k-50k, 165.3% for AGIs $50k-75k, 326.1% for AGIs $75k-100k, 871.3% for AGIs $100k-200k, 27121.4% for AGIs over 200k)
Profit/loss from business: +$19,603 (reported on 14.5% of returns)
Here:
+$19,603
State:
+$16,274
(% of AGI for various income ranges: 122.4% for AGIs below $25k, 229.7% for AGIs $25k-50k, 200.3% for AGIs $50k-75k, 356.6% for AGIs $75k-100k, 677.5% for AGIs $100k-200k, 10658.6% for AGIs over 200k)
Taxable individual retirement arrangement distribution: $21,094 (reported on 14.2% of returns)
18428:
$21,094
Pennsylvania:
$18,583
(% of AGI for various income ranges: 83.9% for AGIs below $25k, 141.0% for AGIs $25k-50k, 372.1% for AGIs $50k-75k, 585.4% for AGIs $75k-100k, 1211.0% for AGIs $100k-200k, 7185.7% for AGIs over 200k)
Self-employed (Keogh) retirement plans: $21,800 (reported on 0.5% of returns)
18428:
$21,800
Pennsylvania:
$25,407
(% of AGI for various income ranges: 934.3% for AGIs over 200k)
Total itemized deductions: $30,823 (reported on 7.7% of returns)
Here:
$30,823
State:
$34,850
(% of AGI for various income ranges: 68.7% for AGIs below $25k, 102.2% for AGIs $25k-50k, 311.6% for AGIs $50k-75k, 430.0% for AGIs $75k-100k, 822.9% for AGIs $100k-200k, 6785.7% for AGIs over 200k)
Charity contributions: $7,158 (reported on 6.5% of returns)
Here:
$7,158
State:
$12,392
(% of AGI for various income ranges: 2.1% for AGIs below $25k, 12.6% for AGIs $25k-50k, 32.9% for AGIs $50k-75k, 51.7% for AGIs $75k-100k, 142.7% for AGIs $100k-200k, 2237.1% for AGIs over 200k)
Taxes paid: $7,834 (reported on 7.7% of returns)
18428:
$7,834
State:
$8,200
(% of AGI for various income ranges: 14.3% for AGIs below $25k, 19.7% for AGIs $25k-50k, 67.9% for AGIs $50k-75k, 134.1% for AGIs $75k-100k, 273.8% for AGIs $100k-200k, 1338.6% for AGIs over 200k)
Earned income credit: $2,003 (reported on 12.4% of returns)
Here:
$2,003
State:
$2,100
(% of AGI for various income ranges: 70.5% for AGIs below $25k, 63.4% for AGIs $25k-50k)
Percentage of individuals using paid preparers for their 2020 taxes: 93.3%
Here:
93%
State:
92%
(% for various income ranges: 93.3% for AGIs below $25k, 94.2% for AGIs $25k-50k, 94.4% for AGIs $50k-75k, 92.3% for AGIs $75k-100k, 91.8% for AGIs $100k-200k, 92.9% for AGIs over 200k)
Averages for the 2012 tax year for zip code 18428, filed in 2013:
Average Adjusted Gross Income (AGI) in 2012: $52,644 (Individual Income Tax Returns)
Here:
$52,644
State:
$61,346
Salary/wage: $41,293 (reported on 72.3% of returns)
Here:
$41,293
State:
$51,902
(% of AGI for various income ranges: 62.5% for AGIs below $25k, 62.0% for AGIs $25k-50k, 57.9% for AGIs $50k-75k, 57.3% for AGIs $75k-100k, 55.1% for AGIs $100k-200k, 49.2% for AGIs over 200k)
Taxable interest for individuals: $1,724 (reported on 40.6% of returns)
This zip code:
$1,724
Pennsylvania:
$1,588
(% of AGI for various income ranges: 2.0% for AGIs below $25k, 1.3% for AGIs $25k-50k, 1.1% for AGIs $50k-75k, 1.1% for AGIs $75k-100k, 1.0% for AGIs $100k-200k, 2.1% for AGIs over 200k)
Ordinary dividends: $5,924 (reported on 28.8% of returns)
Here:
$5,924
State:
$5,827
(% of AGI for various income ranges: 3.1% for AGIs below $25k, 2.0% for AGIs $25k-50k, 2.0% for AGIs $50k-75k, 1.9% for AGIs $75k-100k, 2.8% for AGIs $100k-200k, 8.0% for AGIs over 200k)
Net capital gain/loss in AGI: +$2,794 (reported on 19.4% of returns)
Here:
+$2,794
State:
+$14,495
(% of AGI for various income ranges: 0.6% for AGIs $50k-75k, 0.8% for AGIs $75k-100k, 1.2% for AGIs $100k-200k, 3.4% for AGIs over 200k)
Profit/loss from business: +$16,420 (reported on 14.2% of returns)
Here:
+$16,420
State:
+$16,268
(% of AGI for various income ranges: 9.2% for AGIs below $25k, 4.5% for AGIs $25k-50k, 2.8% for AGIs $50k-75k, 2.4% for AGIs $75k-100k, 3.7% for AGIs $100k-200k, 6.7% for AGIs over 200k)
Taxable individual retirement arrangement distribution: $15,910 (reported on 18.3% of returns)
18428:
$15,910
Pennsylvania:
$14,550
(% of AGI for various income ranges: 4.8% for AGIs below $25k, 4.5% for AGIs $25k-50k, 4.8% for AGIs $50k-75k, 6.5% for AGIs $75k-100k, 7.1% for AGIs $100k-200k, 4.1% for AGIs over 200k)
Self-employment retirement plans: $15,300 (reported on 0.7% of returns)
18428:
$15,300
Pennsylvania:
$20,922
Total itemized deductions: $20,818 (22% of AGI, reported on 32.6% of returns)
Here:
$20,818
State:
$23,538
Here:
22.5% of AGI
State:
18.4% of AGI
(% of AGI for various income ranges: 13.3% for AGIs below $25k, 11.9% for AGIs $25k-50k, 12.5% for AGIs $50k-75k, 13.2% for AGIs $75k-100k, 14.2% for AGIs $100k-200k, 11.2% for AGIs over 200k)
Charity contributions: $2,585 (reported on 26.8% of returns)
Here:
$2,585
State:
$4,025
(% of AGI for various income ranges: 0.9% for AGIs below $25k, 0.9% for AGIs $25k-50k, 1.1% for AGIs $50k-75k, 1.1% for AGIs $75k-100k, 1.5% for AGIs $100k-200k, 2.1% for AGIs over 200k)
Taxes paid: $7,264 (reported on 32.6% of returns)
18428:
$7,264
State:
$9,982
(% of AGI for various income ranges: 3.1% for AGIs below $25k, 3.3% for AGIs $25k-50k, 3.7% for AGIs $50k-75k, 4.2% for AGIs $75k-100k, 5.4% for AGIs $100k-200k, 5.9% for AGIs over 200k)
Earned income credit: $1,986 (reported on 14.0% of returns)
Here:
$1,986
State:
$2,106
(% of AGI for various income ranges: 4.4% for AGIs below $25k, 0.9% for AGIs $25k-50k)
Percentage of individuals using paid preparers for their 2012 taxes: 62.2%
Here:
62%
State:
53%
(% for various income ranges: 54.4% for AGIs below $25k, 61.3% for AGIs $25k-50k, 68.8% for AGIs $50k-75k, 71.2% for AGIs $75k-100k, 74.2% for AGIs $100k-200k, 75.0% for AGIs over 200k)
Averages for the 2004 tax year for zip code 18428, filed in 2005:
Average Adjusted Gross Income (AGI) in 2004: $46,477 (Individual Income Tax Returns)
Here:
$46,477
State:
$48,049
Salary/wage: $35,926 (reported on 73.3% of returns)
Here:
$35,926
State:
$42,646
(% of AGI for various income ranges: 88.9% for AGIs below $10k, 59.3% for AGIs $10k-25k, 62.5% for AGIs $25k-50k, 63.0% for AGIs $50k-75k, 62.7% for AGIs $75k-100k, 45.0% for AGIs over 100k)
Taxable interest for individuals: $2,029 (reported on 57.4% of returns)
This zip code:
$2,029
Pennsylvania:
$1,657
(% of AGI for various income ranges: 6.3% for AGIs below $10k, 3.6% for AGIs $10k-25k, 2.2% for AGIs $25k-50k, 2.2% for AGIs $50k-75k, 2.0% for AGIs $75k-100k, 2.7% for AGIs over 100k)
Taxable dividends: $3,907 (reported on 35.7% of returns)
Here:
$3,907
State:
$3,566
(% of AGI for various income ranges: 7.0% for AGIs below $10k, 2.9% for AGIs $10k-25k, 2.2% for AGIs $25k-50k, 2.2% for AGIs $50k-75k, 2.5% for AGIs $75k-100k, 3.9% for AGIs over 100k)
Net capital gain/loss: +$9,700 (reported on 28.7% of returns)
Here:
+$9,700
State:
+$9,716
(% of AGI for various income ranges: -4.5% for AGIs below $10k, -0.0% for AGIs $10k-25k, 0.8% for AGIs $25k-50k, 0.4% for AGIs $50k-75k, 2.4% for AGIs $75k-100k, 15.5% for AGIs over 100k)
Profit/loss from business: +$16,053 (reported on 16.6% of returns)
Here:
+$16,053
State:
+$14,267
(% of AGI for various income ranges: 3.4% for AGIs below $10k, 9.7% for AGIs $10k-25k, 6.6% for AGIs $25k-50k, 3.6% for AGIs $50k-75k, 4.6% for AGIs $75k-100k, 6.1% for AGIs over 100k)
IRA payment deduction: $3,074 (reported on 3.5% of returns)
18428:
$3,074
Pennsylvania:
$2,903
(% of AGI for various income ranges: 0.7% for AGIs below $10k, 0.3% for AGIs $10k-25k, 0.3% for AGIs $25k-50k, 0.3% for AGIs $50k-75k, 0.2% for AGIs $75k-100k, 0.1% for AGIs over 100k)
Self-employed pension: $13,635 (reported on 1.0% of returns)
Here:
$13,635
Pennsylvania:
$14,674
Total itemized deductions: $17,656 (22% of AGI, reported on 37.0% of returns)
Here:
$17,656
State:
$18,804
Here:
22.4% of AGI
State:
19.5% of AGI
(% of AGI for various income ranges: 20.6% for AGIs below $10k, 14.6% for AGIs $10k-25k, 15.5% for AGIs $25k-50k, 14.9% for AGIs $50k-75k, 15.7% for AGIs $75k-100k, 11.6% for AGIs over 100k)
Charity contributions deductions: $2,414 (3% of AGI, reported on 32.9% of returns)
Here:
$2,414
State:
$3,337
Here:
2.9% of AGI
State:
3.3% of AGI
(% of AGI for various income ranges: 1.0% for AGIs below $10k, 1.3% for AGIs $10k-25k, 1.5% for AGIs $25k-50k, 1.6% for AGIs $50k-75k, 2.3% for AGIs $75k-100k, 1.8% for AGIs over 100k)
Total tax: $7,430 (reported on 74.7% of returns)
18428:
$7,430
State:
$8,008
(% of AGI for various income ranges: 2.9% for AGIs below $10k, 4.4% for AGIs $10k-25k, 6.6% for AGIs $25k-50k, 9.0% for AGIs $50k-75k, 10.6% for AGIs $75k-100k, 19.3% for AGIs over 100k)
Earned income credit: $1,582 (reported on 11.6% of returns)
Here:
$1,582
State:
$1,643
Percentage of individuals using paid preparers for their 2004 taxes: 66.8%
Here:
67%
State:
56%
(% for various income ranges: 55.7% for AGIs below $10k, 65.4% for AGIs $10k-25k, 67.4% for AGIs $25k-50k, 72.2% for AGIs $50k-75k, 72.4% for AGIs $75k-100k, 80.1% for AGIs over 100k)
Likely homosexual households (counted as self-reported same-sex unmarried-partner households)
Lesbian couples: 0.2% of all households
Gay men: 0.0% of all households
Household received Food Stamps/SNAP in the past 12 months: 544 Household did not receive Food Stamps/SNAP in the past 12 months: 4,834
Women who had a birth in the past 12 months: 72 (41 now married, 28 unmarried) Women who did not have a birth in the past 12 months: 1,912 (821 now married, 1,089 unmarried)
Housing units in zip code 18428 with a mortgage: 2,471 (173 second mortgage, 4 home equity loan, 138 both second mortgage and home equity loan) Houses without a mortgage: 79
Median monthly owner costs for units with a mortgage: $1,560 Median monthly owner costs for units without a mortgage: $659
Residents with income below the poverty level in 2022:
This zip code:
6.3%
Whole state:
11.8%
Residents with income below 50% of the poverty level in 2022:
This zip code:
3.8%
Whole state:
6.1%
Median number of rooms in houses and condos:
Here:
6.5
State:
6.8
Median number of rooms in apartments:
Here:
4.8
State:
4.3
Notable locations in this zip code not listed on our city pages
Notable locations in zip code 18428: Cricket Hill Golf Course (A), Purdytown (B), Wilsonville Recreation Area and Boat Launch (C), Beaver Run Club (D), Blooming Grove Fire Department Substation (E), Forest Volunteer Fire Department (F), Hemlock Farms Volunteer Fire and Rescue Company (G), Lakeville Volunteer Fire Company Station 18 Main Station (H), Blooming Grove Fire Department Main Station (I), Hawley Fire Department Station 9 (J), Central Volunteer Fire Department (K). Display/hide their locations on the map
Churches in zip code 18428 include: Good Shepherd Church (A), Christ Church (B), Saint Josephs Church (C), Pillar of Fire Church (D). Display/hide their locations on the map
Lakes, reservoirs, and swamps: Little Teedyuskung Lake (A), Lake Scott (B), White Deer Lake (C), Beaver Lake (D), Kleinhans Lake (E), Wolf Lake (F), Locklin Pond (G), Fourmile Pond (H). Display/hide their locations on the map
Streams, rivers, and creeks: Gates Run (A), Notch Brook (B), Tinkwig Creek (C), Taylor Creek (D), Tarkill Creek (E), Holsey Run (F), Mount Run (G), Fairview Outlet (H), McConnell Creek (I). Display/hide their locations on the map
1,119 married couples with children.
189 single-parent households (117 men, 72 women).
91.9% of residents of 18428 zip code speak English at home.
4.6% of residents speak Spanish at home (94% very well, 3% well, 3% not well).
1.9% of residents speak other Indo-European language at home (88% very well, 12% well).
1.3% of residents speak Asian or Pacific Island language at home (15% very well, 52% well, 9% not well, 24% not at all).
0.4% of residents speak other language at home (100% very well).
Foreign born population: 595 (4.8%) (54.0% of them are naturalized citizens)
This zip code:
4.8%
Whole state:
7.5%
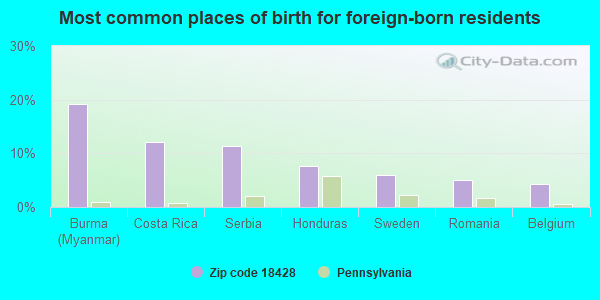
19%Burma (Myanmar)
12%Costa Rica
11%Serbia
8%Honduras
6%Sweden
5%Romania
4%Belgium
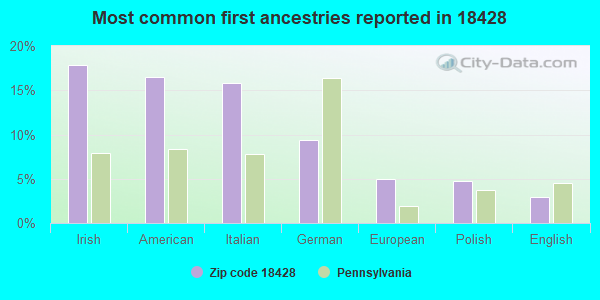
18%Irish
17%American
16%Italian
9%German
5%European
5%Polish
3%English
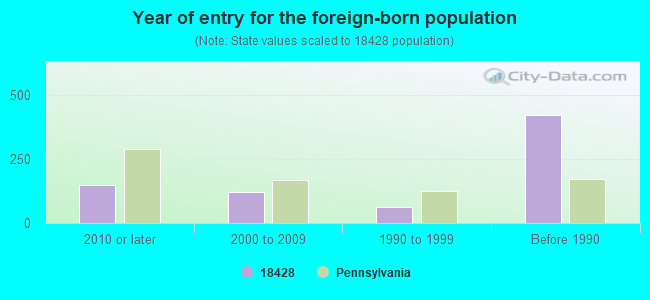
Year of entry for the foreign-born population
1502010 or later
1202000 to 2009
611990 to 1999
423Before 1990
Facilities with environmental interests located in this zip code:
AMER OIL RECYCLING PLT (23 B S WYND DR in HAWLEY, PA)
STATE MASTER (Pennsylvania database) - RCRIS-PAR000509281, HAZARDOUS WASTE PROGRAM USED OIL PROGRAM (Resource Conservation and Recovery Act (tracking hazardous waste)) Business NAICS classification: SOLID WASTE COLLECTION. Organizations: WELLMAN CHARLES C (CONTACT/OPERATOR)
, AMERICAN OIL RECYCLING, INC. (CONTACT/OWNER)
Alternative names: AMERICAN OIL RECYCLING INC
AQUA PENNSYLVANIA INC (2 WOODLOCK SPRINGS in HAWLEY, PA)
National Pollutant Discharge Elimination System NON-MAJOR (Tracking pollutant discharge elimination systems) - permit Business SIC classification: SEWERAGE SYSTEMS Alternative names: FAWN LAKE FOREST WATER CO
AT&T LONG LINES EQ ENGINEERING ATTN M COFFMAN (214 MAPLE AVE in HAWLEY, PA)
Small Quantity Generators, between 100 kg and 1000 kg of hazardous waste/month (Resource Conservation and Recovery Act (tracking hazardous waste)) - notification Organizations: OPERNAME (CONTACT/OPERATOR)
, AT & T LONG LINES (CONTACT/OWNER)
B & R MOTORS SERVICE (512 CHURCH STREET in HAWLEY, PA)
Small Quantity Generators, between 100 kg and 1000 kg of hazardous waste/month (Resource Conservation and Recovery Act (tracking hazardous waste)) - notification Business NAICS classification: GENERAL AUTOMOTIVE REPAIR.; AUTOMOTIVE BODY, PAINT, AND INTERIOR REPAIR AND MAINTENANCE.; ALL OTHER AUTOMOTIVE REPAIR AND MAINTENANCE. Organizations: OPERNAME (CONTACT/OPERATOR)
, BRYSON, RICHARD (CONTACT/OWNER)
Housing units lacking complete plumbing facilities: 2.0% Housing units lacking complete kitchen facilities: 0.8%
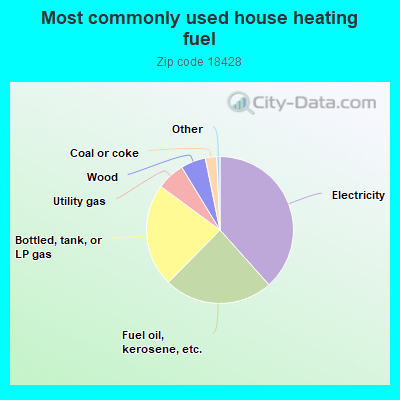
38.4%Electricity
24.0%Fuel oil, kerosene, etc.
22.7%Bottled, tank, or LP gas
6.2%Utility gas
5.5%Wood
2.5%Coal or coke
Population in 1990: 2,817. Population change in the 1990s: +6,986 (+248.0%).
Place of birth for U.S.-born residents:
This state: 4,159
Northeast: 6,802
Midwest: 154
South: 456
West: 193
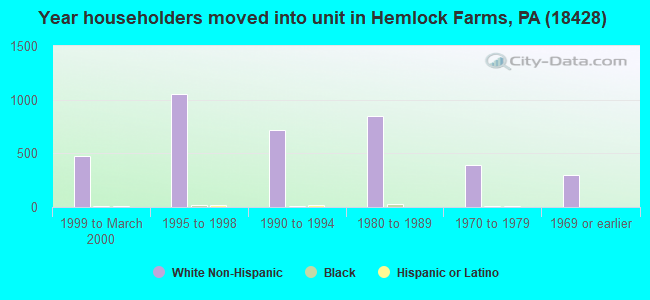
59% of the 18428 zip code residents lived in the same house 5 years ago. Out of people who lived in different houses, 23% lived in this county. Out of people who lived in different counties, 50% lived in Pennsylvania.
89% of the 18428 zip code residents lived in the same house 1 year ago. Out of people who lived in different houses, 20% moved from this county. Out of people who lived in different houses, 15% moved from different county within same state. Out of people who lived in different houses, 65% moved from different state. Out of people who lived in different houses, 2% moved from abroad.
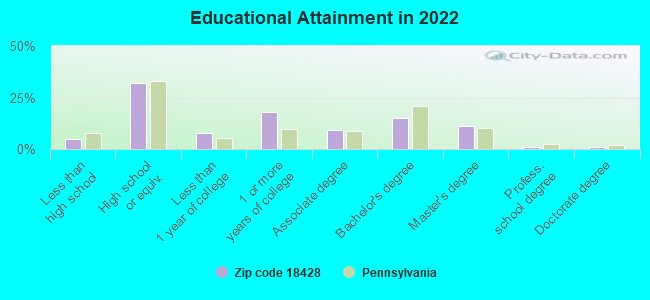
Private vs. public school enrollment:
Students in private schools in grades 1 to 8 (elementary and middle school): 21
Here:
2.7%
Pennsylvania:
15.7%
Students in private schools in grades 9 to 12 (high school): 5
Here:
0.9%
Pennsylvania:
13.4%
Students in private undergraduate colleges: 85
Here:
27.1%
Pennsylvania:
39.8%
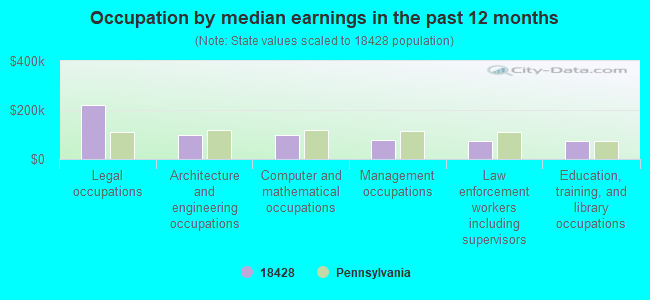
Occupation by median earnings in the past 12 months ($)
222,038Legal occupations
98,289Architecture and engineering occupations
96,540Computer and mathematical occupations
79,075Management occupations
74,608Law enforcement workers including supervisors
73,830Education, training, and library occupations
Top industries in this zip code by the number of employees in 2005:
Accommodation and Food Services: Hotels (except Casino Hotels) and Motels (500-999 employees: 1 establishment, 1-4 employees: 3 establishments)
Other Services (except Public Administration): Other Similar Organizations (except Business, Professional, Labor, and Political Organizations) (100-249: 1, 20-49: 1, 1-4: 1)
Construction: New Single-Family Housing Construction (except Operative Builders) (20-49: 3, 10-19: 2, 5-9: 3, 1-4: 11)
2003 - 2018 National Fire Incident Reporting System (NFIRS) incidents
According to the data from the years 2003 - 2018 the average number of fires per year is 24. The highest number of fires - 53 took place in 2018, and the least - 1 in 2006. The data has a growing trend.
When looking into fire subcategories, the most incidents belonged to: Structure Fires (54.8%), and Outside Fires (27.7%).
Fire incident types reported to NFIRS in Zip Code 18428

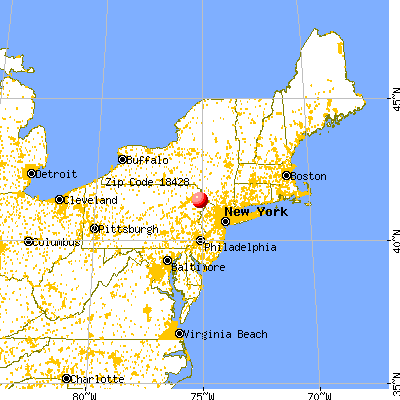


 Nearest zip codes: 18464, 18425, 18457, 18451, 18438, 18435.


 According to the data from the years 2003 - 2018 the average number of fires per year is 24. The highest number of fires - 53 took place in 2018, and the least - 1 in 2006. The data has a growing trend.
 When looking into fire subcategories, the most incidents belonged to: Structure Fires (54.8%), and Outside Fires (27.7%).