Estimated zip code population in 2022: 3,263 Zip code population in 2010: 3,733 Zip code population in 2000: 3,564
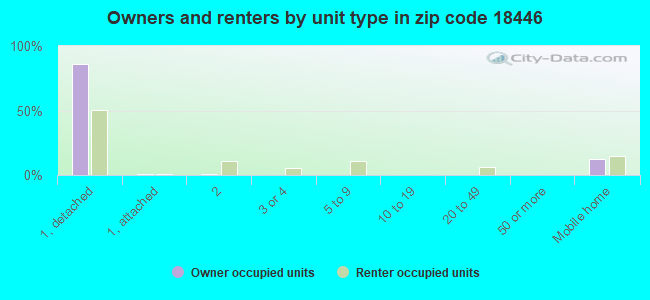
Houses and condos: 1,744 Renter-occupied apartments: 248
% of renters here:
18%
State:
31%
March 2022 cost of living index in zip code 18446: 92.4 (less than average, U.S. average is 100)
Land area: 50.8 sq. mi. Water area: 0.7 sq. mi.
Population density: 64 people per square mile
(very low).
OSM Map
General Map
Google Map
MSN Map
OSM Map
General Map
Google Map
MSN Map
OSM Map
General Map
Google Map
MSN Map
OSM Map
General Map
Google Map
MSN Map
Please wait while loading the map...
Real estate property taxes paid for housing units in 2022:
This zip code:
1.2% ($2,435)
Pennsylvania:
1.3% ($3,094)
Median real estate property taxes paid for housing units with mortgages in 2022: $2,399 (1.3%) Median real estate property taxes paid for housing units with no mortgage in 2022: $2,465 (1.1%)
Business Search- 14 Million verified businesses
Males: 1,595
(48.9%)
Females: 1,668
(51.1%)
For population 25 years and over in 18446:
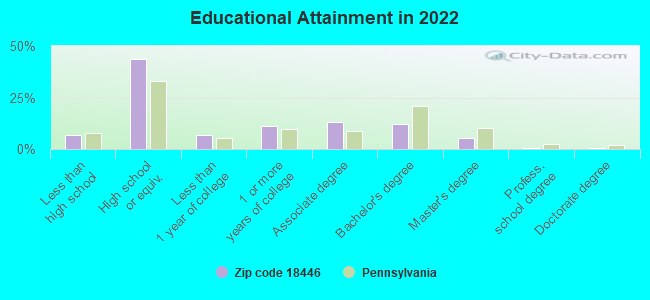
High school or higher: 92.7%
Bachelor's degree or higher: 18.7%
Graduate or professional degree: 6.5%
Unemployed: 2.2%
Mean travel time to work (commute): 27.5 minutes
For population 15 years and over in 18446:
Never married: 28.4%
Now married: 50.6%
Separated: 2.2%
Widowed: 7.9%
Divorced: 10.8%
Zip code 18446 compared to state average:
Unemployed percentage below state average.
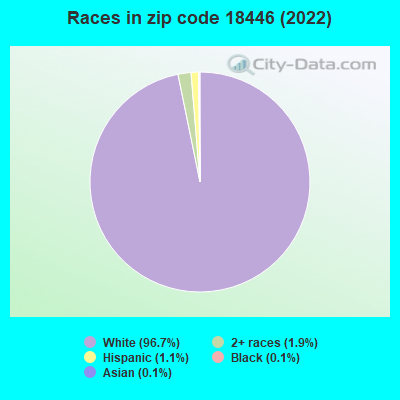
Black race population percentage significantly below state average.
Hispanic race population percentage significantly below state average.
Median age above state average.
Foreign-born population percentage significantly below state average.
Renting percentage below state average.
Length of stay since moving in significantly above state average.
Number of college students below state average.
Percentage of population with a bachelor's degree or higher below state average.
Estimated median house/condo value in 2022: $202,196
18446:
$202,196
Pennsylvania:
$245,500
According to our research of Pennsylvania and other state lists, there were 5 registered sex offenders living in 18446 zip code as of June 16, 2024. The ratio of all residents to sex offenders in zip code 18446 is 709 to 1. The ratio of registered sex offenders to all residents in this zip code is near the state average.
Median resident age:
This zip code:
46.5 years
Pennsylvania median age:
40.9 years
Average household size:
This zip code:
2.4 people
Pennsylvania:
2.4 people
Averages for the 2020 tax year for zip code 18446, filed in 2021:
Average Adjusted Gross Income (AGI) in 2020: $57,008 (Individual Income Tax Returns)
Here:
$57,008
State:
$75,707
Salary/wage: $48,026 (reported on 78.2% of returns)
Here:
$48,026
State:
$62,806
(% of AGI for various income ranges: 1091.4% for AGIs below $25k, 3464.1% for AGIs $25k-50k, 5889.0% for AGIs $50k-75k, 9400.0% for AGIs $75k-100k, 12835.0% for AGIs $100k-200k)
Taxable interest for individuals: $1,146 (reported on 27.1% of returns)
This zip code:
$1,146
Pennsylvania:
$1,633
(% of AGI for various income ranges: 11.1% for AGIs below $25k, 24.4% for AGIs $25k-50k, 42.4% for AGIs $50k-75k, 48.3% for AGIs $75k-100k, 92.9% for AGIs $100k-200k)
Ordinary dividends: $3,246 (reported on 20.6% of returns)
Here:
$3,246
State:
$7,382
(% of AGI for various income ranges: 38.9% for AGIs below $25k, 17.1% for AGIs $25k-50k, 61.4% for AGIs $50k-75k, 135.0% for AGIs $75k-100k, 269.3% for AGIs $100k-200k)
Net capital gain/loss in AGI: +$8,771 (reported on 14.1% of returns)
Here:
+$8,771
State:
+$23,522
(% of AGI for various income ranges: 18.9% for AGIs below $25k, 6.2% for AGIs $25k-50k, 57.1% for AGIs $50k-75k, 246.7% for AGIs $75k-100k, 459.3% for AGIs $100k-200k)
Profit/loss from business: +$15,148 (reported on 14.7% of returns)
Here:
+$15,148
State:
+$16,274
(% of AGI for various income ranges: 128.9% for AGIs below $25k, 161.5% for AGIs $25k-50k, 190.5% for AGIs $50k-75k, 629.2% for AGIs $75k-100k, 1165.7% for AGIs $100k-200k)
Taxable individual retirement arrangement distribution: $13,150 (reported on 10.6% of returns)
18446:
$13,150
Pennsylvania:
$18,583
(% of AGI for various income ranges: 104.3% for AGIs below $25k, 102.9% for AGIs $25k-50k, 352.4% for AGIs $50k-75k, 651.4% for AGIs $100k-200k)
Total itemized deductions: $23,300 (reported on 2.4% of returns)
Here:
$23,300
State:
$34,850
(% of AGI for various income ranges: 665.7% for AGIs $100k-200k)
Charity contributions: $7,033 (reported on 1.8% of returns)
Here:
$7,033
State:
$12,392
(% of AGI for various income ranges: 175.8% for AGIs $75k-100k)
Taxes paid: $7,250 (reported on 2.4% of returns)
18446:
$7,250
State:
$8,200
(% of AGI for various income ranges: 207.1% for AGIs $100k-200k)
Earned income credit: $1,852 (reported on 13.5% of returns)
Here:
$1,852
State:
$2,100
(% of AGI for various income ranges: 64.0% for AGIs below $25k, 59.4% for AGIs $25k-50k)
Percentage of individuals using paid preparers for their 2020 taxes: 92.9%
Here:
93%
State:
92%
(% for various income ranges: 89.1% for AGIs below $25k, 95.5% for AGIs $25k-50k, 96.3% for AGIs $50k-75k, 94.4% for AGIs $75k-100k, 95.2% for AGIs $100k-200k, 80.0% for AGIs over 200k)
Averages for the 2012 tax year for zip code 18446, filed in 2013:
Average Adjusted Gross Income (AGI) in 2012: $43,542 (Individual Income Tax Returns)
Here:
$43,542
State:
$61,346
Salary/wage: $37,076 (reported on 81.1% of returns)
Here:
$37,076
State:
$51,902
(% of AGI for various income ranges: 69.6% for AGIs below $25k, 74.8% for AGIs $25k-50k, 74.2% for AGIs $50k-75k, 76.6% for AGIs $75k-100k, 65.6% for AGIs $100k-200k, 42.5% for AGIs over 200k)
Taxable interest for individuals: $1,021 (reported on 32.0% of returns)
This zip code:
$1,021
Pennsylvania:
$1,588
(% of AGI for various income ranges: 1.3% for AGIs below $25k, 0.8% for AGIs $25k-50k, 0.8% for AGIs $50k-75k, 0.5% for AGIs $75k-100k, 0.7% for AGIs $100k-200k, 0.4% for AGIs over 200k)
Ordinary dividends: $2,215 (reported on 22.9% of returns)
Here:
$2,215
State:
$5,827
(% of AGI for various income ranges: 1.7% for AGIs below $25k, 0.8% for AGIs $25k-50k, 1.5% for AGIs $50k-75k, 0.8% for AGIs $75k-100k, 1.9% for AGIs $100k-200k)
Net capital gain/loss in AGI: +$2,500 (reported on 13.7% of returns)
Here:
+$2,500
State:
+$14,495
(% of AGI for various income ranges: 1.2% for AGIs $25k-50k, 1.5% for AGIs $50k-75k, 1.2% for AGIs $100k-200k)
Profit/loss from business: +$8,910 (reported on 16.6% of returns)
Here:
+$8,910
State:
+$16,268
(% of AGI for various income ranges: 8.9% for AGIs below $25k, 5.8% for AGIs $25k-50k, 4.1% for AGIs $50k-75k, 2.1% for AGIs $75k-100k)
Taxable individual retirement arrangement distribution: $12,375 (reported on 11.4% of returns)
18446:
$12,375
Pennsylvania:
$14,550
(% of AGI for various income ranges: 5.1% for AGIs below $25k, 2.7% for AGIs $25k-50k, 2.9% for AGIs $50k-75k, 3.0% for AGIs $75k-100k, 5.1% for AGIs $100k-200k)
Total itemized deductions: $17,194 (19% of AGI, reported on 17.7% of returns)
Here:
$17,194
State:
$23,538
Here:
19.3% of AGI
State:
18.4% of AGI
(% of AGI for various income ranges: 4.6% for AGIs below $25k, 6.3% for AGIs $25k-50k, 6.6% for AGIs $50k-75k, 7.4% for AGIs $75k-100k, 8.0% for AGIs $100k-200k, 9.2% for AGIs over 200k)
Charity contributions: $2,800 (reported on 13.7% of returns)
Here:
$2,800
State:
$4,025
(% of AGI for various income ranges: 0.7% for AGIs $25k-50k, 0.6% for AGIs $50k-75k, 1.2% for AGIs $75k-100k, 1.1% for AGIs $100k-200k, 1.8% for AGIs over 200k)
Taxes paid: $6,426 (reported on 17.7% of returns)
18446:
$6,426
State:
$9,982
(% of AGI for various income ranges: 0.9% for AGIs below $25k, 1.8% for AGIs $25k-50k, 2.1% for AGIs $50k-75k, 2.7% for AGIs $75k-100k, 3.5% for AGIs $100k-200k, 5.0% for AGIs over 200k)
Earned income credit: $1,784 (reported on 17.7% of returns)
Here:
$1,784
State:
$2,106
(% of AGI for various income ranges: 4.9% for AGIs below $25k, 0.9% for AGIs $25k-50k)
Percentage of individuals using paid preparers for their 2012 taxes: 65.1%
Here:
65%
State:
53%
(% for various income ranges: 60.0% for AGIs below $25k, 67.4% for AGIs $25k-50k, 70.4% for AGIs $50k-75k, 73.3% for AGIs $75k-100k, 66.7% for AGIs $100k-200k, 66.7% for AGIs over 200k)
Averages for the 2004 tax year for zip code 18446, filed in 2005:
Average Adjusted Gross Income (AGI) in 2004: $33,790 (Individual Income Tax Returns)
Here:
$33,790
State:
$48,049
Salary/wage: $29,760 (reported on 82.1% of returns)
Here:
$29,760
State:
$42,646
(% of AGI for various income ranges: 119.8% for AGIs below $10k, 73.3% for AGIs $10k-25k, 78.5% for AGIs $25k-50k, 76.7% for AGIs $50k-75k, 70.2% for AGIs $75k-100k, 53.6% for AGIs over 100k)
Taxable interest for individuals: $1,320 (reported on 45.0% of returns)
This zip code:
$1,320
Pennsylvania:
$1,657
(% of AGI for various income ranges: 8.9% for AGIs below $10k, 2.7% for AGIs $10k-25k, 1.1% for AGIs $25k-50k, 1.3% for AGIs $50k-75k, 1.0% for AGIs $75k-100k, 2.2% for AGIs over 100k)
Taxable dividends: $1,723 (reported on 27.5% of returns)
Here:
$1,723
State:
$3,566
(% of AGI for various income ranges: 4.1% for AGIs below $10k, 1.3% for AGIs $10k-25k, 0.5% for AGIs $25k-50k, 1.4% for AGIs $50k-75k, 0.8% for AGIs $75k-100k, 2.7% for AGIs over 100k)
Net capital gain/loss: +$3,058 (reported on 17.6% of returns)
Here:
+$3,058
State:
+$9,716
(% of AGI for various income ranges: 1.9% for AGIs below $10k, 0.7% for AGIs $10k-25k, 1.0% for AGIs $25k-50k, 1.6% for AGIs $50k-75k, 1.0% for AGIs $75k-100k, 3.4% for AGIs over 100k)
Profit/loss from business: +$10,893 (reported on 18.7% of returns)
Here:
+$10,893
State:
+$14,267
(% of AGI for various income ranges: 13.4% for AGIs below $10k, 9.1% for AGIs $10k-25k, 5.8% for AGIs $25k-50k, 6.0% for AGIs $50k-75k, 2.5% for AGIs $75k-100k, 5.7% for AGIs over 100k)
IRA payment deduction: $2,810 (reported on 3.5% of returns)
18446:
$2,810
Pennsylvania:
$2,903
Total itemized deductions: $15,744 (23% of AGI, reported on 19.6% of returns)
Here:
$15,744
State:
$18,804
Here:
23.3% of AGI
State:
19.5% of AGI
(% of AGI for various income ranges: 6.1% for AGIs $10k-25k, 8.2% for AGIs $25k-50k, 9.4% for AGIs $50k-75k, 11.2% for AGIs $75k-100k, 11.6% for AGIs over 100k)
Charity contributions deductions: $2,056 (3% of AGI, reported on 16.3% of returns)
Here:
$2,056
State:
$3,337
Here:
2.8% of AGI
State:
3.3% of AGI
(% of AGI for various income ranges: 0.3% for AGIs $10k-25k, 0.6% for AGIs $25k-50k, 1.0% for AGIs $50k-75k, 1.7% for AGIs $75k-100k, 1.7% for AGIs over 100k)
Total tax: $4,183 (reported on 73.2% of returns)
18446:
$4,183
State:
$8,008
(% of AGI for various income ranges: 4.5% for AGIs below $10k, 4.8% for AGIs $10k-25k, 6.7% for AGIs $25k-50k, 8.8% for AGIs $50k-75k, 10.8% for AGIs $75k-100k, 15.0% for AGIs over 100k)
Earned income credit: $1,533 (reported on 18.1% of returns)
Here:
$1,533
State:
$1,643
Percentage of individuals using paid preparers for their 2004 taxes: 65.6%
Here:
66%
State:
56%
(% for various income ranges: 62.5% for AGIs below $10k, 64.9% for AGIs $10k-25k, 63.5% for AGIs $25k-50k, 70.0% for AGIs $50k-75k, 73.3% for AGIs $75k-100k, 76.6% for AGIs over 100k)
Likely homosexual households (counted as self-reported same-sex unmarried-partner households)
Lesbian couples: 0.5% of all households
Gay men: 0.3% of all households
Household received Food Stamps/SNAP in the past 12 months: 218 Household did not receive Food Stamps/SNAP in the past 12 months: 1,157
Women who had a birth in the past 12 months: 46 (28 now married, 17 unmarried) Women who did not have a birth in the past 12 months: 580 (239 now married, 340 unmarried)
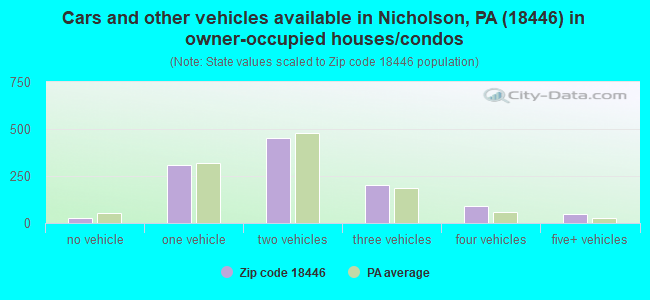
Housing units in zip code 18446 with a mortgage: 492 (46 second mortgage, 9 home equity loan, 35 both second mortgage and home equity loan) Houses without a mortgage: 63
Median monthly owner costs for units with a mortgage: $1,292 Median monthly owner costs for units without a mortgage: $547
Residents with income below the poverty level in 2022:
This zip code:
11.3%
Whole state:
11.8%
Residents with income below 50% of the poverty level in 2022:
This zip code:
5.8%
Whole state:
6.1%
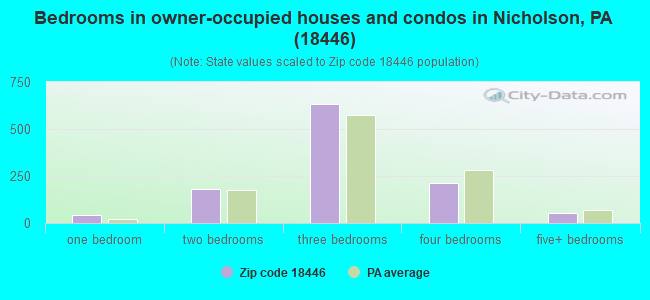
Median number of rooms in houses and condos:
Here:
6.3
State:
6.8
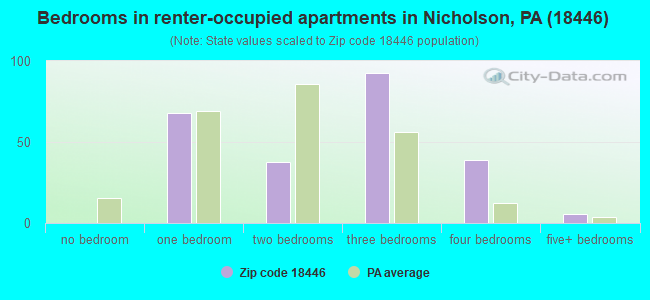
Median number of rooms in apartments:
Here:
5.3
State:
4.3
Notable locations in this zip code not listed on our city pages
Lakes, reservoirs, and swamps: Lake Sheridan (A), Cord Pond (B), Harding Pond (C), Hartley Pond (D), Tea Pond (E), Baylors Mud Pond (F), Robinson Lake (G), Spencer Pond (H). Display/hide their locations on the map
Streams, rivers, and creeks: Utley Brook (A), Monroe Creek (B), Martins Creek (C), Millard Creek (D), Field Brook (E), East Branch Tunkhannock Creek (F), Horton Creek (G), Willow Brook (H). Display/hide their locations on the map
In group quarters: 35 (-1 institutionalized population)
Size of family households: 534 2-persons, 171 3-persons, 116 4-persons, 69 5-persons, 18 6-persons, 10 7-or-more-persons
Size of nonfamily households: 381 1-person, 63 2-persons, 10 3-persons
266 married couples with children.
326 single-parent households (47 men, 279 women).
98.5% of residents of 18446 zip code speak English at home.
0.4% of residents speak Spanish at home (100% very well).
0.7% of residents speak other Indo-European language at home (91% very well, 9% not well).
0.1% of residents speak Asian or Pacific Island language at home (100% very well).
Foreign born population: 29 (0.9%) (61.7% of them are naturalized citizens)
This zip code:
0.9%
Whole state:
7.5%
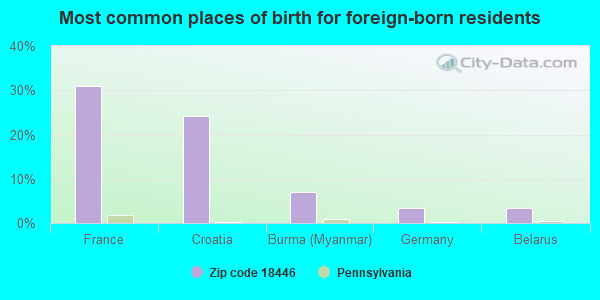
31%France
24%Croatia
7%Burma (Myanmar)
3%Germany
3%Belarus
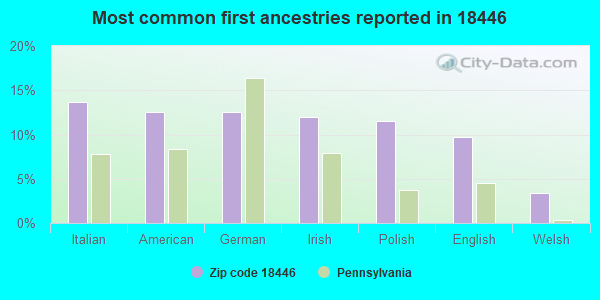
14%Italian
13%American
13%German
12%Irish
12%Polish
10%English
3%Welsh
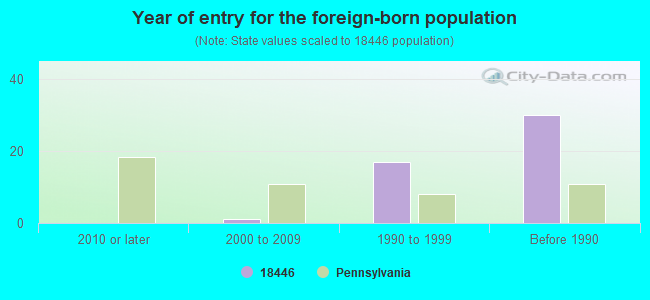
Year of entry for the foreign-born population
02010 or later
12000 to 2009
171990 to 1999
30Before 1990
Facilities with environmental interests located in this zip code:
ALS SVC INC/LENOX TWP (TAR HILL RD in LENOX, PA)
AIR MINOR (AIRS/AFS) Business SIC classification: ANIMAL SPECIALTY SERVICES, EXCEPT VETERINARY
Housing units lacking complete plumbing facilities: 1.9% Housing units lacking complete kitchen facilities: 2.3%
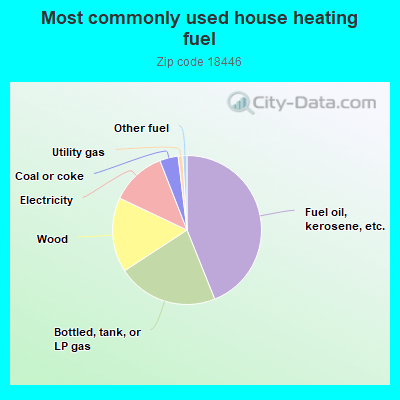
43.8%Fuel oil, kerosene, etc.
21.8%Bottled, tank, or LP gas
16.2%Wood
12.0%Electricity
4.0%Coal or coke
1.0%Utility gas
0.9%Other fuel
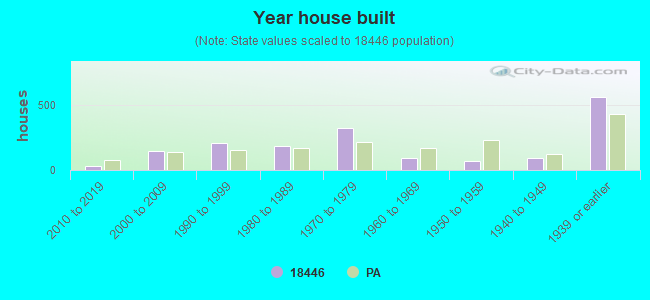
Population in 1990: 3,513. Population change in the 1990s: +51 (+1.5%).
Place of birth for U.S.-born residents:
This state: 2,654
Northeast: 347
Midwest: 81
South: 85
West: 24
70% of the 18446 zip code residents lived in the same house 5 years ago. Out of people who lived in different houses, 46% lived in this county. Out of people who lived in different counties, 50% lived in Pennsylvania.
97% of the 18446 zip code residents lived in the same house 1 year ago. Out of people who lived in different houses, 64% moved from this county. Out of people who lived in different houses, 28% moved from different county within same state. Out of people who lived in different houses, 15% moved from different state.
Private vs. public school enrollment:
Students in private schools in grades 1 to 8 (elementary and middle school): 10
Here:
3.6%
Pennsylvania:
15.7%
Students in private schools in grades 9 to 12 (high school): 10
Here:
7.9%
Pennsylvania:
13.4%
Students in private undergraduate colleges: 37
Here:
63.4%
Pennsylvania:
39.8%
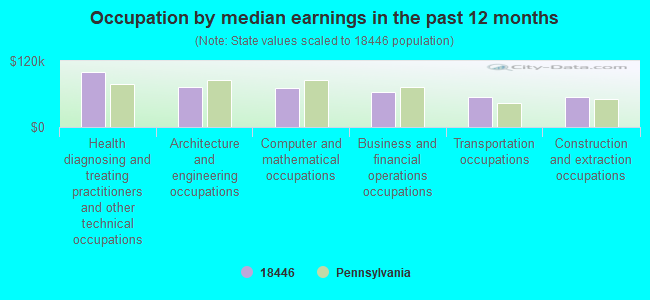
Occupation by median earnings in the past 12 months ($)
99,402Health diagnosing and treating practitioners and other technical occupations
72,985Architecture and engineering occupations
70,612Computer and mathematical occupations
63,919Business and financial operations occupations
54,451Transportation occupations
53,666Construction and extraction occupations
Top industries in this zip code by the number of employees in 2005:
Wholesale Trade: Brick, Stone, and Related Construction Material Merchant Wholesalers (50-99 employees: 1 establishment)
Finance and Insurance: Commercial Banking (10-19: 1, 5-9: 1)
Health Care and Social Assistance: All Other Outpatient Care Centers (10-19: 1)
Construction: Electrical Contractors (10-19: 1)
Mining: Dimension Stone Mining and Quarrying (5-9: 1, 1-4: 4)
Accommodation and Food Services: Full-Service Restaurants (5-9: 1, 1-4: 1)
People in group quarters in 2010:
23 people in group homes intended for adults
Fatal accident statistics in 2014:
Fatal accident count: 3
Vehicles involved in fatal accidents: 5
Fatal accidents caused by drunken drivers: 1
Fatalities: 3
Persons involved in fatal accidents: 6
Pedestrians involved in fatal accidents: 0
Fatal accident statistics in 2012:
Fatal accident count: 1
Vehicles involved in fatal accidents: 7
Fatal accidents caused by drunken drivers: 0
Fatalities: 1
Persons involved in fatal accidents: 7
Pedestrians involved in fatal accidents: 0
Most common first names in zip code 18446 among deceased individuals
Name
Count
Lived (average)
John
27
77.7 years
William
26
71.2 years
Robert
23
67.8 years
Mary
21
81.6 years
Margaret
20
79.1 years
Helen
18
80.8 years
Charles
16
71.7 years
Joseph
15
71.9 years
Ruth
13
78.1 years
James
13
61.4 years
Most common last names in zip code 18446 among deceased individuals
Last name
Count
Lived (average)
Johnson
11
83.8 years
Cook
9
83.1 years
Oakley
9
76.8 years
Davis
9
81.3 years
Ross
9
75.4 years
Miller
9
79.0 years
Price
8
80.9 years
Squier
8
79.6 years
Ransom
7
77.4 years
Smith
7
70.7 years
Businesses in zip code 18446
True Value: 1
Discuss Nicholson, Pennsylvania (PA) on our hugely popular Pennsylvania forum.


 Nearest zip codes: 18824, 18420, 18419, 18826, 18414, 18823.