Estimated zip code population in 2022: 5,743 Zip code population in 2010: 5,388 Zip code population in 2000: 5,054
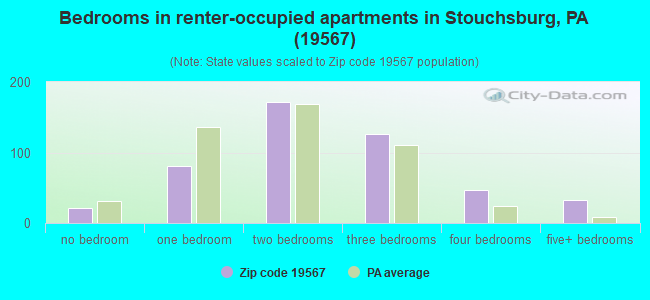
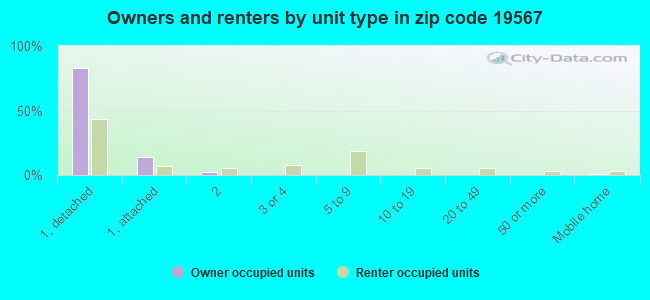
Houses and condos: 2,102 Renter-occupied apartments: 484
% of renters here:
24%
State:
31%
March 2022 cost of living index in zip code 19567: 95.3 (near average, U.S. average is 100)
Land area: 22.6 sq. mi. Water area: 0.1 sq. mi.
Population density: 254 people per square mile
(very low).
OSM Map
General Map
Google Map
MSN Map
OSM Map
General Map
Google Map
MSN Map
OSM Map
General Map
Google Map
MSN Map
OSM Map
General Map
Google Map
MSN Map
Please wait while loading the map...
Real estate property taxes paid for housing units in 2022:
This zip code:
1.6% ($3,893)
Pennsylvania:
1.3% ($3,094)
Median real estate property taxes paid for housing units with mortgages in 2022: $3,561 (1.5%) Median real estate property taxes paid for housing units with no mortgage in 2022: $5,105 (2.1%)
Business Search- 14 Million verified businesses
Males: 2,785
(48.5%)
Females: 2,958
(51.5%)
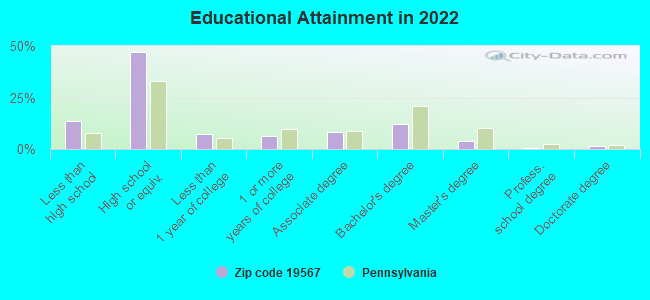
For population 25 years and over in 19567:
High school or higher: 84.6%
Bachelor's degree or higher: 17.1%
Graduate or professional degree: 5.4%
Unemployed: 2.6%
Mean travel time to work (commute): 23.8 minutes
For population 15 years and over in 19567:
Never married: 31.9%
Now married: 55.3%
Separated: 0.6%
Widowed: 5.0%
Divorced: 7.2%
Zip code 19567 compared to state average:
Black race population percentage significantly below state average.
Median age below state average.
Foreign-born population percentage significantly below state average.
Length of stay since moving in above state average.
Number of college students below state average.
Percentage of population with a bachelor's degree or higher below state average.
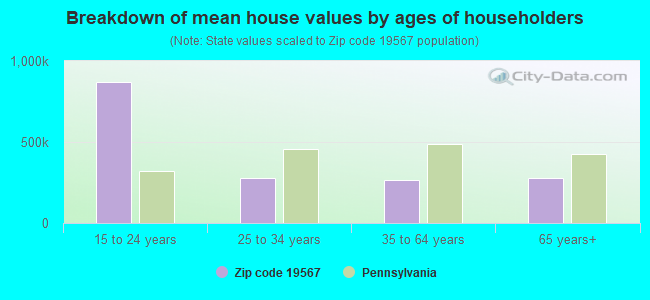
Estimated median house/condo value in 2022: $239,639
19567:
$239,639
Pennsylvania:
$245,500
According to our research of Pennsylvania and other state lists, there were 6 registered sex offenders living in 19567 zip code as of June 15, 2024. The ratio of all residents to sex offenders in zip code 19567 is 866 to 1. The ratio of registered sex offenders to all residents in this zip code is lower than the state average.
Median resident age:
This zip code:
35.2 years
Pennsylvania median age:
40.9 years
Average household size:
This zip code:
2.8 people
Pennsylvania:
2.4 people
Averages for the 2020 tax year for zip code 19567, filed in 2021:
Average Adjusted Gross Income (AGI) in 2020: $62,084 (Individual Income Tax Returns)
Here:
$62,084
State:
$75,707
Salary/wage: $50,547 (reported on 77.2% of returns)
Here:
$50,547
State:
$62,806
(% of AGI for various income ranges: 1058.0% for AGIs below $25k, 3800.9% for AGIs $25k-50k, 6172.0% for AGIs $50k-75k, 8978.7% for AGIs $75k-100k, 13661.6% for AGIs $100k-200k)
Taxable interest for individuals: $1,780 (reported on 32.4% of returns)
This zip code:
$1,780
Pennsylvania:
$1,633
(% of AGI for various income ranges: 25.9% for AGIs below $25k, 56.9% for AGIs $25k-50k, 66.9% for AGIs $50k-75k, 91.7% for AGIs $75k-100k, 213.6% for AGIs $100k-200k)
Ordinary dividends: $3,648 (reported on 20.6% of returns)
Here:
$3,648
State:
$7,382
(% of AGI for various income ranges: 38.9% for AGIs below $25k, 41.1% for AGIs $25k-50k, 85.4% for AGIs $50k-75k, 206.5% for AGIs $75k-100k, 247.2% for AGIs $100k-200k)
Net capital gain/loss in AGI: +$10,910 (reported on 17.1% of returns)
Here:
+$10,910
State:
+$23,522
(% of AGI for various income ranges: 0.2% for AGIs below $25k, 50.9% for AGIs $25k-50k, 82.3% for AGIs $50k-75k, 214.3% for AGIs $75k-100k, 592.0% for AGIs $100k-200k)
Profit/loss from business: +$14,516 (reported on 11.4% of returns)
Here:
+$14,516
State:
+$16,274
(% of AGI for various income ranges: 129.1% for AGIs below $25k, 123.0% for AGIs $25k-50k, 168.0% for AGIs $50k-75k, 301.3% for AGIs $75k-100k, 842.4% for AGIs $100k-200k)
Taxable individual retirement arrangement distribution: $14,313 (reported on 13.5% of returns)
19567:
$14,313
Pennsylvania:
$18,583
(% of AGI for various income ranges: 137.8% for AGIs below $25k, 179.8% for AGIs $25k-50k, 208.3% for AGIs $50k-75k, 270.9% for AGIs $75k-100k, 992.8% for AGIs $100k-200k)
Total itemized deductions: $33,219 (reported on 5.7% of returns)
Here:
$33,219
State:
$34,850
(% of AGI for various income ranges: 192.4% for AGIs $25k-50k, 230.6% for AGIs $50k-75k, 227.0% for AGIs $75k-100k, 517.6% for AGIs $100k-200k)
Charity contributions: $14,167 (reported on 4.3% of returns)
Here:
$14,167
State:
$12,392
(% of AGI for various income ranges: 98.0% for AGIs $50k-75k, 176.8% for AGIs $100k-200k)
Taxes paid: $7,794 (reported on 5.7% of returns)
19567:
$7,794
State:
$8,200
(% of AGI for various income ranges: 37.6% for AGIs $25k-50k, 64.6% for AGIs $50k-75k, 92.2% for AGIs $75k-100k, 160.4% for AGIs $100k-200k)
Earned income credit: $1,926 (reported on 9.6% of returns)
Here:
$1,926
State:
$2,100
(% of AGI for various income ranges: 58.3% for AGIs below $25k, 46.7% for AGIs $25k-50k)
Percentage of individuals using paid preparers for their 2020 taxes: 93.2%
Here:
93%
State:
92%
(% for various income ranges: 90.8% for AGIs below $25k, 96.0% for AGIs $25k-50k, 93.8% for AGIs $50k-75k, 91.4% for AGIs $75k-100k, 92.7% for AGIs $100k-200k, 100.0% for AGIs over 200k)
Averages for the 2012 tax year for zip code 19567, filed in 2013:
Average Adjusted Gross Income (AGI) in 2012: $45,767 (Individual Income Tax Returns)
Here:
$45,767
State:
$61,346
Salary/wage: $41,284 (reported on 81.1% of returns)
Here:
$41,284
State:
$51,902
(% of AGI for various income ranges: 69.4% for AGIs below $25k, 78.4% for AGIs $25k-50k, 75.8% for AGIs $50k-75k, 74.1% for AGIs $75k-100k, 66.5% for AGIs $100k-200k)
Taxable interest for individuals: $1,390 (reported on 34.5% of returns)
This zip code:
$1,390
Pennsylvania:
$1,588
(% of AGI for various income ranges: 1.3% for AGIs below $25k, 0.9% for AGIs $25k-50k, 0.9% for AGIs $50k-75k, 1.0% for AGIs $75k-100k, 1.3% for AGIs $100k-200k)
Ordinary dividends: $2,041 (reported on 20.5% of returns)
Here:
$2,041
State:
$5,827
(% of AGI for various income ranges: 1.7% for AGIs below $25k, 0.7% for AGIs $25k-50k, 0.8% for AGIs $50k-75k, 0.6% for AGIs $75k-100k, 1.2% for AGIs $100k-200k)
Net capital gain/loss in AGI: +$3,895 (reported on 14.4% of returns)
Here:
+$3,895
State:
+$14,495
(% of AGI for various income ranges: 1.0% for AGIs $25k-50k, 1.3% for AGIs $50k-75k, 1.5% for AGIs $75k-100k, 1.5% for AGIs $100k-200k)
Profit/loss from business: +$10,503 (reported on 12.1% of returns)
Here:
+$10,503
State:
+$16,268
(% of AGI for various income ranges: 5.7% for AGIs below $25k, 3.2% for AGIs $25k-50k, 3.6% for AGIs $50k-75k, 2.9% for AGIs $75k-100k, 0.5% for AGIs $100k-200k)
Taxable individual retirement arrangement distribution: $11,353 (reported on 12.1% of returns)
19567:
$11,353
Pennsylvania:
$14,550
(% of AGI for various income ranges: 4.9% for AGIs below $25k, 2.2% for AGIs $25k-50k, 3.2% for AGIs $50k-75k, 2.6% for AGIs $75k-100k, 3.2% for AGIs $100k-200k)
Total itemized deductions: $17,054 (23% of AGI, reported on 29.9% of returns)
Here:
$17,054
State:
$23,538
Here:
22.9% of AGI
State:
18.4% of AGI
(% of AGI for various income ranges: 7.9% for AGIs below $25k, 8.9% for AGIs $25k-50k, 11.8% for AGIs $50k-75k, 12.5% for AGIs $75k-100k, 12.7% for AGIs $100k-200k)
Charity contributions: $3,012 (reported on 22.0% of returns)
Here:
$3,012
State:
$4,025
(% of AGI for various income ranges: 0.5% for AGIs below $25k, 1.1% for AGIs $25k-50k, 1.4% for AGIs $50k-75k, 1.3% for AGIs $75k-100k, 2.2% for AGIs $100k-200k)
Taxes paid: $6,532 (reported on 30.3% of returns)
19567:
$6,532
State:
$9,982
(% of AGI for various income ranges: 2.0% for AGIs below $25k, 3.0% for AGIs $25k-50k, 4.3% for AGIs $50k-75k, 5.0% for AGIs $75k-100k, 5.8% for AGIs $100k-200k)
Earned income credit: $2,031 (reported on 13.3% of returns)
Here:
$2,031
State:
$2,106
(% of AGI for various income ranges: 4.6% for AGIs below $25k, 0.8% for AGIs $25k-50k)
Percentage of individuals using paid preparers for their 2012 taxes: 58.7%
Here:
59%
State:
53%
(% for various income ranges: 52.1% for AGIs below $25k, 57.9% for AGIs $25k-50k, 65.9% for AGIs $50k-75k, 64.3% for AGIs $75k-100k, 68.2% for AGIs $100k-200k)
Averages for the 2004 tax year for zip code 19567, filed in 2005:
Average Adjusted Gross Income (AGI) in 2004: $38,207 (Individual Income Tax Returns)
Here:
$38,207
State:
$48,049
Salary/wage: $36,096 (reported on 84.2% of returns)
Here:
$36,096
State:
$42,646
(% of AGI for various income ranges: 103.9% for AGIs below $10k, 71.8% for AGIs $10k-25k, 82.7% for AGIs $25k-50k, 85.2% for AGIs $50k-75k, 82.1% for AGIs $75k-100k, 63.6% for AGIs over 100k)
Taxable interest for individuals: $1,053 (reported on 48.5% of returns)
This zip code:
$1,053
Pennsylvania:
$1,657
(% of AGI for various income ranges: 6.4% for AGIs below $10k, 2.9% for AGIs $10k-25k, 1.6% for AGIs $25k-50k, 0.6% for AGIs $50k-75k, 0.9% for AGIs $75k-100k, 1.1% for AGIs over 100k)
Taxable dividends: $1,282 (reported on 24.4% of returns)
Here:
$1,282
State:
$3,566
(% of AGI for various income ranges: 6.2% for AGIs below $10k, 2.0% for AGIs $10k-25k, 0.9% for AGIs $25k-50k, 0.4% for AGIs $50k-75k, 0.3% for AGIs $75k-100k, 0.8% for AGIs over 100k)
Net capital gain/loss: +$7,118 (reported on 15.7% of returns)
Here:
+$7,118
State:
+$9,716
(% of AGI for various income ranges: -2.8% for AGIs below $10k, -0.3% for AGIs $10k-25k, 1.7% for AGIs $25k-50k, 1.2% for AGIs $50k-75k, 1.5% for AGIs $75k-100k, 12.4% for AGIs over 100k)
Profit/loss from business: +$12,209 (reported on 12.9% of returns)
Here:
+$12,209
State:
+$14,267
(% of AGI for various income ranges: 6.8% for AGIs below $10k, 4.8% for AGIs $10k-25k, 4.2% for AGIs $25k-50k, 3.8% for AGIs $50k-75k, 4.6% for AGIs $75k-100k, 3.4% for AGIs over 100k)
Profit/loss from farming: +$8,917 (reported on 2.9% of returns)
Here:
+$8,917
State:
+$274
(% of AGI for various income ranges: -4.3% for AGIs below $10k, 0.9% for AGIs $10k-25k, 0.9% for AGIs $25k-50k, 1.4% for AGIs $50k-75k)
IRA payment deduction: $2,888 (reported on 3.9% of returns)
19567:
$2,888
Pennsylvania:
$2,903
(% of AGI for various income ranges: 0.5% for AGIs $10k-25k, 0.3% for AGIs $25k-50k, 0.4% for AGIs $50k-75k, 0.3% for AGIs over 100k)
Total itemized deductions: $14,706 (23% of AGI, reported on 29.8% of returns)
Here:
$14,706
State:
$18,804
Here:
22.6% of AGI
State:
19.5% of AGI
(% of AGI for various income ranges: 7.9% for AGIs below $10k, 6.6% for AGIs $10k-25k, 9.9% for AGIs $25k-50k, 12.6% for AGIs $50k-75k, 13.7% for AGIs $75k-100k, 13.4% for AGIs over 100k)
Charity contributions deductions: $2,682 (4% of AGI, reported on 24.1% of returns)
Here:
$2,682
State:
$3,337
Here:
3.9% of AGI
State:
3.3% of AGI
(% of AGI for various income ranges: 1.1% for AGIs below $10k, 0.7% for AGIs $10k-25k, 0.9% for AGIs $25k-50k, 1.4% for AGIs $50k-75k, 2.1% for AGIs $75k-100k, 3.9% for AGIs over 100k)
Total tax: $4,581 (reported on 76.0% of returns)
19567:
$4,581
State:
$8,008
(% of AGI for various income ranges: 2.8% for AGIs below $10k, 4.6% for AGIs $10k-25k, 7.3% for AGIs $25k-50k, 8.2% for AGIs $50k-75k, 10.3% for AGIs $75k-100k, 16.3% for AGIs over 100k)
Earned income credit: $1,424 (reported on 9.8% of returns)
Here:
$1,424
State:
$1,643
Percentage of individuals using paid preparers for their 2004 taxes: 61.3%
Here:
61%
State:
56%
(% for various income ranges: 53.8% for AGIs below $10k, 62.8% for AGIs $10k-25k, 60.5% for AGIs $25k-50k, 62.9% for AGIs $50k-75k, 68.5% for AGIs $75k-100k, 77.7% for AGIs over 100k)
Household received Food Stamps/SNAP in the past 12 months: 92 Household did not receive Food Stamps/SNAP in the past 12 months: 1,921
Women who had a birth in the past 12 months: 50 (51 now married, 2 unmarried) Women who did not have a birth in the past 12 months: 1,215 (473 now married, 742 unmarried)
Housing units in zip code 19567 with a mortgage: 842 (134 second mortgage, 112 both second mortgage and home equity loan) Houses without a mortgage: 50
Median monthly owner costs for units with a mortgage: $1,533 Median monthly owner costs for units without a mortgage: $689
Residents with income below the poverty level in 2022:
This zip code:
5.5%
Whole state:
11.8%
Residents with income below 50% of the poverty level in 2022:
This zip code:
1.9%
Whole state:
6.1%
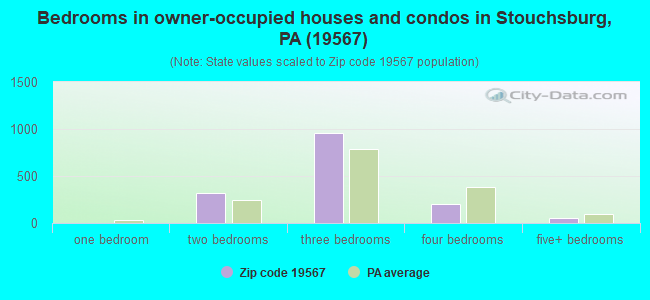
Median number of rooms in houses and condos:
Here:
6.2
State:
6.8
Median number of rooms in apartments:
Here:
5.0
State:
4.3
Notable locations in this zip code not listed on our city pages
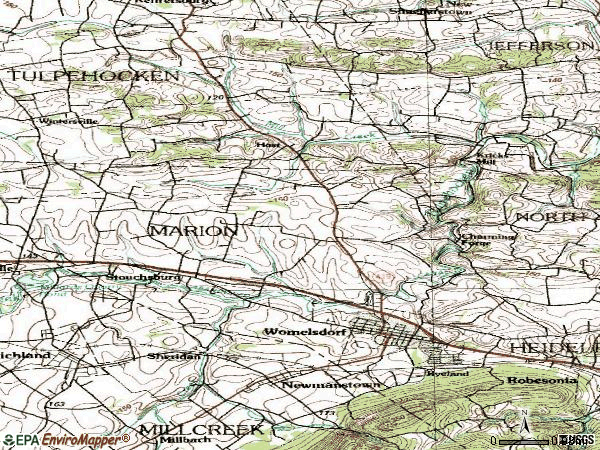
Notable locations in zip code 19567: Womelsdorf Rod and Gun Club (A), Womelsdorf Station (B), Bethany Orphan Home (C), Charming Forge (D), Marion Fire Company Stouchsburg (E), Park Court Apartments (F), Scheetz House (G), Williamson Lodge Number 307 (H), Womelsdorf Public Library (I), Womelsdorf Town Hall (J), Womelsdorf VFW Post 6558 (K), Womelsdorf Volunteer Fire Company (L), Womelsdorf Volunteer Fire Company Hall (M). Display/hide their locations on the map
Churches in zip code 19567 include: Zion United Church of Christ (A), Zion Lutheran Church (B), Womelsdorf Mennonite Church (C), Martins Mennonite Church (D), Christ Lutheran Church (E). Display/hide their locations on the map
Cemeteries: Reeds Cemetery (1), United Evangelical Church Cemetery (2), Womelsdorf Union Cemetery (3), Christ Lutheran Church Cemetery (4), Conrad Weiser Gravesite (5). Display/hide their locations on the map
Parks in zip code 19567 include: Mill Creek Park (1), Town Park (2), Conrad Weiser Park (3), Marion Township Park (4), Womelsdorf Ball Field (5). Display/hide their locations on the map
In group quarters: 114 (-1 institutionalized population)
Size of family households: 606 2-persons, 279 3-persons, 367 4-persons, 111 5-persons, 58 6-persons, 63 7-or-more-persons
Size of nonfamily households: 417 1-person, 112 2-persons
1,071 married couples with children.
329 single-parent households (219 men, 110 women).
96.4% of residents of 19567 zip code speak English at home.
1.3% of residents speak Spanish at home (35% very well, 1% well, 64% not well).
1.1% of residents speak other Indo-European language at home (26% very well, 70% well, 4% not well).
0.5% of residents speak Asian or Pacific Island language at home (100% very well).
0.1% of residents speak other language at home (100% very well).
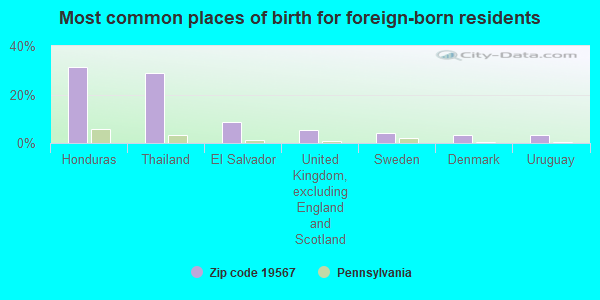
Foreign born population: 93 (1.6%) (69.8% of them are naturalized citizens)
This zip code:
1.6%
Whole state:
7.5%
31%Honduras
29%Thailand
9%El Salvador
5%United Kingdom, excluding England and Scotland
4%Sweden
3%Denmark
3%Uruguay
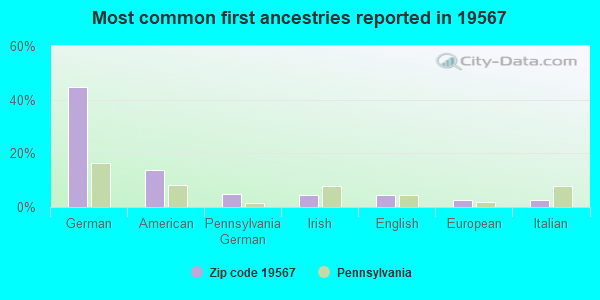
45%German
14%American
5%Pennsylvania German
5%Irish
4%English
3%European
3%Italian
Year of entry for the foreign-born population
552010 or later
372000 to 2009
01990 to 1999
57Before 1990
Housing units lacking complete kitchen facilities: 0.8%
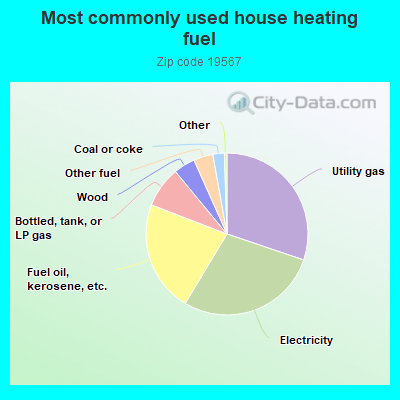
30.3%Utility gas
28.5%Electricity
22.3%Fuel oil, kerosene, etc.
8.2%Bottled, tank, or LP gas
4.3%Wood
3.9%Other fuel
2.3%Coal or coke
Population in 1990: 4,034. Population change in the 1990s: +1,020 (+25.3%).
Place of birth for U.S.-born residents:
This state: 4,931
Northeast: 295
Midwest: 61
South: 219
West: 48
63% of the 19567 zip code residents lived in the same house 5 years ago. Out of people who lived in different houses, 62% lived in this county. Out of people who lived in different counties, 50% lived in Pennsylvania.
91% of the 19567 zip code residents lived in the same house 1 year ago. Out of people who lived in different houses, 60% moved from this county. Out of people who lived in different houses, 27% moved from different county within same state. Out of people who lived in different houses, 11% moved from different state.
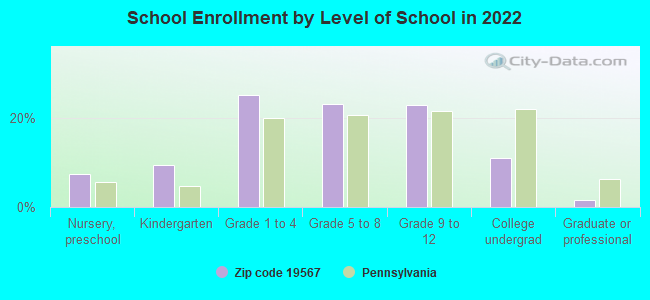
Private vs. public school enrollment:
Students in private schools in grades 1 to 8 (elementary and middle school): 83
Here:
16.2%
Pennsylvania:
15.7%
Students in private schools in grades 9 to 12 (high school): 33
Here:
14.0%
Pennsylvania:
13.4%
Students in private undergraduate colleges: 35
Here:
29.5%
Pennsylvania:
39.8%
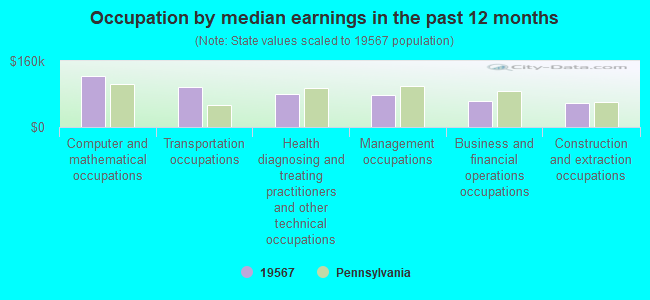
Occupation by median earnings in the past 12 months ($)
123,391Computer and mathematical occupations
96,263Transportation occupations
80,013Health diagnosing and treating practitioners and other technical occupations
76,490Management occupations
63,543Business and financial operations occupations
58,836Construction and extraction occupations
Top industries in this zip code by the number of employees in 2005:
Health Care and Social Assistance: Other Residential Care Facilities (100-249 employees: 1 establishment)
Accommodation and Food Services: Full-Service Restaurants (20-49: 3)
Health Care and Social Assistance: Offices of Physicians (except Mental Health Specialists) (20-49: 1)
People in group quarters in 2010:
66 people in group homes for juveniles (non-correctional)
30 people in workers' group living quarters and job corps centers
15 people in group homes intended for adults
People in group quarters in 2000:
90 people in homes for abused, dependent, and neglected children
37 people in other noninstitutional group quarters
18 people in nursing homes
8 people in schools, hospitals, or wards for the intellectually disabled
4 people in other nonhousehold living situations
Fatal accident statistics in 2014:
Fatal accident count: 1
Vehicles involved in fatal accidents: 1
Fatal accidents caused by drunken drivers: 1
Fatalities: 1
Persons involved in fatal accidents: 1
Pedestrians involved in fatal accidents: 1
Fatal accident statistics in 2012:
Fatal accident count: 3
Vehicles involved in fatal accidents: 10
Fatal accidents caused by drunken drivers: 1
Fatalities: 3
Persons involved in fatal accidents: 13
Pedestrians involved in fatal accidents: 0
Home Mortgage Disclosure Act Aggregated Statistics For Year 2009 (Based on 4 partial tracts)
A) FHA, FSA/RHS & VA Home Purchase Loans
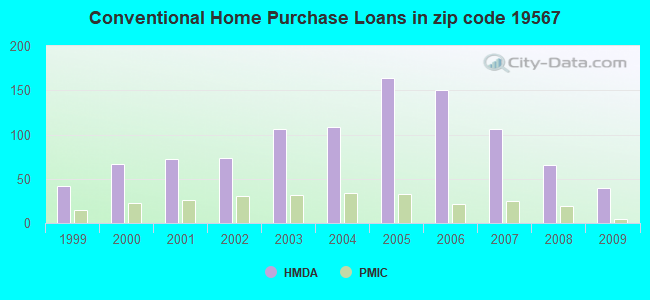
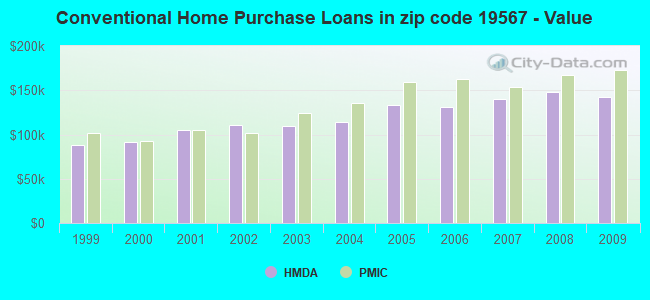
B) Conventional Home Purchase Loans
C) Refinancings
D) Home Improvement Loans
E) Loans on Dwellings For 5+ Families
F) Non-occupant Loans on < 5 Family Dwellings (A B C & D)
G) Loans On Manufactured Home Dwelling (A B C & D)
Number
Average Value
Number
Average Value
Number
Average Value
Number
Average Value
Number
Average Value
Number
Average Value
Number
Average Value
LOANS ORIGINATED
33
$147,796
39
$142,166
171
$146,059
22
$68,479
1
$349,460
8
$149,449
4
$79,165
APPLICATIONS APPROVED, NOT ACCEPTED
0
$0
3
$209,410
13
$165,138
5
$29,800
0
$0
0
$0
1
$79,670
APPLICATIONS DENIED
4
$145,695
4
$129,132
59
$179,245
7
$15,204
0
$0
2
$146,055
1
$142,250
APPLICATIONS WITHDRAWN
1
$150,610
5
$152,934
38
$154,889
4
$84,712
0
$0
1
$34,390
0
$0
FILES CLOSED FOR INCOMPLETENESS
1
$77,770
0
$0
7
$161,076
0
$0
0
$0
0
$0
0
$0
Aggregated Statistics For Year 2008 (Based on 4 partial tracts)
A) FHA, FSA/RHS & VA Home Purchase Loans
B) Conventional Home Purchase Loans
C) Refinancings
D) Home Improvement Loans
E) Loans on Dwellings For 5+ Families
F) Non-occupant Loans on < 5 Family Dwellings (A B C & D)
G) Loans On Manufactured Home Dwelling (A B C & D)
Number
Average Value
Number
Average Value
Number
Average Value
Number
Average Value
Number
Average Value
Number
Average Value
Number
Average Value
LOANS ORIGINATED
23
$156,879
65
$147,490
134
$121,350
32
$46,923
2
$123,350
19
$120,921
3
$63,433
APPLICATIONS APPROVED, NOT ACCEPTED
1
$220,010
7
$127,220
20
$123,986
4
$12,648
0
$0
1
$142,730
1
$30,950
APPLICATIONS DENIED
4
$164,012
8
$125,438
95
$156,396
21
$87,831
0
$0
5
$143,050
3
$114,257
APPLICATIONS WITHDRAWN
3
$166,553
5
$141,150
31
$138,715
7
$78,870
0
$0
0
$0
0
$0
FILES CLOSED FOR INCOMPLETENESS
1
$226,770
1
$193,430
10
$164,153
0
$0
0
$0
0
$0
0
$0
Aggregated Statistics For Year 2007 (Based on 4 partial tracts)
A) FHA, FSA/RHS & VA Home Purchase Loans
B) Conventional Home Purchase Loans
C) Refinancings
D) Home Improvement Loans
E) Loans on Dwellings For 5+ Families
F) Non-occupant Loans on < 5 Family Dwellings (A B C & D)
G) Loans On Manufactured Home Dwelling (A B C & D)
Number
Average Value
Number
Average Value
Number
Average Value
Number
Average Value
Number
Average Value
Number
Average Value
Number
Average Value
LOANS ORIGINATED
6
$157,837
106
$140,463
141
$113,671
46
$42,970
1
$310,090
12
$115,311
4
$74,660
APPLICATIONS APPROVED, NOT ACCEPTED
0
$0
9
$128,130
32
$109,025
8
$41,184
0
$0
1
$205,250
1
$70,500
APPLICATIONS DENIED
0
$0
17
$134,905
107
$135,693
26
$48,516
1
$315,990
5
$63,176
5
$73,130
APPLICATIONS WITHDRAWN
0
$0
8
$178,600
44
$140,975
4
$86,678
0
$0
2
$165,925
1
$40,700
FILES CLOSED FOR INCOMPLETENESS
0
$0
3
$226,997
12
$163,186
0
$0
0
$0
1
$153,620
0
$0
Aggregated Statistics For Year 2006 (Based on 4 partial tracts)
A) FHA, FSA/RHS & VA Home Purchase Loans
B) Conventional Home Purchase Loans
C) Refinancings
D) Home Improvement Loans
E) Loans on Dwellings For 5+ Families
F) Non-occupant Loans on < 5 Family Dwellings (A B C & D)
G) Loans On Manufactured Home Dwelling (A B C & D)
Number
Average Value
Number
Average Value
Number
Average Value
Number
Average Value
Number
Average Value
Number
Average Value
Number
Average Value
LOANS ORIGINATED
12
$132,668
150
$130,825
166
$105,582
66
$35,639
1
$321,100
18
$128,465
3
$78,687
APPLICATIONS APPROVED, NOT ACCEPTED
0
$0
15
$112,228
30
$148,221
6
$77,738
0
$0
3
$107,787
1
$29,740
APPLICATIONS DENIED
2
$214,310
29
$109,522
135
$129,256
28
$30,180
0
$0
10
$112,095
5
$81,852
APPLICATIONS WITHDRAWN
1
$90,560
12
$143,371
75
$140,847
4
$49,450
0
$0
5
$92,982
0
$0
FILES CLOSED FOR INCOMPLETENESS
1
$133,560
7
$87,237
11
$181,414
1
$53,650
0
$0
1
$58,570
0
$0
Aggregated Statistics For Year 2005 (Based on 4 partial tracts)
A) FHA, FSA/RHS & VA Home Purchase Loans
B) Conventional Home Purchase Loans
C) Refinancings
D) Home Improvement Loans
F) Non-occupant Loans on < 5 Family Dwellings (A B C & D)
G) Loans On Manufactured Home Dwelling (A B C & D)
Number
Average Value
Number
Average Value
Number
Average Value
Number
Average Value
Number
Average Value
Number
Average Value
LOANS ORIGINATED
5
$124,782
164
$133,467
203
$99,645
43
$33,727
26
$87,705
4
$56,798
APPLICATIONS APPROVED, NOT ACCEPTED
0
$0
10
$140,153
36
$112,014
6
$41,890
2
$78,460
0
$0
APPLICATIONS DENIED
0
$0
28
$146,826
130
$117,276
26
$31,033
7
$54,393
2
$28,945
APPLICATIONS WITHDRAWN
0
$0
18
$154,300
93
$131,586
11
$105,194
2
$95,890
1
$34,390
FILES CLOSED FOR INCOMPLETENESS
0
$0
7
$104,044
11
$111,164
0
$0
0
$0
0
$0
Aggregated Statistics For Year 2004 (Based on 4 partial tracts)
A) FHA, FSA/RHS & VA Home Purchase Loans
B) Conventional Home Purchase Loans
C) Refinancings
D) Home Improvement Loans
E) Loans on Dwellings For 5+ Families
F) Non-occupant Loans on < 5 Family Dwellings (A B C & D)
G) Loans On Manufactured Home Dwelling (A B C & D)
Number
Average Value
Number
Average Value
Number
Average Value
Number
Average Value
Number
Average Value
Number
Average Value
Number
Average Value
LOANS ORIGINATED
7
$120,450
108
$114,440
207
$96,117
43
$32,027
1
$632,970
16
$75,224
3
$63,747
APPLICATIONS APPROVED, NOT ACCEPTED
0
$0
10
$95,805
35
$103,102
5
$34,814
0
$0
1
$64,200
3
$77,613
APPLICATIONS DENIED
1
$72,220
21
$86,412
113
$102,677
20
$41,004
0
$0
7
$43,911
7
$73,237
APPLICATIONS WITHDRAWN
1
$95,720
5
$144,202
76
$103,689
9
$36,789
0
$0
3
$56,367
2
$61,045
FILES CLOSED FOR INCOMPLETENESS
0
$0
3
$149,543
27
$118,504
0
$0
0
$0
1
$90,570
0
$0
Aggregated Statistics For Year 2003 (Based on 4 partial tracts)
A) FHA, FSA/RHS & VA Home Purchase Loans
B) Conventional Home Purchase Loans
C) Refinancings
D) Home Improvement Loans
E) Loans on Dwellings For 5+ Families
F) Non-occupant Loans on < 5 Family Dwellings (A B C & D)
Number
Average Value
Number
Average Value
Number
Average Value
Number
Average Value
Number
Average Value
Number
Average Value
LOANS ORIGINATED
9
$92,959
106
$110,159
337
$94,554
29
$25,230
2
$197,170
19
$82,137
APPLICATIONS APPROVED, NOT ACCEPTED
0
$0
13
$112,768
51
$99,405
5
$29,588
0
$0
2
$83,025
APPLICATIONS DENIED
1
$86,630
11
$93,576
97
$107,417
10
$23,880
0
$0
1
$48,240
APPLICATIONS WITHDRAWN
1
$79,240
7
$124,971
66
$114,276
2
$31,660
0
$0
1
$38,980
FILES CLOSED FOR INCOMPLETENESS
0
$0
3
$74,220
9
$111,771
3
$26,890
0
$0
1
$46,270
Aggregated Statistics For Year 2002 (Based on 4 partial tracts)
A) FHA, FSA/RHS & VA Home Purchase Loans
B) Conventional Home Purchase Loans
C) Refinancings
D) Home Improvement Loans
E) Loans on Dwellings For 5+ Families
F) Non-occupant Loans on < 5 Family Dwellings (A B C & D)
Number
Average Value
Number
Average Value
Number
Average Value
Number
Average Value
Number
Average Value
Number
Average Value
LOANS ORIGINATED
14
$108,786
74
$110,522
219
$91,485
40
$24,013
0
$0
10
$68,960
APPLICATIONS APPROVED, NOT ACCEPTED
0
$0
11
$94,250
42
$76,821
10
$31,769
0
$0
1
$143,700
APPLICATIONS DENIED
2
$115,365
10
$81,398
84
$79,264
9
$16,828
1
$128,820
7
$72,696
APPLICATIONS WITHDRAWN
1
$60,540
6
$125,150
58
$95,592
3
$34,760
0
$0
0
$0
FILES CLOSED FOR INCOMPLETENESS
1
$47,580
3
$70,767
15
$120,975
0
$0
0
$0
0
$0
Aggregated Statistics For Year 2001 (Based on 4 partial tracts)
A) FHA, FSA/RHS & VA Home Purchase Loans
B) Conventional Home Purchase Loans
C) Refinancings
D) Home Improvement Loans
E) Loans on Dwellings For 5+ Families
F) Non-occupant Loans on < 5 Family Dwellings (A B C & D)
Number
Average Value
Number
Average Value
Number
Average Value
Number
Average Value
Number
Average Value
Number
Average Value
LOANS ORIGINATED
17
$90,525
72
$105,353
163
$91,563
24
$28,677
0
$0
9
$70,281
APPLICATIONS APPROVED, NOT ACCEPTED
0
$0
9
$74,302
27
$89,300
4
$15,040
0
$0
2
$78,070
APPLICATIONS DENIED
1
$91,550
13
$60,570
80
$88,811
10
$12,998
1
$610,460
3
$41,633
APPLICATIONS WITHDRAWN
1
$30,950
5
$123,164
44
$96,836
4
$14,060
0
$0
2
$75,855
FILES CLOSED FOR INCOMPLETENESS
0
$0
1
$248,770
10
$103,508
0
$0
0
$0
0
$0
Aggregated Statistics For Year 2000 (Based on 4 partial tracts)
A) FHA, FSA/RHS & VA Home Purchase Loans
B) Conventional Home Purchase Loans
C) Refinancings
D) Home Improvement Loans
F) Non-occupant Loans on < 5 Family Dwellings (A B C & D)
Number
Average Value
Number
Average Value
Number
Average Value
Number
Average Value
Number
Average Value
LOANS ORIGINATED
10
$81,920
67
$90,998
64
$67,326
35
$23,247
10
$62,153
APPLICATIONS APPROVED, NOT ACCEPTED
0
$0
7
$87,956
18
$71,870
5
$35,992
0
$0
APPLICATIONS DENIED
2
$62,230
23
$57,460
53
$87,306
12
$23,886
3
$39,757
APPLICATIONS WITHDRAWN
0
$0
5
$88,006
35
$72,667
3
$23,113
3
$54,913
FILES CLOSED FOR INCOMPLETENESS
0
$0
2
$64,060
4
$77,105
0
$0
0
$0
Aggregated Statistics For Year 1999 (Based on 2 partial tracts)
A) FHA, FSA/RHS & VA Home Purchase Loans
B) Conventional Home Purchase Loans
C) Refinancings
D) Home Improvement Loans
F) Non-occupant Loans on < 5 Family Dwellings (A B C & D)
Detailed PMIC statistics for the following Tracts:0104.00
, 0105.00
2003 - 2018 National Fire Incident Reporting System (NFIRS) incidents
According to the data from the years 2003 - 2018 the average number of fires per year is 26. The highest number of reported fire incidents - 54 took place in 2009, and the least - 6 in 2003. The data has a rising trend.
When looking into fire subcategories, the most reports belonged to: Structure Fires (74.1%), and Outside Fires (13.2%).
Fire incident types reported to NFIRS in Zip Code 19567

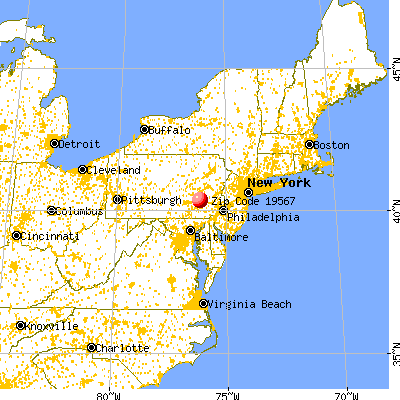


 Nearest zip codes: 19551, 19550, 17087, 19544, 17073, 17039.


 According to the data from the years 2003 - 2018 the average number of fires per year is 26. The highest number of reported fire incidents - 54 took place in 2009, and the least - 6 in 2003. The data has a rising trend.
 When looking into fire subcategories, the most reports belonged to: Structure Fires (74.1%), and Outside Fires (13.2%).